

Depth profile of reservoir water quality in the Southwest of Ethiopia
- PMID: 37501970
- PMCID: PMC10368769
- DOI: 10.1016/j.heliyon.2023.e17474
Depth profile of reservoir water quality in the Southwest of Ethiopia
Abstract
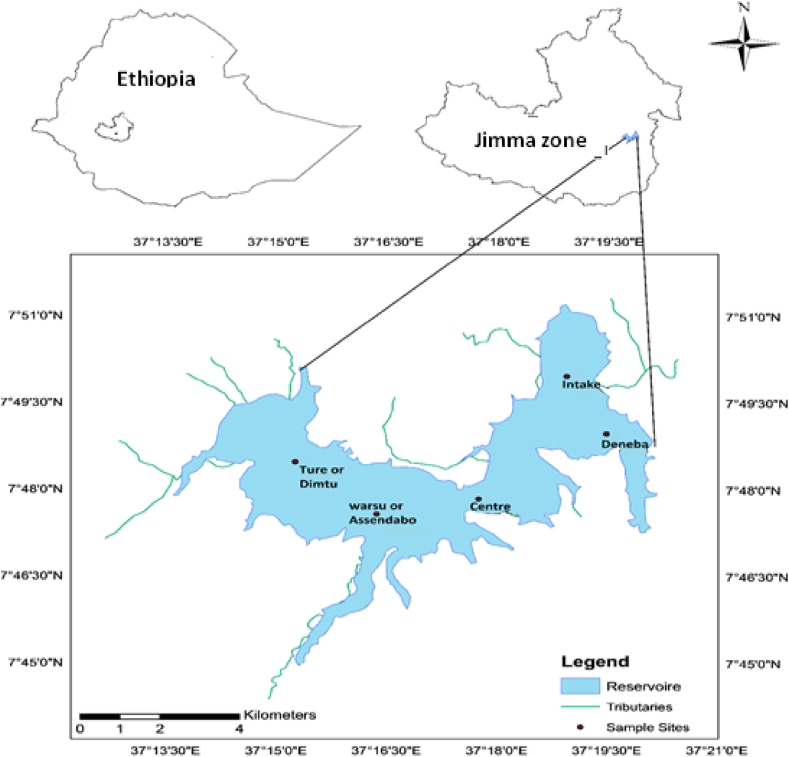
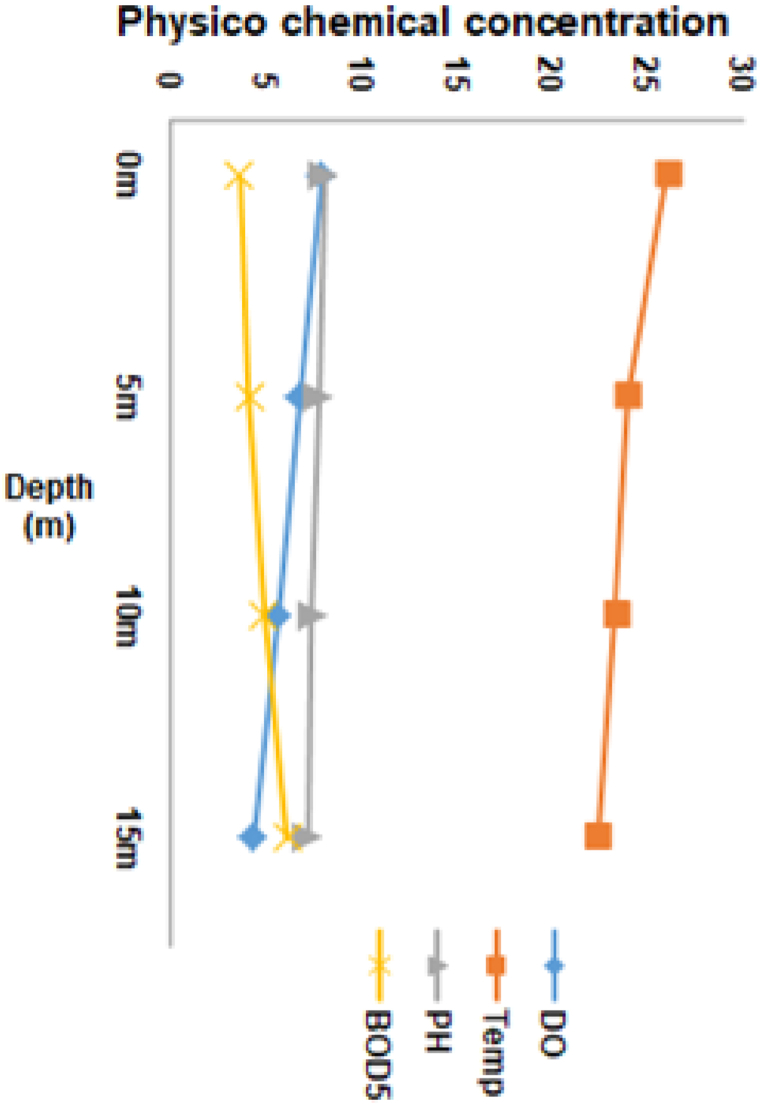
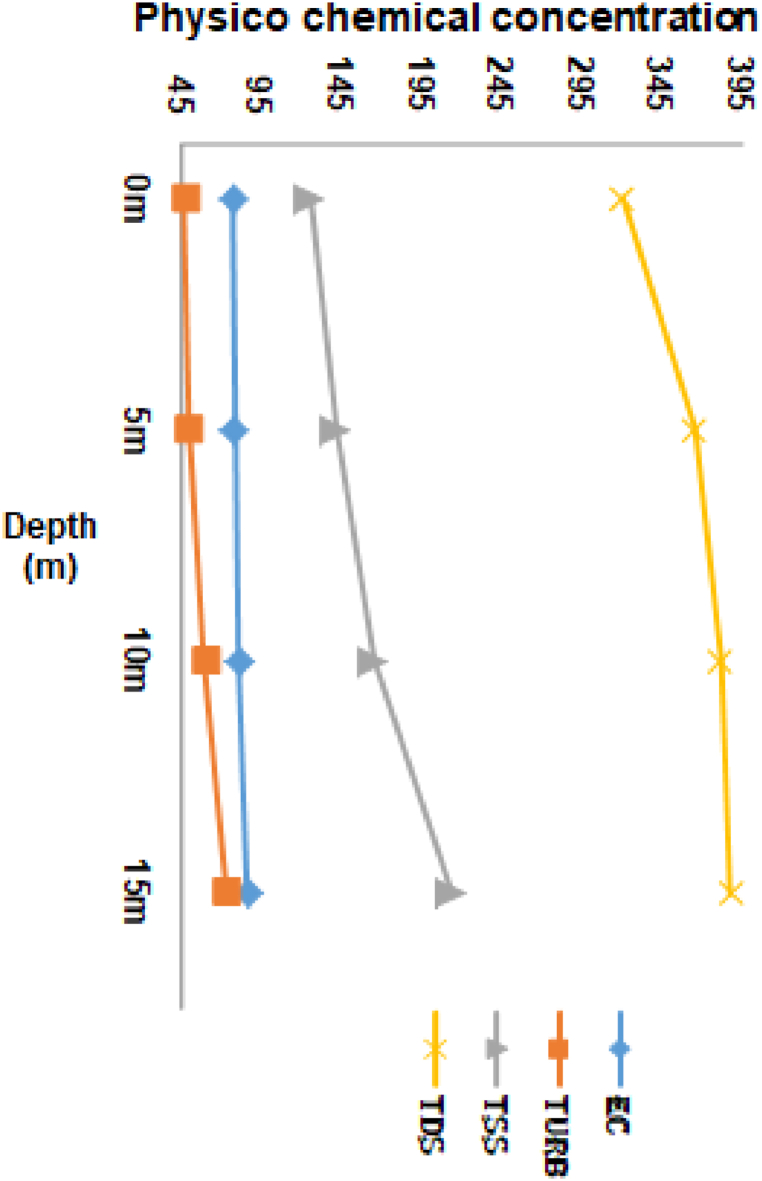
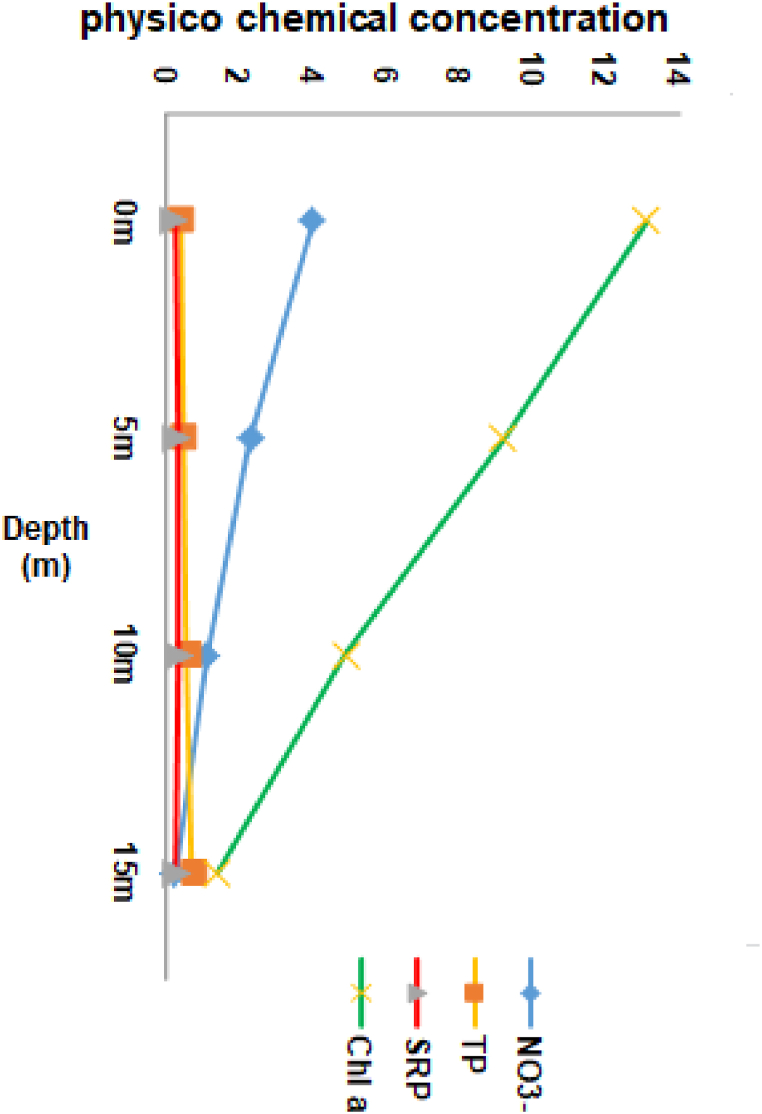
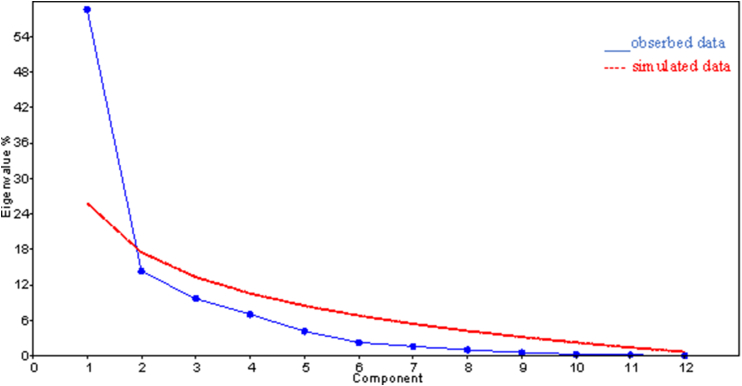
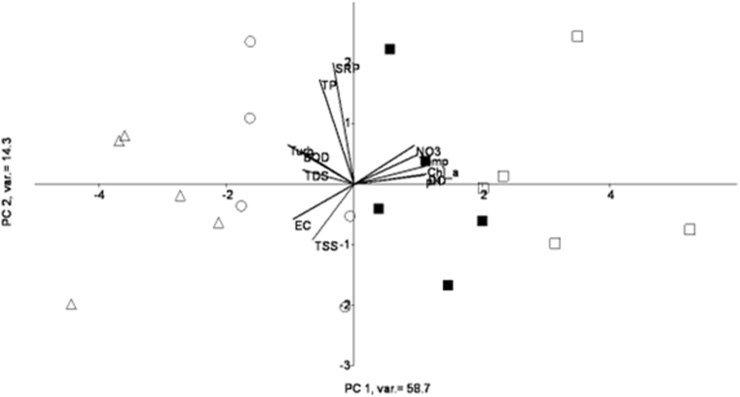
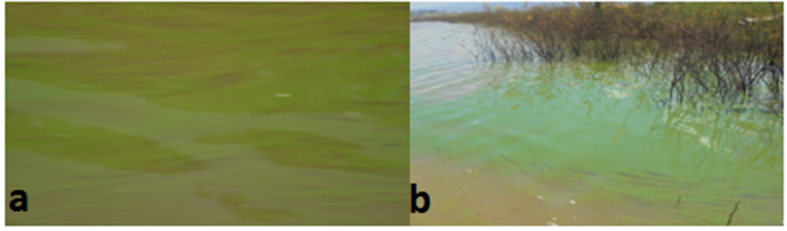
The objective of this research was to investigate the variation of water quality parameters at different depths of the Gilgel Gibe I reservoir in Oromia Jimma zone during wet seasons. Five stations within the reservoir were selected, and water quality parameters were determined at four different depths (surface, 5 m, 10 m, and 15 m). Water quality parameters were analyzed on-site using a HACH, HQ40d portable multi-meter, and turbidity was measured using Wag tech turbidity meter and in the laboratory using the standard method. Comparison of water quality parameters among depths were conducted using one-way ANOVA and Tukey's pairwise comparisons with 5% significance level. The probable contributing source of the investigated physicochemical water quality parameters at different depth was identified using Principal components analysis. The results show that depth wise except for total suspended solids (TSS), total dissolved solids (TDS), total phosphorus (TP) and soluble reactive phosphorus (SRP) the rest showed statistically significant difference at p < 0.05 level. Negative correlations were found between depth and dissolved oxygen (DO), water temperature, pH, nitrate (N03-) and chlorophyll a (Chl.a) while positive correlations were found between electrical conductivity (EC), biochemical oxygen demand (BOD5), turbidity and N03-. The study revealed that the release of nutrients associated with increased concentration of BOD5 at the bottom depth caused low concentration of dissolved oxygen due to oxygen consumption. This was further aggravated through the decomposition of organic matter, indicating organic pollution resulting from runoff from the catchment. The presence of dense masses of blue-green algae in the pelagic zone of Gilgel Gibe I reservoir suggested the presence of ample nutrients for its blooming and significant reduction of water quality, indicating possible eutrophic conditions. Therefore, catchment management is required to protect aquatic life and the reservoir function as a whole from reservoir water quality degradation.
Keywords: Chlorophyll a; Eutrophication; Gilgel gibe; Organic matter; Physicochemical.
© 2023 The Authors.
Conflict of interest statement
The authors confirm that we have no conflicts of interest to disclose and all authors agreed for submission of this manuscript to the Journal. In addition, this research did not receive any specific grant from funding agencies in the public, commercial, or not-for-profit sectors.
Figures
References
-
- Wagner T., Erickson L.E. Sustainable management of eutrophic lakes and reservoirs. J. Environ. Protect. 2017;8(4):436–463.
-
- Logan B., Taffs K.H. Relationship between diatoms and water quality (TN, TP) in sub-tropical east Australian estuaries. J. Paleolimnol. 2013;50(1):123–137.
-
- Zakeyuddin M.S., ASR M.S., Mohammad M.S., Mohd Fadzil N.F., Hashim Z.H., Wan Omar W.M. Spatial and temporal variations of water quality and trophic status in Bukit Merah Reservoir, Perak. Sains Malays. 2016;45(6):853–863.
-
- Corgosinho P.H.C., Pinto-Coelho R.M. Zooplankton biomass, abundance and allometric patterns along an eutrophic gradient at Furnas Reservoir (Minas Gerais, Brazil) Acta Limnol. Bras. 2006;18(2):213–224.
-
- El-Radaideh N. Water quality characteristics of zeklap reservoir water, Jordan. Int. J. Ecol. Dev. 2016;31(1):32–48.
LinkOut - more resources
Full Text Sources
