. 2023 Jul 26;15(3):e12453.
doi: 10.1002/dad2.12453. eCollection 2023 Jul-Sep.

A robust harmonization approach for cognitive data from multiple aging and dementia cohorts

Affiliations

A robust harmonization approach for cognitive data from multiple aging and dementia cohorts

Joseph Giorgio et al. Alzheimers Dement (Amst). .

Abstract

Introduction: Although many cognitive measures have been developed to assess cognitive decline due to Alzheimer's disease (AD), there is little consensus on optimal measures, leading to varied assessments across research cohorts and clinical trials making it difficult to pool cognitive measures across studies.

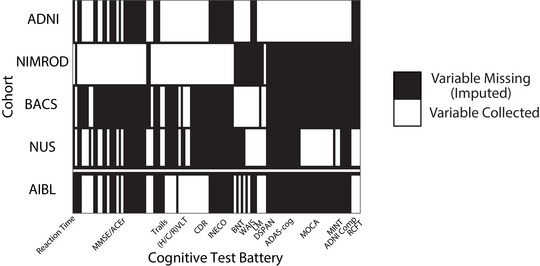
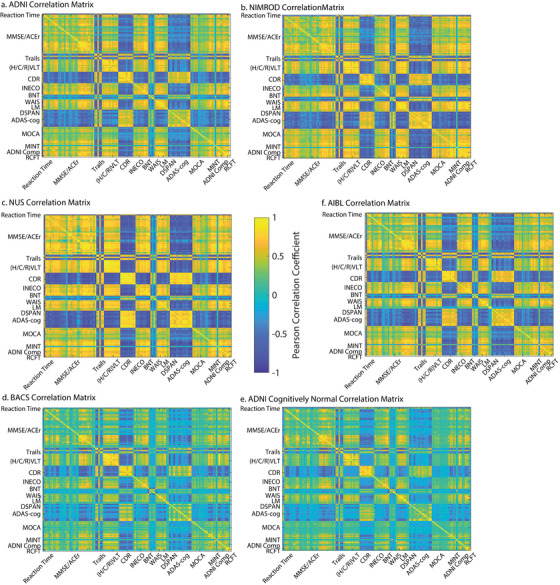
Methods: We used a two-stage approach to harmonize cognitive data across cohorts and derive a cross-cohort score of cognitive impairment due to AD. First, we pool and harmonize cognitive data from international cohorts of varying size and ethnic diversity. Next, we derived cognitive composites that leverage maximal data from the harmonized dataset.

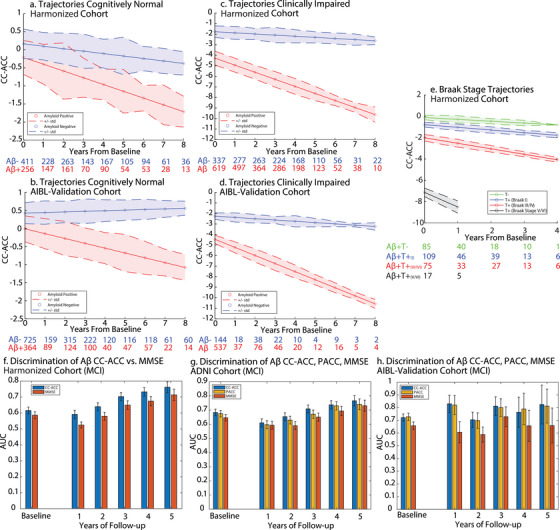
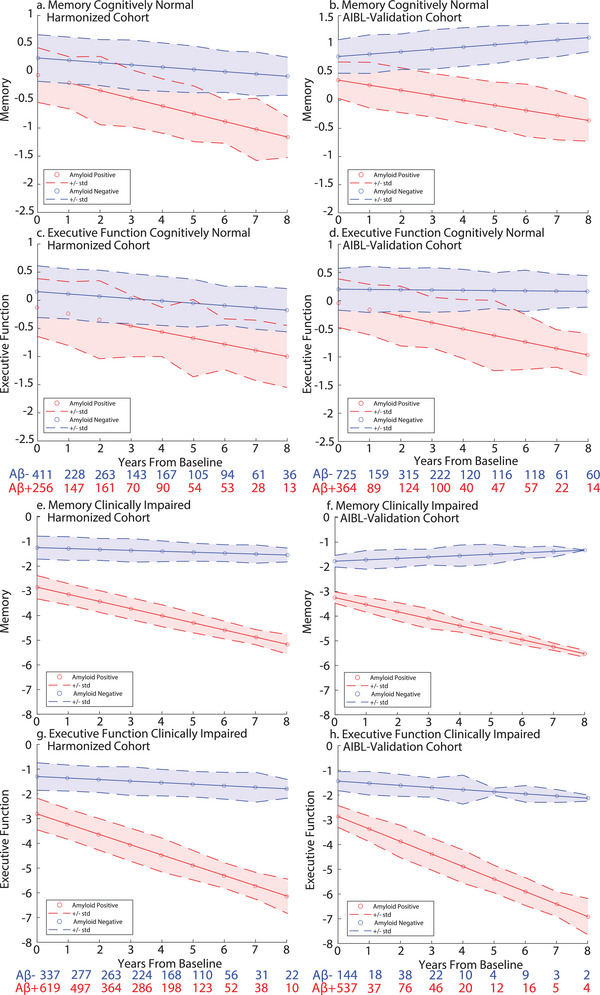
Results: We show that our cognitive composites are robust across cohorts and achieve greater or comparable sensitivity to AD-related cognitive decline compared to the Mini-Mental State Examination and Preclinical Alzheimer Cognitive Composite. Finally, we used an independent cohort validating both our harmonization approach and composite measures.

Discussion: Our easy to implement and readily available pipeline offers an approach for researchers to harmonize their cognitive data with large publicly available cohorts, providing a simple way to pool data for the development or validation of findings related to cognitive decline due to AD.


Conflict of interest statement

The authors declare no competing interests. Author disclosures are available in the supporting information.

Figures

FIGURE 1
FIGURE 1
Overlapping cognitive variables. Overlap between test and subtest level neuropsychological variables across the four harmonization cohorts (top) and the AIBL Validation cohort (bottom). Regions shaded white are variables that were collected in a given cohort, regions shaded black are variables that are not collected in a given cohort and are imputed using k‐NN imputation. ADAS‐Cog, Alzheimer's Disease Assessment Scale Cognitive subscale; ADNI, Alzheimer's Disease Neuroimaging Initiative; AIBL, Australian Imaging, Biomarker & Lifestyle Flagship Study of Ageing; BACS, Berkeley Aging Cohort Study; BNT, Boston Naming Test; CDR, Clinical Dementia Rating; DSPAN, Digit Span; (H/C/R)VLT, Hopkins/California/Rey Verbal Learning Tests; INECO, Institute of Cognitive Neurology Frontal Screening; k‐NN, k‐nearest neighbors; LM, Logical Memory; MINT, Multilingual Naming Test; MOCA, Montreal Cognitive Assessment; NIMROD, Neuroimaging of Inflammation in Memory and Related Other Disorders study; NUS, National University of Singapore; RCFT, Rey Complex Figure Test; WAIS, Wechsler Adult Intelligence Scale
FIGURE 2
FIGURE 2
Item‐to‐item correlation matrices. The neuropsychological item to item correlation matrices: a, entire ADNI sample correlation matrix; b, NIMROD correlation matrix; c, NUS correlation matrix; d, BACS correlation matrix; e, ADNI correlation matrix for subsample who were cognitively normal at baseline; f, AIBL Validation cohort. We observed highly reproducible loadings of the real variables and the imputed ADNI composites across each cohort, ADNI‐Mem versus C/H/RAVLT total (reference ADNI: R 2 = 89.3%; NUS: R 2 = 90.5%; NIMROD: R 2 = 94.6%; BACS: R 2 = 84.5%; AIBL: R 2 = 92.6%) and ADNI‐EF versus log(Trails B) (reference ADNI: R 2 = 85.1%; NUS: R 2 = 89.6%; NIMROD: R 2 = 89.9%; BACS: R 2 = 78.7%; AIBL, Trails B not collected). ADAS‐Cog, Alzheimer's Disease Assessment Scale Cognitive subscale; ADNI, Alzheimer's Disease Neuroimaging Initiative; AIBL, Australian Imaging, Biomarker & Lifestyle Flagship Study of Ageing; BACS, Berkeley Aging Cohort Study; BNT, Boston Naming Test; CDR, Clinical Dementia Rating; DSPAN, Digit Span; (H/C/R)VLT, Hopkins/California/Rey Verbal Learning Tests; INECO, Institute of Cognitive Neurology Frontal Screening; k‐NN, k‐nearest neighbors; LM, Logical Memory; MINT, Multilingual Naming Test; MOCA, Montreal Cognitive Assessment; NIMROD, Neuroimaging of Inflammation in Memory and Related Other Disorders study; NUS, National University of Singapore; RCFT, Rey Complex Figure Test; WAIS, Wechsler Adult Intelligence Scale
FIGURE 3
FIGURE 3
Cognitively normal trajectories: a, Harmonization cohort, b, AIBL Validation cohort. Expected trajectories for an Aβ– (blue) and an Aβ+ (red) 70‐year‐old women with an education of 14 years with no cognitive impairment (i.e., CN) at baseline. Clinically impaired trajectories: c, Harmonization cohort, d, AIBL Validation cohort. Plots show the expected trajectories for an Aβ− (blue) and an Aβ+ (red) 70‐year‐old woman with an education of 14 years with cognitive impairment (i.e., MCI or AD) at baseline. e, Braak stage trajectories. Expected trajectories for an Aβ+ 70‐year‐old woman with an education of 14 years who is tau negative (green), tau Braak I positive (blue), tau Braak III/IV positive (red), and tau Braak V/VI positive (black). Error bars represent standard deviation of the residual of the fit from the LME. Numbers below the plots show the sample size at different years of follow‐up. Discriminatory power of CC‐ACC for baseline Aβ status for MCI patients. f, Harmonization cohort, g, ADNI cohort, h, AIBL Validation Cohort. AUC of the receiver operating characteristic curve for a logistic regression predicting baseline Aβ. Blue bars represent the AUC for either the baseline CC‐ACC or the annualized rate of change of the CC‐ACC at different durations of follow‐up. Red bars represent the AUC for either the baseline MMSE or the annualized rate of change of the MMSE at different durations of follow‐up. Yellow bars represent the AUC for either the baseline PACC or the annualized rate of change of the PACC at different durations of follow‐up. Error bars indicate the standard deviation of the AUC across bootstraps. Aβ, amyloid beta; AD, Alzheimer's disease; ADNI, Alzheimer's Disease Neuroimaging Initiative; AIBL, Australian Imaging, Biomarker & Lifestyle Flagship Study of Ageing; AUC, area under the curve; CN, cognitively normal; CC‐ACC, Cross‐Cohort Alzheimer Cognitive Composite; LME, linear mixed effects; MCI, mild cognitive impairment; MMSE, Mini‐Mental State Examination; PACC, Preclinical Alzheimer Cognitive Composite
FIGURE 4
FIGURE 4
Executive function and memory trajectories. CN memory and executive function trajectories a, c. Harmonization cohort; b, d. AIBL Validation cohort. Expected trajectories for an Aβ− (blue) and an Aβ+ (red) 70‐year‐old women with an education of 14 years with no cognitive impairment (i.e., CN) at baseline. Error bars represent standard deviation of the residual of the fit from the LME model. Numbers below the plots show the sample size at different years of follow‐up. Clinically impaired memory and executive function trajectories. e, g, Harmonization cohort; f, h, AIBL Validation cohort. Expected trajectories for an Aβ− (blue) and an Aβ+ (red) 70‐year‐old woman with an education of 14 years with cognitive impairment (i.e., MCI or AD) at baseline. AD, Alzheimer's disease; AIBL, Australian Imaging, Biomarker & Lifestyle Flagship Study of Ageing; CN, cognitively normal; LME, linear mixed effects; MCI, mild cognitive impairment

Similar articles

Cited by

References

    1. Kozauer N, Katz R. Regulatory innovation and drug development for early‐stage Alzheimer's disease. N Engl J Med. 2013;368:1169‐1171. doi:10.1056/nejmp1302513 - DOI - PubMed
    1. Albert M, Soldan A, Gottesman R, et al. Cognitive changes preceding clinical symptom onset of mild cognitive impairment and relationship to ApoE genotype. Curr Alzheimer Res. 2014;11:773‐784. doi:10.2174/156720501108140910121920 - DOI - PMC - PubMed
    1. Ellis KA, Bush AI, Darby D, et al. The Australian Imaging, Biomarkers and Lifestyle (AIBL) study of aging: methodology and baseline characteristics of 1112 individuals recruited for a longitudinal study of Alzheimer's disease. Int Psychogeriatrics. 2009;21:672‐687. doi:10.1017/S1041610209009405 - DOI - PubMed
    1. Petersen RC, Aisen PS, Beckett LA, et al. Alzheimer's Disease Neuroimaging Initiative (ADNI): clinical characterization. Neurology. 2010;74:201. doi:10.1212/WNL.0B013E3181CB3E25 - DOI - PMC - PubMed
    1. Sager MA, Hermann B, La Rue A. Middle‐aged children of persons with Alzheimer's disease: APOE genotypes and cognitive function in the Wisconsin Registry for Alzheimer's prevention. J Geriatr Psychiatry Neurol. 2005;18:245‐249. doi:10.1177/0891988705281882 - DOI - PubMed

LinkOut - more resources