. 2023 Jun 28;26(7):107224.
doi: 10.1016/j.isci.2023.107224. eCollection 2023 Jul 21.

Preclinical evaluation of PHH-1V vaccine candidate against SARS-CoV-2 in non-human primates

Affiliations

Preclinical evaluation of PHH-1V vaccine candidate against SARS-CoV-2 in non-human primates

Antoni Prenafeta et al. iScience. .

Abstract

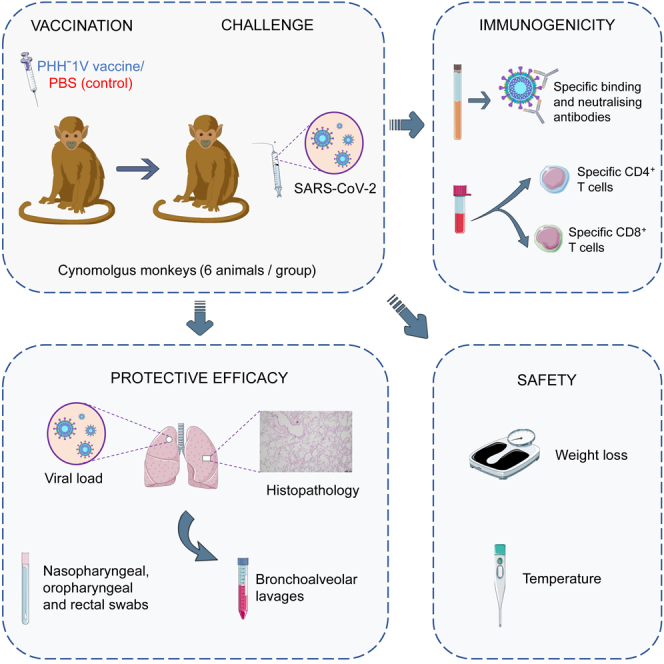
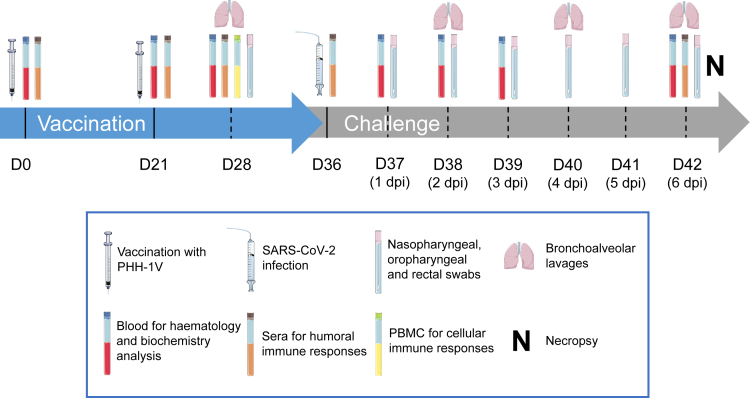
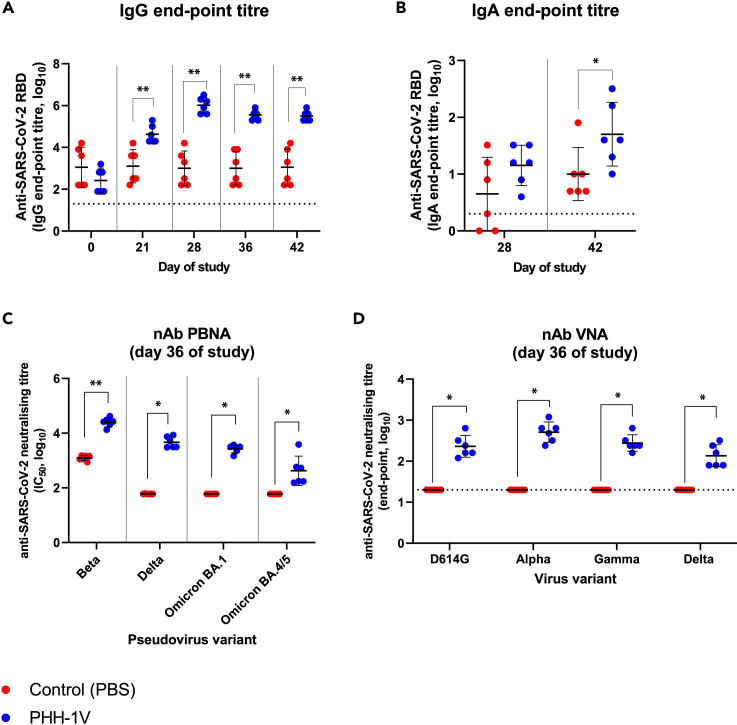
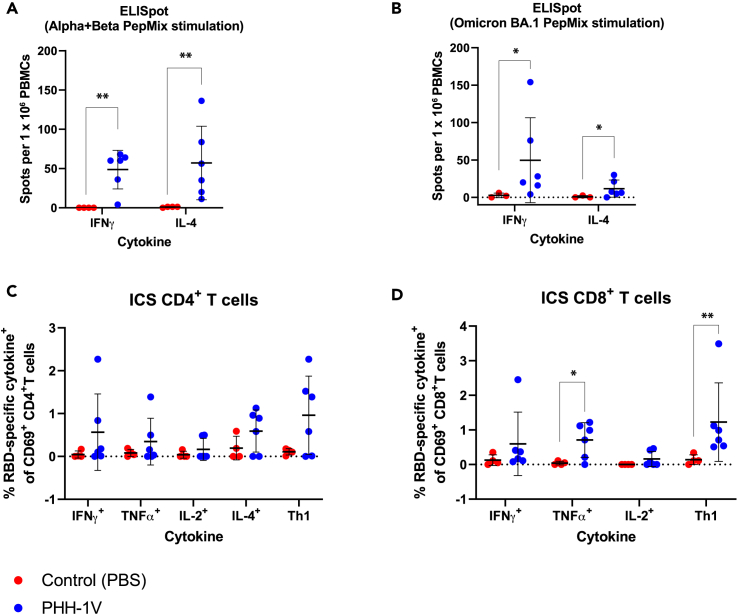
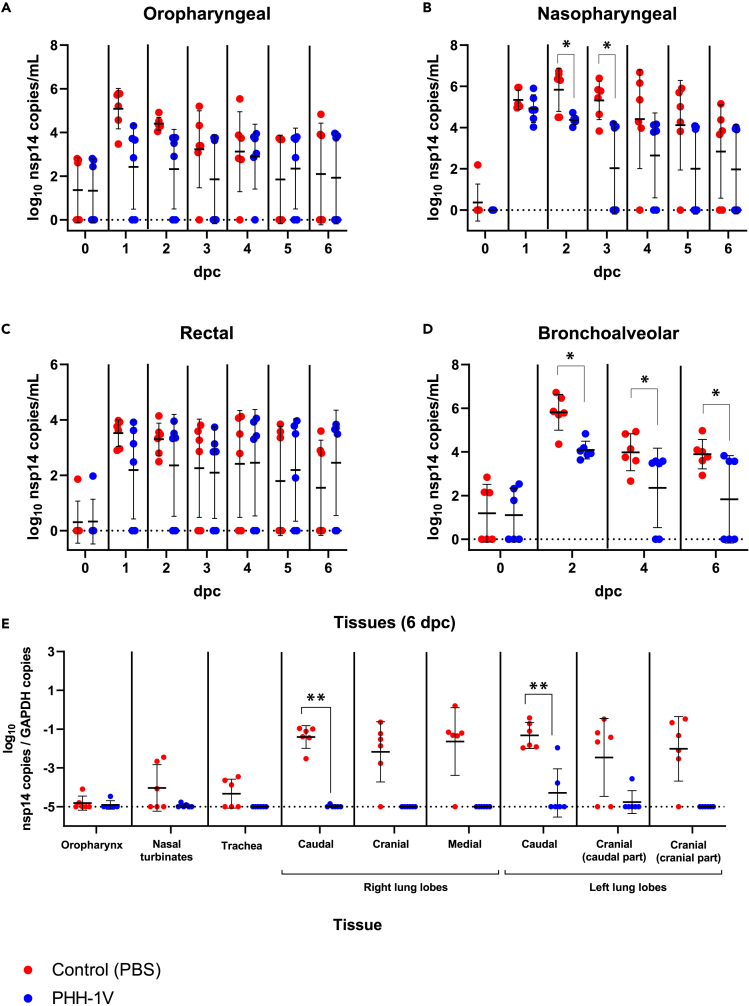
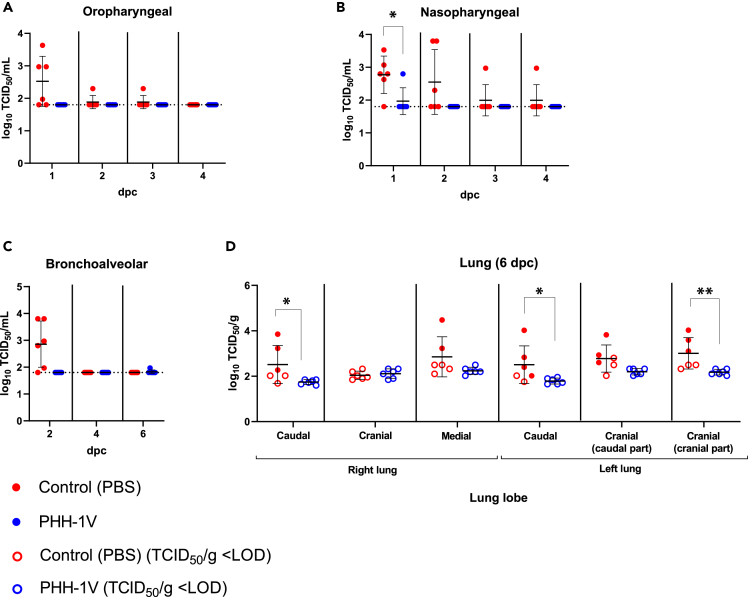
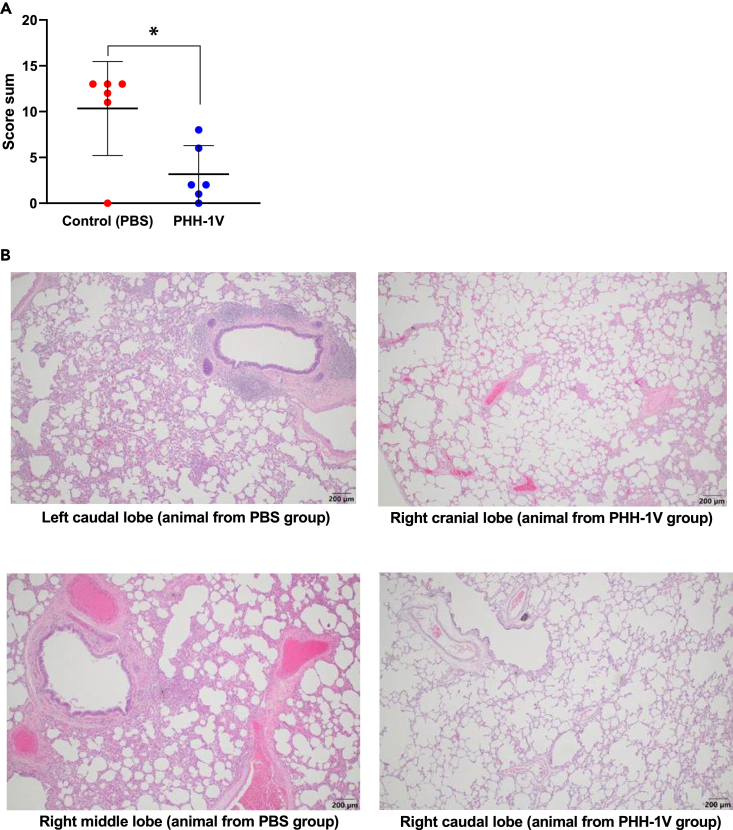
SARS-CoV-2 emerged in December 2019 and quickly spread worldwide, continuously striking with an unpredictable evolution. Despite the success in vaccine production and mass vaccination programs, the situation is not still completely controlled, and therefore accessible second-generation vaccines are required to mitigate the pandemic. We previously developed an adjuvanted vaccine candidate coded PHH-1V, based on a heterodimer fusion protein comprising the RBD domain of two SARS-CoV-2 variants. Here, we report data on the efficacy, safety, and immunogenicity of PHH-1V in cynomolgus macaques. PHH-1V prime-boost vaccination induces high levels of RBD-specific IgG binding and neutralizing antibodies against several SARS-CoV-2 variants, as well as a balanced Th1/Th2 cellular immune response. Remarkably, PHH-1V vaccination prevents SARS-CoV-2 replication in the lower respiratory tract and significantly reduces viral load in the upper respiratory tract after an experimental infection. These results highlight the potential use of the PHH-1V vaccine in humans, currently undergoing Phase III clinical trials.

Keywords: Health sciences; Immune response; Immunology; Microbiology.


Conflict of interest statement

Authors indicated as “1” are employees of HIPRA, a private pharmaceutical company that develops and manufactures biological medicines such as vaccines. IrsiCaixa, UPF, Cynbiose, CIRI, VirNext, and CReSA have received financial support from HIPRA. Several patent applications have been filed by HIPRA Scientific S.L.U. and Laboratorios HIPRA, S.A. on different SARS-CoV-2 vaccine candidates and SARS-CoV-2 subunit vaccines, including the novel recombinant RBD fusion heterodimer PHH-1V. A.B., A.P., L.G., L.F., E.P., J.P., T.P., and C.G. are the inventors of these patent applications.

Figures

None
Graphical abstract
Figure 1
Figure 1
Study timeline Cynomolgus macaques (6 per group) were immunized intramuscularly on days 0 and 21 with 40 μg of PHH-1V vaccine or with PBS as mock vaccine (control). On D36, animals were challenged intranasally and intratracheally with 2 × 106 PFU of SARS-CoV-2. Different types of samples were taken at the timepoints indicated in the picture. All animals were euthanized on D42 (7 dpc). D, day; dpc, days post-challenge. Figure was generated using images assembled from Servier Medical Art (https://smart.servier.com).
Figure 2
Figure 2
Humoral immune responses in cynomolgus macaques on PHH-1V vaccination (A) IgG antibody titers against RBD were assessed by ELISA in sera from control animals (PBS, n = 6) and vaccinated animals (PHH-1V, n = 6) on days 0, 21, 28, 36 and 42. Each data point represents an individual animal with bars indicating the mean and the SD. Log10-transformed data were analyzed by means of a linear mixed effects model. (B) RBD-specific IgA antibody titers were assessed by ELISA in bronchoalveolar lavages (BAL) from control and PHH-1V vaccinated animals 7 days post-immunization (D28) and 6 days post-challenge (D42). Each data point represents an individual animal with bars indicating the mean and the SD. Log10-transformed data were analyzed using a Mann-Whitney’s U test. (C) Neutralizing antibody response was analyzed on D36 (pre-challenge) by pseudoviruses-based neutralization assay (PBNA) against Beta, Delta, and Omicron (BA.1 and BA.4/BA.5) SARS-CoV-2 variants in macaques immunized with the PHH-1V vaccine (n = 6) and control animals (PBS, n = 6). Neutralizing titers are expressed as log10 IC50, and limit of detection is shown as a horizontal dotted line. Each data point represents an individual animal with bars indicating the mean and the SD. Data were analyzed using Mann-Whitney U-tests or one-sample Wilcoxon tests against the null H0: μ = 1.80. (D) SARS-CoV-2 neutralizing antibodies were analyzed by the microneutralization test (MNT) on D36 against D614G strain and Alpha, Gamma, and Delta variants in macaques. Limit of detection is shown as a horizontal dotted line. Each data point represents an individual animal with bars indicating the mean and the SD. Data were analyzed using one-sample Wilcoxon tests against the null H0: μ = 1.30. (∗p < 0.05, ∗∗p < 0.01).
Figure 3
Figure 3
Cellular immune responses in cynomolgus macaques on PHH-1V vaccination (A and B) PBMCs were isolated 7 days post-immunization (dpi) (D28) in PHH-1V vaccinated (n = 6) and PBS-mock vaccinated control (n = 3 or 4) group and then they were stimulated with an RBD peptide pool from Alpha and Beta variants (A) or Omicron (BA.1) variant (B) IFNɣ+- and IL-4+-expressing cells were determined by ELISpot assay. Each data point represents an individual animal with bars indicating the mean and the SD. Arcsine square root-transformed percentage data were analyzed using generalized least squares models. (C and D) PBMC from vaccinated (PHH-1V, n = 6) and control (PBS, n = 4) cynomolgus macaques were isolated 7 dpi (D28). PBMCs were stimulated with an RBD peptide pool from Alpha and Beta variants and analyzed by ICS. Frequencies of cytokine expressing CD4+ T cells (C) and CD8+ T cells (D) are shown. Frequencies of CD4+ and CD8+ T cells expressing Th1-like cytokines (IFNɣ, TNFα and/or IL-2) are also depicted. Arcsine square root-transformed percentage data were analyzed using generalized least squares models. Basal expression of cytokines stimulated with media was considered the background value and was subtracted from the peptide-specific response. Two animals from the control group were excluded in both assays (ELISpot and ICS) because one showed a consistent RBD-specific response and the other showed a higher percentage of dead cells in their PBMCs. In the ELISpot assay stimulated with Omicron (BA.1) peptides, another one was excluded for not having enough cells to perform the analysis. Each data point represents an individual animal with bars indicating the mean and the SD. Data were analyzed using Welch’s permutation t-tests or Mann-Whitney U-tests. (∗p < 0.05, ∗∗p < 0.01).
Figure 4
Figure 4
Quantification of viral RNA copies in lungs and upper respiratory tract of infected animals (A–D) SARS-CoV-2 genomic RNA copies were measured by RT-qPCR in oropharyngeal swabs (A), nasopharyngeal swabs (B), rectal swabs (C) and BAL (D) from PHH-1V-vaccinated (n = 6) and control (n = 6) animals at different times post-challenge. Each data point represents an individual animal with bars indicating the mean and the SD. Log10-transformed data were analyzed using linear mixed effects models and gRNA is expressed as log10 (nsp14 copies/mL). (E) At 6 dpc (D42), animals were euthanized and viral RNA copies were measured in lungs, trachea, nasal turbinates, and oropharynx by RT-qPCR. Genomic RNA is expressed as log10 (nsp14 copies/GAPDH copies). Each data point represents an individual animal with bars indicating the mean and the SD. Data were analyzed using Mann-Whitney U-tests or one-sample Wilcoxon tests against the null H0: μ = −5. (∗p < 0.05, ∗∗p < 0.01). dpc, days post-challenge.
Figure 5
Figure 5
Quantification of infectious viral load in lungs and upper respiratory tract of infected animals (A–C) Infectious viral load was measured by TCID50 assay in oropharyngeal swabs (A), nasopharyngeal swabs (B) and BAL (C) from PHH-1V-vaccinated (n = 6) and control (n = 6) animals at different times post-challenge. Results were expressed as log10 TCID50/mL, and the limit of detection (LOD) is indicated as a horizontal dotted line. Each data point represents an individual animal with bars indicating the mean and the SD. Data were analyzed using Mann-Whitney U-tests or one-sample Wilcoxon tests against the null H0: μ = 1.80. (D) At 6 dpc (D42), animals were euthanized and infectious virus were measured in lungs by TCID50 assay. Viral load is expressed as log10 TCID50/g. Hollow points indicate values under the limit of detection while solid points indicate values above the limit. Each data point represents an individual animal with bars indicating the mean and the SD. Data were analyzed using Mann-Whitney U-tests. (∗p < 0.05, ∗∗p < 0.01). dpc, days post-challenge.
Figure 6
Figure 6
Lung histopathology in infected animals Histopathological analyses were performed in lungs sections of 4 μm from PHH-1V-vaccinated and controls animals euthanized 6 dpi. (A) Total inflammation score calculated as the sum of 6 lobes (right caudal, left caudal, right cranial, left cranial [cranial part], left cranial [caudal part] and right middle). Each data point represents an individual animal with bars indicating the mean and the SD. Data were analyzed using a permutation Welch’s t-test (∗p < 0.05). (B) Illustrative microphotographs of bronchointerstitial inflammation in one or more lung sections in males and females (200 μm). Lung sections from control animals on the left side, and sections from PHH-1V vaccinated animals on the right side.
Figure 7
Figure 7
Safety assessment of cynomolgus macaques vaccinated with PHH-1V and PBS (control group) (A) Body temperature was monitored with a rectal thermometer around the administration and infection days in PHH-1V-vaccinated (n = 6) and control (n = 6) animals. Each data point represents an individual animal with bars indicating the mean and the SD. Temperature data were analyzed using a linear mixed effects model. (B) Animals were weighed once weekly throughout the acclimatization phase and during the vaccination phase. They were weighed three times a week after experimental infection. The figure shows body weight recorded throughout the study for each PHH-1V-vaccinated or control animal. Each data point represents an individual animal with bars indicating the mean and the SD. Body weight data were analyzed using a linear mixed effects model.

References

    1. Worobey M., Levy J.I., Malpica Serrano L., Crits-Christoph A., Pekar J.E., Goldstein S.A., Rasmussen A.L., Kraemer M.U.G., Newman C., Koopmans M.P.G., et al. The Huanan Seafood Wholesale Market in Wuhan was the early epicenter of the COVID-19 pandemic. Science. 2022;377:951–959. - PMC - PubMed
    1. Mallah S.I., Ghorab O.K., Al-Salmi S., Abdellatif O.S., Tharmaratnam T., Iskandar M.A., Sefen J.A.N., Sidhu P., Atallah B., El-Lababidi R., Al-Qahtani M. COVID-19: breaking down a global health crisis. Ann. Clin. Microbiol. Antimicrob. 2021;20:35. - PMC - PubMed
    1. WHO Weekly epidemiological update on COVID-19-14 September 2022. 2022. https://www.who.int/publications/m/item/weekly-epidemiological-update-on...
    1. Goepfert P.A., Fu B., Chabanon A.L., Bonaparte M.I., Davis M.G., Essink B.J., Frank I., Haney O., Janosczyk H., Keefer M.C., et al. Safety and immunogenicity of SARS-CoV-2 recombinant protein vaccine formulations in healthy adults: interim results of a randomised, placebo-controlled, phase 1-2, dose-ranging study. Lancet Infect. Dis. 2021;21:1257–1270. - PMC - PubMed
    1. Li M., Wang H., Tian L., Pang Z., Yang Q., Huang T., Fan J., Song L., Tong Y., Fan H. COVID-19 vaccine development: milestones, lessons and prospects. Signal Transduct. Target. Ther. 2022;7:146. - PMC - PubMed

LinkOut - more resources