. 2023 Jul 12:13:1183340.
doi: 10.3389/fcimb.2023.1183340. eCollection 2023.

Dynamic full-field optical coherence tomography for live-cell imaging and growth-phase monitoring in Aspergillus fumigatus

Affiliations

Dynamic full-field optical coherence tomography for live-cell imaging and growth-phase monitoring in Aspergillus fumigatus

Thomas Maldiney et al. Front Cell Infect Microbiol. .

Abstract

Introduction: The diagnosis of cutaneous manifestations of deep mycoses relies on both histopathological and direct examinations. Yet, the current diagnostic criteria cannot prevent missed cases, including invasive aspergillosis, which requires the development of a novel diagnostic approach and imaging tools. We recently introduced the use of dynamic full-field optical coherence tomography (D-FF-OCT) in fungal diagnostics with a definition approaching that of conventional microscopy and the ability to return metabolic information regarding different fungal species. The present work focuses on subcellular dynamics and live-cell imaging of Aspergillus fumigatus with D-FF-OCT to follow the fungal growth stages.

Methods: The A. fumigatus ATCC 204305 quality-control strain was used for all imaging experiments, following incubation times varying between 24 and 72 h at 30°C in a humidified chamber on Sabouraud dextrose agar. Fungal growth was subsequently monitored with D-FF-OCT for up to 5 h at room temperature and following the pharmacological stress of either voriconazole, amphotericin B, or caspofungin gradient concentration.

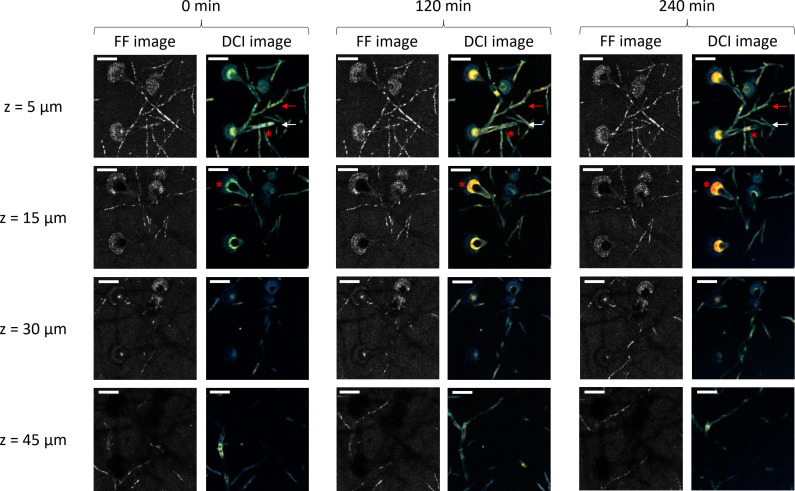
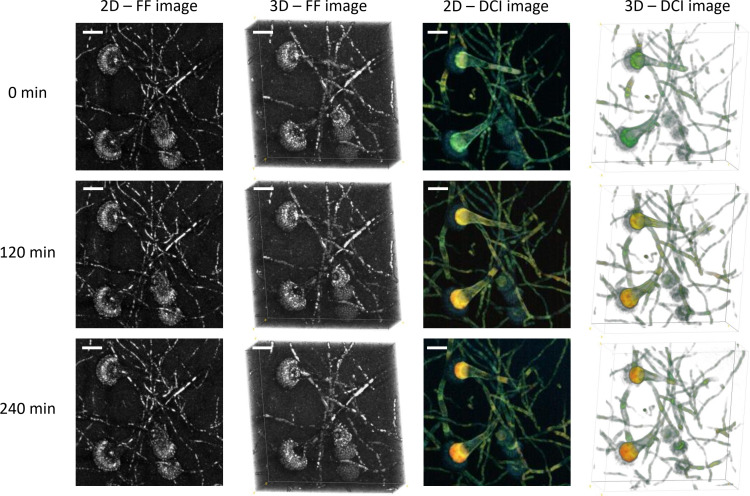
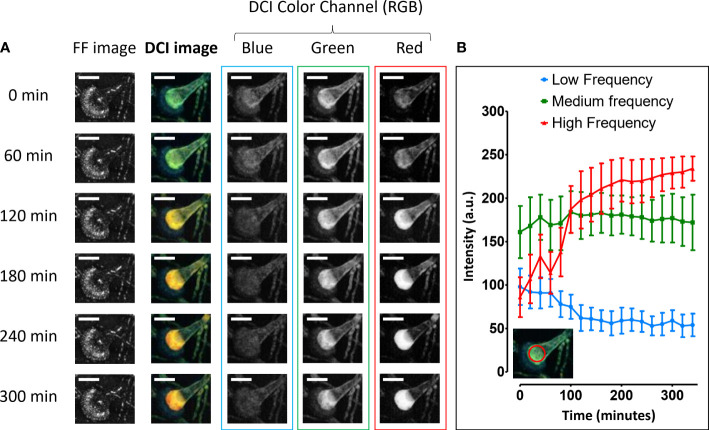
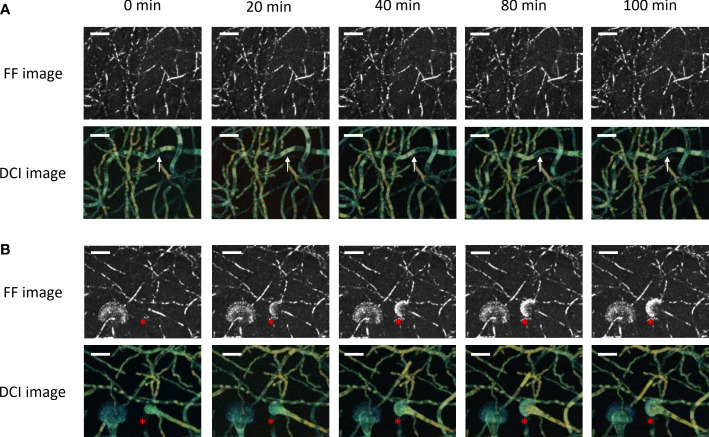
Results: D-FF-OCT images allow not only the visualization of intracellular trafficking of vacuoles but also an evolving dynamic segmentation of conidiophores depending on the chronological development and aging of the hyphae or the effect of antifungal treatment. The same applies to conidial heads, with the most intense D-FF-OCT signal coming from vesicles, revealing a changing dynamic within a few hours only, as well as complete extinction following subsequent drying of the Sabouraud dextrose agar.

Discussion: These results provide additional data on the ability of D-FF-OCT to monitor some of the main life cycle processes, dynamics, and intracellular trafficking of vacuoles in A. fumigatus, with or without the effect of pharmacological stress. Such complementary metabolic information could help both clinicians and microbiologists in either mechanistic studies toward experimental mycology or the development of a potential D-FF-OCT-guided diagnosis of superficial fungal infections.

Keywords: Aspergillus fumigatus; dynamic full-field optical coherence tomography; fungal metabolism; invasive fungal infections; live-cell imaging.


Conflict of interest statement

The authors declare that the research was conducted in the absence of any commercial or financial relationships that could be construed as a potential conflict of interest.

Figures

Figure 1
Figure 1
In-depth full-field (FF)- and dynamic full-field optical coherence tomography (D-FF-OCT) imaging of Aspergillus fumigatus growth on Sabouraud dextrose agar for 240 min following a 24 h incubation at 30°C in a humidified chamber. Each image corresponds to a 5-µm-deep axial Z-projection of the same region of interest at different times (0, 120, and 240 min) and depths (5, 15, 30, and 45 µm). The scale bar represents 25 µm. The composite RGB DCI image translates each pixel movement as a color (red for high frequencies/fast movements, green for medium frequencies/intermediate movements, and blue for low frequencies/slow movements). The red arrows show a conidiophore with a stable DCI signal in time. The white arrows show a conidiophore with an evolving DCI signal in time. The red asterisks identify intracellular vacuoles.
Figure 2
Figure 2
Three-dimensional FF- and D-OCT imaging of Aspergillus fumigatus growth on Sabouraud dextrose agar for 240 min following a 24 h incubation at 30°C in a humidified chamber. Each 2D image corresponds to a 50-µm-deep axial Z-projection of the same region of interest at different times (0, 120, and 240 min). Each 3D image corresponds to a 50-µm-deep axial volume reconstruction of the same region of interest at different times (0, 120, and 240 min). The scale bar represents 25 µm. The composite RGB DCI image translates each pixel movement as a color (red for high frequencies/fast movements, green for medium frequencies/intermediate movements, and blue for low frequencies/slow movements). The background noise was modified to white for the three-dimensional D-OCT reconstruction to enhance the visualization of dynamic contrasts within the conidial heads.
Figure 3
Figure 3
Whole-volume D-OCT image analysis of Aspergillus fumigatus growth on Sabouraud dextrose agar for 300 min following a 24 h incubation at 30°C in a humidified chamber. The three RGB DCI image color channels are displayed as 50-µm-deep axial Z-projections of a conidial head at different times (0, 60, 120, 180, 240, and 300 min): red for high frequencies/fast movements, green for medium frequencies/intermediate movements, and blue for low frequencies/slow movements (A). The corresponding histogram displays the evolution of each color channel intensity signal within the red circular region of interest located inside the conidial head vesicle for approximately 5 h (B). The scale bar represents 25 µm.
Figure 4
Figure 4
Whole-volume FF- and D-OCT live imaging of Aspergillus fumigatus growth on Sabouraud dextrose agar for 100 min following a 24 h incubation at 30°C in a humidified chamber. The images display a 50-µm-deep axial Z-projection of the conidiophores (A) and conidial heads (B) at different times (0, 20, 40, 80, and 100 min). The scale bar represents 25 µm. The composite RGB DCI image translates each pixel movement as a color (red for high frequencies/fast movements, green for medium frequencies/intermediate movements, and blue for low frequencies/slow movements). The white arrows show a conidiophore with vacuole trafficking and evolving DCI signal in time. The red asterisks locate the formation of the conidial head.

References

    1. Amich J., Mokhtari Z., Strobel M., Vialetto E., Sheta D., Yu Y., et al. . (2020). Three-dimensional light sheet fluorescence microscopy of lungs to dissect local host immune-aspergillus fumigatus interactions. Goldman GH editor. mBio. 11 (1), e02752–e02719. doi: 10.1128/mBio.02752-19 - DOI - PMC - PubMed
    1. Apelian C., Harms F., Thouvenin O., Boccara A. C. (2016). Dynamic full field optical coherence tomography: subcellular metabolic contrast revealed in tissues by interferometric signals temporal analysis. BioMed. Opt Express. 7 (4), 1511. doi: 10.1364/BOE.7.001511 - DOI - PMC - PubMed
    1. Baltussen T. J. H., Zoll J., Verweij P. E., Melchers W. J. G. (2020). Molecular mechanisms of conidial germination in Aspergillus spp. Microbiol. Mol. Biol. Rev. 84 (1), e00049–e00019. doi: 10.1128/MMBR.00049-19 - DOI - PMC - PubMed
    1. Cole D. C., Govender N. P., Chakrabarti A., Sacarlal J., Denning D. W. (2017). Improvement of fungal disease identification and management: combined health systems and public health approaches. Lancet Infect. Diseases. 17 (12), e412–e419. doi: 10.1016/S1473-3099(17)30308-0 - DOI - PubMed
    1. Czymmek K. J., Whallon J. H., Klomparens K. L. (1994). Confocal microscopy in mycological research. Exp. Mycology. 18 (4), 275–293. doi: 10.1016/S0147-5975(06)80001-0 - DOI

Publication types

LinkOut - more resources