. 2023 Jul 26;4(4):e336.
doi: 10.1002/mco2.336. eCollection 2023 Aug.

Phosphatidylserine decarboxylase downregulation in uric acid‑induced hepatic mitochondrial dysfunction and apoptosis

Affiliations

Phosphatidylserine decarboxylase downregulation in uric acid‑induced hepatic mitochondrial dysfunction and apoptosis

Ning Liu et al. MedComm (2020). .

Abstract

The molecular mechanisms underlying uric acid (UA)-induced mitochondrial dysfunction and apoptosis have not yet been elucidated. Herein, we investigated underlying mechanisms of UA in the development of mitochondrial dysfunction and apoptosis. We analyzed blood samples of individuals with normal UA levels and patients with hyperuricemia. Results showed that patients with hyperuricemia had significantly elevated levels of alanine aminotransferase (ALT) and aspartate aminotransferase (AST) levels, which may indicate liver or mitochondrial damage in patients with hyperuricemia. Subsequently, lipidomic analysis of mouse liver tissue mitochondria and human liver L02 cell mitochondria was performed. Compared with control group levels, high UA increased mitochondrial phosphatidylserine (PS) and decreased mitochondrial phosphatidylethanolamine (PE) levels, whereas the expression of mitochondrial phosphatidylserine decarboxylase (PISD) that mediates PS and PE conversion was downregulated. High UA levels also inhibited signal transducer and activator of transcription 3 (STAT3) phosphorylation as well as mitochondrial respiration, while inducing apoptosis both in vivo and in vitro. Treatment with allopurinol, overexpression of PISD, and lyso-PE (LPE) administration significantly attenuated the three above-described effects in vitro. In conclusion, UA may induce mitochondrial dysfunction and apoptosis through mitochondrial PISD downregulation. This study provides a new perspective on liver damage caused by hyperuricemia.

Keywords: STAT3; apoptosis; lipidomics; mitochondrial dysfunction; phosphatidylserine decarboxylase.


Conflict of interest statement

The authors declare no competing interest.

Figures
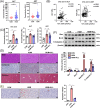
FIGURE 1
FIGURE 1
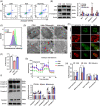
Changes in alanine aminotransferase (ALT) and aspartate aminotransferase (AST) of hyperuricemia patients and high uric acid (UA) causes liver damage and apoptosis in mice. (A) Serum ALT and AST levels in subjects with normal UA levels and patients with hyperuricemia. (B) Correlation analysis between UA and serum ALT or AST. (C) Serum UA, ALT, and AST in mice of three groups (CON group, HUM group, HUM+ALL group). (D) Mice liver histology as determined via hematoxylin and eosin (H&E), Oil Red O, and Masson's trichrome staining. (E) TUNEL staining was performed to detect cell apoptosis in the livers of mice. Apoptotic cells were identified by the presence of brown staining (red arrows). (F) Bcl‐2, Bax, and cleaved caspase‐3 protein levels in mouse livers were detected via western blotting. Data are presented as means ± SEM. *p < 0.05, **p < 0.01, ****p < 0.0001, ns indicates no significance. CON, control; HUM, mouse model of hyperuricemia; HUM+ALL allopurinol treatment group.
FIGURE 2
FIGURE 2
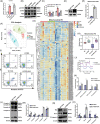
Uric acid suppressed the expression of phosphatidylserine decarboxylase (PISD) and the conversion of phosphatidylserine (PS) and phosphatidylethanolamine (PE) in vivo. (A) Principal component analysis (PCA) score plots based on mouse hepatic mitochondrial lipids identified via lipidomics. Dots represent each mouse of the CON group (red dots, n = 8), HUM group (green dots, n = 8), and HUM+ALL group (blue dots, n = 8). (B and C) Heatmap of the number of differentially abundant PSs (B) and PEs (C) in mouse liver mitochondria of three groups. (D) The quantification of total PS and total PE was performed in liver mitochondria of CON, HUM, and HUM+ALL mice, and the PS/PE ratio was calculated. (E) Mechanism of the PISD‐mediated conversion of PS to PE in mitochondria. (F) Bioinformatics analyses predicted an association between PISD and the STAT3/Bcl‐2 pathway (http://genemania.org/). (G) Pisd mRNA levels were determined via real‐time PCR of mouse liver tissues. (H) Western blotting was performed to detect total PISD and p‐STAT3 (Tyr705)/STAT3 levels and mitochondrial PISD in the livers of mice from the three groups. (I) Band intensities of each protein were quantified using ImageJ and normalized to that of the β‐actin/VDAC band. (J) Transmission electron microscopy images at an original magnification of 5000×. Representative electron microscopy representative images demonstrated marked alterations in the mitochondrial morphology of liver mitochondria from the three groups. Images revealed a disruption of the mitochondrial double membrane (thick arrowhead “◄”) in HUM group compared with well‐preserved double membrane (thin arrow “˂”) in CON group. (K and L) Hepatic levels of OXPHOS ETC complex proteins (complex I, II, III, V) were analyzed via Western blotting (K). Band intensities of each protein were quantified using ImageJ and normalized to that of the β‐actin band (L). Data are presented as means ± SEM. **p < 0.01, *p < 0.05. CON, control; HUM, mouse model of hyperuricemia; HUM+ALL allopurinol treatment group.
FIGURE 3
FIGURE 3
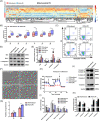
Uric acid (UA) triggers mitochondrial dysfunction and apoptosis in L02 cells. (A) UA‐induced apoptosis in L02 cells. Apoptosis was detected using Annexin V‐FITC and PI staining. (B) Bcl‐2, Bax, and cleaved caspase‐3 protein levels were detected via Western blotting. (C) The levels of ROS in L02 cells treated with UA (750 μmol/L) or allopurinol (100 μmol/L). (D) Transmission electron microscopy images at an original magnification of 3000× (top) and 10,000× (bottom). Representative electron microscopy images demonstrated marked alterations in the mitochondrial morphology of L02 cells incubated with 750 μmol/L UA for 48 h. Higher magnification (10,000×) revealed a disruption of the mitochondrial double membrane (thick arrowhead “◄”) in UA‐treated cells compared with well‐preserved cristae (thin arrowhead “▸”) and a double membrane (thin arrow “˂”) in control cells. (E) Changes in mitochondrial membrane potential (MMP) in L02 cells treated with UA or allopurinol were determined based on JC‐1 fluorescence. (F) ATP content in the three groups. (G) Mitochondrial oxygen consumption rate (OCR) measurements were performed with a Seahorse metabolic analyzer. Oligomycin (1.5 μM), FCCP (1 μM), and rotenone (0.5 μM) in addition to antimycin (0.5 μM) were sequentially added to L02 cells treated with or without UA (750 μmol/L) and allopurinol (100 μmol/L). (H) Quantitative analysis of mitochondrial function parameters (basal respiration, maximal respiration, spare capacity, and ATP production) was shown in the bar charts (n = 5). (I) OXPHOS protein expression (complex I–V) in L02 cells stimulated with high UA with or without allopurinol were analyzed via Western blotting. Data are presented as means ± SEM. **p < 0.01, *p < 0.05, ns indicates no significance.
FIGURE 4
FIGURE 4
The expression of phosphatidylserine decarboxylase (PISD) in L02 cells is inhibited by high uric acid (UA) concentration. (A) Pisd mRNA levels were determined via real‐time PCR in L02 cells of three groups (CON group, HUA group, HUA+ALL group). (B and C) Representative Western blots showing total protein expression of PISD, STAT3, p‐STAT3 (Tyr705), as well as PISD protein levels in mitochondria (B). Band intensities of each protein were quantified using ImageJ and normalized to that of β‐actin or VDAC (C). (D) Representative confocal microscopy image of DAPI (blue), PISD (green), and the mitochondrial marker (red) in control cells as well as cells exposed to UA (750 μmol/L) and allopurinol (100 μmol/L) (×630). (E) Principal component analysis (PCA) score plots of lipids identified via lipidomics. Dots represent each sample of the different groups, including the CON group (red dots, n = 8), HUA group (green dots, n = 8), and HUA+ALL group (blue dots, n = 8). (F and G) Heatmap of differentially abundant phosphatidylserine (PS) (F) and phosphatidylethanolamine (PE) (G) in mitochondria isolated from L02 cells based on lipidomics analysis. The color of each section is proportional to the significance of change in lipid abundance. Positive correlations (yellow/red, upregulated) and negative correlations (blue, downregulated) are shown. (H) The quantification of total PS and total PE in mitochondria isolated from L02 cells. The PS/PE ratio was determined in cells of all three groups. Data are presented as means ± SEM. **p < 0.01, *p < 0.05. CON, control; HUM, mouse model of hyperuricemia; HUM+ALL allopurinol treatment group.
FIGURE 5
FIGURE 5
The overexpression of phosphatidylserine decarboxylase (PISD) ameliorates uric acid (UA)‐induced mitochondrial dysfunction and apoptosis in L02 cells. (A) Pisd mRNA levels were determined via real‐time PCR in L02 cells of four groups (NC group, LV‐PISD group, NC+HUA group, LV‐PISD+HUA group). (B and C) Representative Western blots showing protein expression of PISD, STAT3, and p‐STAT3 (Tyr705) in cells of the four groups. (D and E) Mitochondrial PISD protein levels in NC+HUA and LV‐PISD+HUA cells. (F) Principal component analysis (PCA) score plots based on lipids identified via lipidomics. Dots represent each sample of different groups, including the NC group (red dots, n = 6), LV‐PISD group (green dots, n = 6), NC+HUA group (blue dots, n = 5), and LV‐PISD+HUA group (purple dots, n = 6). (G and H) Heatmap of differentially abundant phosphatidylethanolamine (PE) in mitochondria isolated from L02 cells of four groups based on lipidomics. Positive correlations (yellow/red, upregulated) and negative correlations (blue, downregulated) are shown (G). Total PE in mitochondria of the NC+HUA and LV‐PISD+HUA cells was quantified (H). (I) Apoptosis was detected via Annexin V‐FITC and PI staining in the NC group, LV‐PISD group, NC+HUA group, and LV‐PISD+HUA group. (J) Mitochondrial oxygen consumption rate (OCR) measurements were performed using a Seahorse metabolic analyzer. Oligomycin (1.5 μM), FCCP (1 μM), and rotenone (0.5 μM) combined with antimycin (0.5 μM) were added sequentially to L02 cells in the NC+HUA and LV‐PISD+HUA group. (K) Quantitative analysis of mitochondrial function parameters (basal respiration, maximal respiration, spare capacity, and ATP production) is shown in the bar charts (n = 5). (L and M) OXPHOS protein expression (complex I–V) in L02 cells of the NC+HUA group and LV‐PISD+HUA group were analyzed via Western blotting. (N and O) Bcl‐2, Bax, and cleaved caspase‐3 protein levels of the NC+HUA and LV‐PISD+HUA group were detected via Western blotting. Data are means ± SEM. **p < 0.01, *p < 0.05. NC, negative control; LV, lentivirus; HUA, high UA.
FIGURE 6
FIGURE 6
Lyso‐phosphatidylethanolamine (PE) supplementation of L02 cells treated with high uric acid (UA). (A) Heatmap of differential PEs in mitochondria isolated from L02 cells between HUA+ethanol and HUA+LPE group based on lipidomics (n = 6). Positive correlations (yellow/red, upregulated) and negative correlations (blue, downregulated) are shown. (B) Total PE, PS, PC, PI, PG, and SM were quantified in mitochondria of HUA+ethanol and HUA+LPE group cells. (C) Apoptosis was detected via Annexin V‐FITC and PI staining in the four (CON+ethanol, CON+LPE, HUA+ethanol, and HUA+LPE) groups. (D and E) Bcl‐2, Bax, and cleaved caspase‐3 protein levels of the CON+ethanol, CON+LPE, HUA+ethanol, and HUA+LPE groups were detected via Western blotting. (F and G) Following 48 h of incubation with 100 μM lyso‐PE, the confluence of UA‐treated L02 cells increased based on analysis performed using the Cell discoverer live‑cell imaging and analysis system. Scale bar, 200 μm. (H) Mitochondrial oxygen consumption rate (OCR) measurements were performed using a Seahorse metabolic analyzer. Oligomycin (1.5 μM), FCCP (1 μM), and rotenone (0.5 μM) combined with antimycin (0.5 μM) were added sequentially to L02 cells of the CON+ethanol group, CON+LPE group, HUA+ethanol group, and HUA+LPE group. (I) Quantitative analyses of mitochondrial function parameters (basal respiration, maximal respiration, spare capacity, and ATP production) are shown in the bar charts (n = 8). (J and K) OXPHOS protein expression (complex I–V) in L02 cells of the HUA+ethanol and HUA+LPE group were analyzed by Western blotting. Data are presented as means ± SEM. **p < 0.01, *p < 0.05, ns indicates no significance. LPE, lysophosphatidylethanolamine; HUA, high UA; PS, phosphatidylserine; PC, phosphatidylcholine; PI, phosphatidylinositol; PG, phosphatidylglycerol; SM, sphingomyelin.
FIGURE 7
FIGURE 7
Possible mechanism underlying the regulatory effect of uric acid (UA) on mitochondrial dysfunction and apoptosis. After entering hepatocytes, UA inhibits the conversion of PS to PE mediated by downregulating PISD in mitochondria. The phosphorylation of STAT3 is reduced, and apoptotic signaling (Bcl‐2, Bax, and cleaved caspase‐3) is activated. PISD, phosphatidylserine decarboxylase; PS, phosphatidylserine; PE, phosphatidylethanolamine; STAT3, signal transducer and activator of transcription 3; IMS, mitochondrial intermembrane space; MIM, mitochondrial inner membrane; MOM, mitochondrial outer membrane; Δψ, membrane potential; C I–V, mitochondrial respiratory chain complex I–V.

Similar articles

Cited by

References

    1. Chen‐Xu M, Yokose C, Rai SK, Pillinger MH, Choi HK. Contemporary prevalence of gout and hyperuricemia in the United States and decadal trends: the National Health and Nutrition Examination Survey, 2007–2016. Arthritis Rheumatol. 2019;72(6):991‐999. - PMC - PubMed
    1. Liu N, Xu H, Sun Q, et al. The role of oxidative stress in hyperuricemia and xanthine oxidoreductase (XOR) inhibitors. Oxid Med Cell Long. 2021;2021:1470380. - PMC - PubMed
    1. Battelli MG, Bortolotti M, Polito L, Bolognesi A. The role of xanthine oxidoreductase and uric acid in metabolic syndrome. Biochim Biophys Acta Mol Basis Dis. 2018;1864(8):2557‐2565. - PubMed
    1. Li C, Hsieh MC, Chang SJ. Metabolic syndrome, diabetes, and hyperuricemia. Curr Opin Rheumatol. 2013;25(2):210‐216. - PubMed
    1. Isaka Y, Takabatake Y, Takahashi A, Saitoh T, Yoshimori T. Hyperuricemia‐induced inflammasome and kidney diseases. Nephrol Dial Transplant. 2016;31(6):890‐896. - PubMed