Efficacy, safety and tolerability of very low-calorie ketogenic diet in obese women with fibromyalgia: a pilot interventional study
- PMID: 37502721
- PMCID: PMC10369071
- DOI: 10.3389/fnut.2023.1219321
Efficacy, safety and tolerability of very low-calorie ketogenic diet in obese women with fibromyalgia: a pilot interventional study
Abstract
Introduction: Obesity can worsen fibromyalgia (FM) and very low-calorie ketogenic diet (VLCKD) is a potential therapeutic option for diseases that share clinical and pathophysiological features with FM. In this pilot interventional study, we investigated the effects of VLCKD in obese women with FM.
Methods: Female patients with FM and a body mass index (BMI) ≥ 30 kg/m2 were eligible for VLCKD. The ketogenic phase (T0 to T8) was followed by progressive reintroduction of carbohydrates (T8 to T20). Changes in BMI, Fibromyalgia Impact Questionnaire (FIQ), Hospital Anxiety and Depression Scale (HADS), EuroQol 5D (EQ-5D) and 36-item Short Form Health Survey (SF-36) were evaluated. A change of 14% in FIQ was considered clinically relevant. The longitudinal association between BMI and patient-reported outcomes (PROs) was assessed using generalized estimating equations.
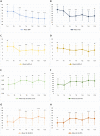
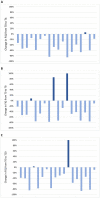
Results: Twenty women were enrolled. Two discontinued the intervention. The mean age of the 18 patients who reached T20 was 51.3 years and mean BMI was 37.2 kg/m2. All patients lost weight during the first period of VLCKD and this achievement was maintained at T20. Mean BMI decreased from 37.2 kg/m2 at T0 to 34.8 kg/m2 at T4, 33.5 kg/m2 at T8 and 32.1 kg/m2 at T20 (p < 0.001). A significant reduction of mean FIQ from 61.7 at T0 to 37.0 at T4 and to 38.7 at T8 (p < 0.001) was observed and it was maintained at T20 with a mean FIQ of 39.1 (p = 0.002). Similar results were obtained for HADS, EQ-5D and SF-36. Analysing each participant, the reduction of FIQ was clinically meaningful in 16 patients (89%) at T4, in 13 (72%) at T8 and in 14 (78%) at T20. No significant association was observed between change in BMI and improvement of the PROs over time. Adverse effects were mild and transient. No major safety concerns emerged.
Conclusion: These are the first data on the efficacy of VLCKD in FM. All patients achieved improvement in different domains of the disease, which was maintained also after carbohydrate reintroduction. Our results suggest that ketosis might exert beneficial effects in FM beyond the rapid weight loss.
Clinical trial registration: This trial is registered on ClinicalTrials.gov, number NCT05848544.
Keywords: fibromyalgia; ketogenic diet; ketone bodies; obesity; pain.
Copyright © 2023 Ciaffi, Lisi, Mari, Mancarella, Brusi, Pignatti, Ricci, Vitali, Stefanelli, Assirelli, Neri, Naldi, Faldini and Ursini.
Conflict of interest statement
The authors declare that the research was conducted in the absence of any commercial or financial relationships that could be construed as a potential conflict of interest.
Figures


Similar articles
-
Efficacy, Safety, and Tolerability of a Very Low-Calorie Ketogenic Diet in Women with Obesity and Symptomatic Knee Osteoarthritis: A Pilot Interventional Study.Nutrients. 2024 Sep 24;16(19):3236. doi: 10.3390/nu16193236. Nutrients. 2024. PMID: 39408203 Free PMC article.
-
Very-low-calorie ketogenic diet vs hypocaloric balanced diet in the prevention of high-frequency episodic migraine: the EMIKETO randomized, controlled trial.J Transl Med. 2023 Oct 4;21(1):692. doi: 10.1186/s12967-023-04561-1. J Transl Med. 2023. PMID: 37794395 Free PMC article. Clinical Trial.
-
Supplementation with medium-chain fatty acids increases body weight loss during very low-calorie ketogenic diet: a retrospective analysis in a real-life setting.J Transl Med. 2023 Jan 16;21(1):29. doi: 10.1186/s12967-023-03880-7. J Transl Med. 2023. PMID: 36647097 Free PMC article.
-
Efficacy and safety of very low calorie ketogenic diet (VLCKD) in patients with overweight and obesity: A systematic review and meta-analysis.Rev Endocr Metab Disord. 2020 Mar;21(1):5-16. doi: 10.1007/s11154-019-09514-y. Rev Endocr Metab Disord. 2020. PMID: 31705259
-
Clinical and nutritional management of very-low-calorie ketogenic diet (VLCKD) in patients with psoriasis and obesity: a practical guide for the nutritionist.Crit Rev Food Sci Nutr. 2023;63(31):10775-10791. doi: 10.1080/10408398.2022.2083070. Epub 2022 Jun 2. Crit Rev Food Sci Nutr. 2023. PMID: 35653127 Review.
Cited by
-
Advancing Obesity Management: the Very Low-Energy Ketogenic therapy (VLEKT) as an Evolution of the "Traditional" Ketogenic Diet.Curr Obes Rep. 2025 Apr 3;14(1):30. doi: 10.1007/s13679-025-00622-2. Curr Obes Rep. 2025. PMID: 40175850 Free PMC article. Review.
-
Common Non-Rheumatic Medical Conditions Mimicking Fibromyalgia: A Simple Framework for Differential Diagnosis.Diagnostics (Basel). 2024 Aug 13;14(16):1758. doi: 10.3390/diagnostics14161758. Diagnostics (Basel). 2024. PMID: 39202246 Free PMC article. Review.
-
Efficacy, Safety, and Tolerability of a Very Low-Calorie Ketogenic Diet in Women with Obesity and Symptomatic Knee Osteoarthritis: A Pilot Interventional Study.Nutrients. 2024 Sep 24;16(19):3236. doi: 10.3390/nu16193236. Nutrients. 2024. PMID: 39408203 Free PMC article.
References
Associated data
LinkOut - more resources
Full Text Sources
Medical
Miscellaneous

