[Preprint]. 2023 Jul 19:2023.07.18.549591.
doi: 10.1101/2023.07.18.549591.

Estimating error rates for single molecule protein sequencing experiments

Affiliations

Estimating error rates for single molecule protein sequencing experiments

Matthew Beauregard Smith et al. bioRxiv. .

Update in

Abstract

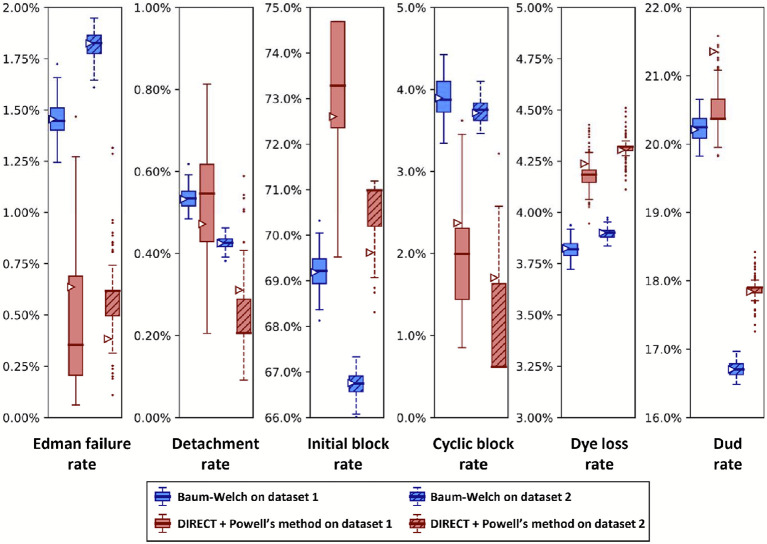
The practical application of new single molecule protein sequencing (SMPS) technologies requires accurate estimates of their associated sequencing error rates. Here, we describe the development and application of two distinct parameter estimation methods for analyzing SMPS reads produced by fluorosequencing. A Hidden Markov Model (HMM) based approach, extends whatprot, where we previously used HMMs for SMPS peptide-read matching. This extension offers a principled approach for estimating key parameters for fluorosequencing experiments, including missed amino acid cleavages, dye loss, and peptide detachment. Specifically, we adapted the Baum-Welch algorithm, a standard technique to estimate transition probabilities for an HMM using expectation maximization, but modified here to estimate a small number of parameter values directly rather than estimating every transition probability independently, which should help prevent overfitting. We demonstrate a high degree of accuracy on simulated data, but on experimental datasets, we observed that the model needed to be augmented with an additional error type, N-terminal blocking. This, in combination with data pre-processing, results in reasonable parameterizations of experimental datasets that agree with controlled experimental perturbations. A second independent implementation using a hybrid of DIRECT and Powell's method to reduce the root mean squared error (RMSE) between simulations and the real dataset was also developed. We compare these methods on both simulated and real data, finding that our Baum-Welch based approach outperforms DIRECT and Powell's method by most, but not all, criteria. Although some discrepancies between the results exist, we also find that both approaches provide similar error rate estimates from experimental single molecule fluorosequencing datasets.


Figures

Figure 1.
Figure 1.. Overview of single molecule protein fluorosequencing with various potential sources of errors highlighted in red.
A sample of peptides is acquired, which due to biological factors or collection practices may contain contaminants. These peptides are then labeled, but this process is not expected to be 100% efficient, and a missing fluorophore rate must therefore be considered. Labeled peptides are clicked to the slide surface prior to sequencing; N-terminal modifications and non-specific attachment might potentially occur during this process. The peptides are then imaged and a single amino acid removed from each of their N-termini by Edman degradation, and these two processes iterated to fully sequence the peptides. Imaging photobleaches dyes, while incubation in trifluoroacetic acid (TFA) and phenyl isothiocyanate (PITC)/pyridine can result in chemical destruction of fluorophores. As photobleaching happens at a negligible rate in the imaging conditions used [13] and the dye loss rate is dominated by the contribution of chemical destruction, we combine these effects into a single dye loss rate. Edman degradation is not 100% efficient, and we model failures with the Edman cycle failure rate. We model the potential for blocking peptide N-termini during the course of sequencing, which we call cyclic N-terminal blocking, and also model the detachment of intact peptides (e.g. by non-specific cleavage or washing off of non-specifically attached peptides). Finally, it can be difficult to entirely denoise the precise fluorophore counts due to overlapping intensity distributions, so we additionally recognize an error contribution from mis-assigned fluorophore counts.
Figure 2.
Figure 2.. Diagram of factored hidden Markov model for fluorosequencing of an example peptide with three labeled amino acids.
This figure is adapted from Figure 6 in [16]. Arrows of a particular color indicate the non-zero entries in a factor of the transition matrix for a particular form of error (see key).
Figure 3.
Figure 3.. Illustration of HMM factorization.
(A) Diagram of a non-factored HMM model. Arrows represent a conditional probability relationship. The transitions between states determine how a state at one time step is probabilistically related to the state at the preceding time step. Emissions represent how the observable data is probabilistically determined by the associated state. (B) Diagram including a factored transition. Breaking a transition into a factored product of sub-transitions introduces “sub-steps”; though not accurate models of any physical states of an actual peptide, these sub-steps prove useful for algorithmic purposes.
Figure 4.
Figure 4.. Data is lost due to missing fluorophores.
At least one functioning fluorophore must be present when sequencing starts to observe a peptide. This makes naive calculations of the missing fluorophore rate biased, and a correction is needed.
Figure 5.
Figure 5.. Factored transition matrix diagram including N-terminal blocking.
In this diagram we adapted the illustration from Figure 2 to include N-terminal blocking. In addition to the unblocked states (top-left) described in [16], we found we must also consider blocked states (bottom-right) in which Edman degradation is not possible. An additional transition matrix factor representing N-terminal blocking is needed to describe this behavior (yellow arrows).
Figure 6.
Figure 6.. Determination of fluorescence intensity distribution parameters and filtering of likely contaminants.
(A) unaltered histogram of intensity values for a NH2-G{azK}*AG{azK}*∣ peptide sequencing experiment with superimposed normal distributions (red, fit to peak max (μ) and half-width; yellow, expectation from 2*μ). We typically observe some deviation from a normal distribution that can cause challenges with fitting the distribution, often solved in practice either by fitting the max and peak half-width (as in the red curve) or by trial-and-error using expert judgment. (B) clipped data for the same experiment, removing ranges of intensity values likely to be caused by contaminants or signal bleed over from adjacent peaks. Typically, reads are removed from subsequent analyses if any of their intensity values fall in that range.
Figure 7.
Figure 7.. Illustration of DIRECT and Powell’s method.
As an alternative to Baum-Welch, we also explored a more general purpose approach. (A) We first apply DIRECT to rapidly identify a region of the parameter space that is likely to contain the global optimum (red dots). DIRECT proceeds by iteratively comparing three points and using these results to further subdivide the search space, as shown. (B) We then apply Powell’s method, which iteratively minimizes the objective function by changing one variable at a time.
Figure 8.
Figure 8.. The Baum-Welch and DIRECT + Powell’s methods agree within 0.5% error on simulated data.
Synthetic fluorosequencing reads were generated for peptide NH2-G{azK}*AG{azK}*∣, and the simulated dataset was bootstrapped by subsampling with replacement the same number of reads 100 times. Parameters were estimated for each of these bootstrapped subsamples with both methods as described in the text. The box-and-whisker plots represent the distributions of these results, plotting 1st and 3rd quartile +/− max/min observation within 1.5 interquartile range (IQR). Results outside 1.5 times the IQR are considered outliers and are plotted as points. The right facing triangles mark the parameter estimate found if using the non-bootstrapped original data. The dashed black lines indicate the target value that was used in simulation.
Figure 9.
Figure 9.. Simulated datasets with more reads exhibit tighter distributions of parameter estimates.
Synthetic fluorosequencing reads were created for peptide NH2-G{azK}*AG{azK}*∣, simulated the numbers of reads indicated in the graphical legend. These datasets were bootstrapped by subsampling with replacement the same number of datapoints as in the associated simulated dataset, with 100 bootstrapping rounds, and estimating parameters for each of these bootstrapped subsamples with both methods as described in the text. Box-and-whisker plots are defined as in Figure 8.
Figure 10.
Figure 10.. A comparison of Baum-Welch and DIRECT + Powell’s method on experimental sequencing data for a two-fluorophore peptide shows general agreement between the methods.
Fluorosequencing datasets for peptide NH2-G{azK}*AG{azK}*∣ were collected one day apart by the same researcher on the 21st (dataset 1 with 40,181 reads) and the 22nd (dataset 2 with 71,823 reads) of November 2022. The original datasets were bootstrapped by subsampling with replacement the same number of datapoints as in the original dataset 100 times, and fitting on each of these bootstrapped subsamples with both methods as described in the text. Box-and-whisker plots are defined as in Figure 8.
Figure 11.
Figure 11.. A higher Edman failure rate is observed for a proline-containing peptide, with general agreement between the estimation methods.
Here, we analyze two experimental fluorosequencing datasets for peptide fmoc-APK*∣ collected by the same researcher on the 11th (dataset 1 with 27,783 reads) and 28th (dataset 2 with 34,380 reads) of November 2022. The original datasets were bootstrapped by subsampling with replacement the same number of datapoints as in the original dataset 100 times, and fitting on each of these bootstrapped subsamples with both methods as described in the text. Box-and-whisker plots are defined as in Figure 8.
Figure 12.
Figure 12.. Analysis of experimental fluorosequencing data from a peptide similar to that in Figure 11 but containing no proline residues exhibits lower Edman failure rates and shows agreement between the methods.
The peptide fmoc-GAK*∣ was sequenced on December 1st, 2022, and the original dataset of 67,936 reads was bootstrapped by subsampling with replacement the same number of datapoints as in the original dataset 100 times, and fitting on each of these bootstrapped subsamples with both methods as described in the text. Box-and-whisker plots are defined as in Figure 8.
Figure 13.
Figure 13.. Both parameter estimators correctly recognize high initial block rates (>91%) in an intentionally N-terminally blocked peptide.
Here, we examine two independent fluorosequencing datasets for ac-A{azK}*∣, an N-terminally acetylated peptide, i.e. one for which the N-terminus is covalently blocked and not sequenceable by Edman chemistry. The datasets were collected on the 15th (dataset 1 with 43,606 reads) and 17th (dataset 2 with 42,417 reads) of November 2022 by the same researcher. The original datasets were bootstrapped by subsampling with replacement the same number of reads as in the original dataset 100 times, and fitting on each of these bootstrapped subsamples with both methods as described in the text. Box-and-whisker plots are defined as in Figure 8.
Figure 14.
Figure 14.. Longer TFA incubation times reduce the Edman failure rate but increase the dye loss rate.
We tested minimum times required for TFA incubation by sequencing six different peptides with four different lengths of time of TFA exposure. Every dataset used in these plots has at least 34,000 reads, and all but three have more than 50,000 (see Zenodo repository for precise counts). (A) The Edman failure rate decreases with longer TFA incubation time, which matches theoretical expectations. (B) The initial block rate does not follow a clear pattern. (C) The dye loss rate goes up with longer TFA incubation time, which matches theoretical expectations.

References

    1. Floyd BM, Marcotte EM. Protein Sequencing, One Molecule at a Time. Annu Rev Biophys. 2022;51: 181–200. doi: 10.1146/annurev-biophys-102121-103615 - DOI - PMC - PubMed
    1. Alfaro JA, Bohländer P, Dai M, Filius M, Howard CJ, van Kooten XF, et al. The emerging landscape of single-molecule protein sequencing technologies. Nat Methods. 2021;18: 604–617. doi: 10.1038/s41592-021-01143-1 - DOI - PMC - PubMed
    1. Restrepo-Pérez L, Joo C, Dekker C. Paving the way to single-molecule protein sequencing. Nat Nanotechnol. 2018;13: 786–796. doi: 10.1038/s41565-018-0236-6 - DOI - PubMed
    1. Tullman J, Marino JP, Kelman Z. Leveraging nature’s biomolecular designs in next-generation protein sequencing reagent development. Appl Microbiol Biotechnol. 2020;104: 7261–7271. doi: 10.1007/s00253-020-10745-2 - DOI - PubMed
    1. Zhao Y, Iarossi M, De Fazio AF, Huang J-A, De Angelis F. Label-Free Optical Analysis of Biomolecules in Solid-State Nanopores: Toward Single-Molecule Protein Sequencing. ACS Photonics. 2022;9: 730–742. doi: 10.1021/acsphotonics.1c01825 - DOI - PMC - PubMed

Publication types