[Preprint]. 2024 May 25:2023.07.14.549009.
doi: 10.1101/2023.07.14.549009.

GAGA zinc finger transcription factor searches chromatin by 1D-3D facilitated diffusion

Affiliations

GAGA zinc finger transcription factor searches chromatin by 1D-3D facilitated diffusion

Xinyu A Feng et al. bioRxiv. .

Update in

Abstract

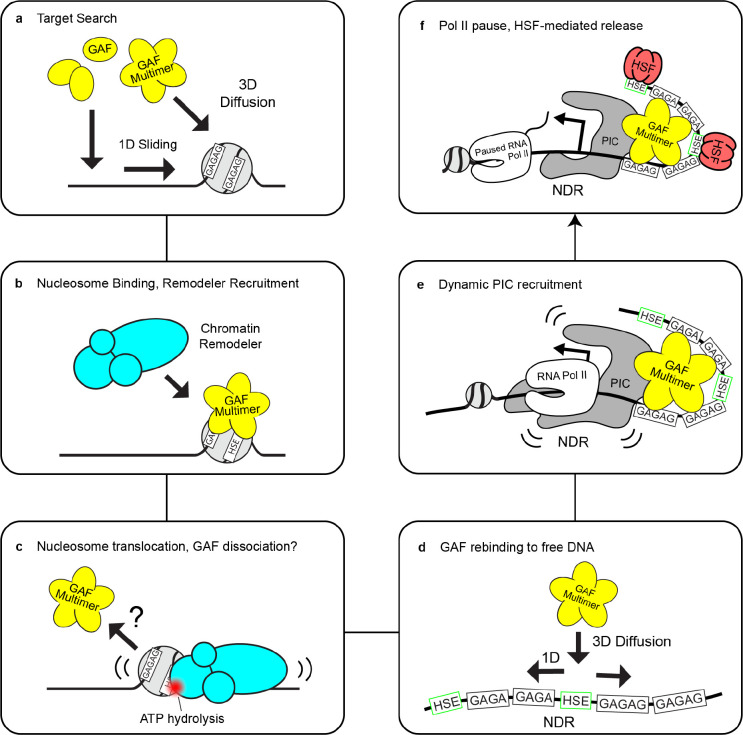
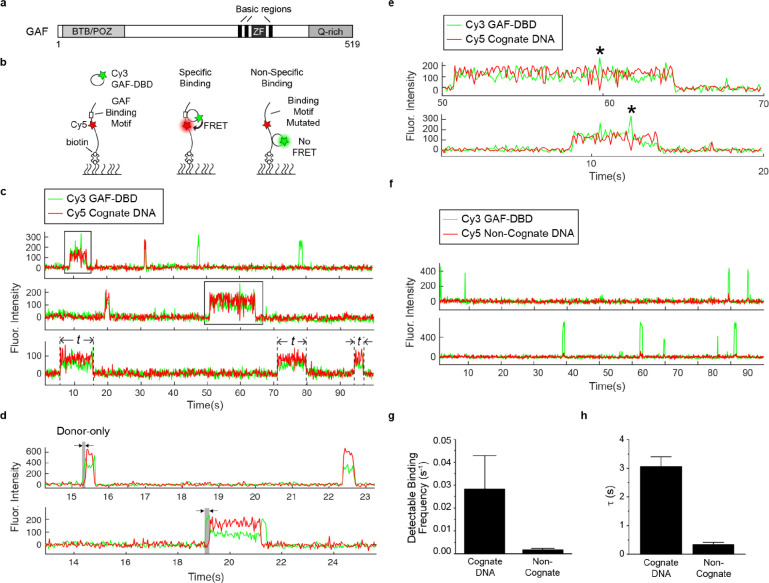
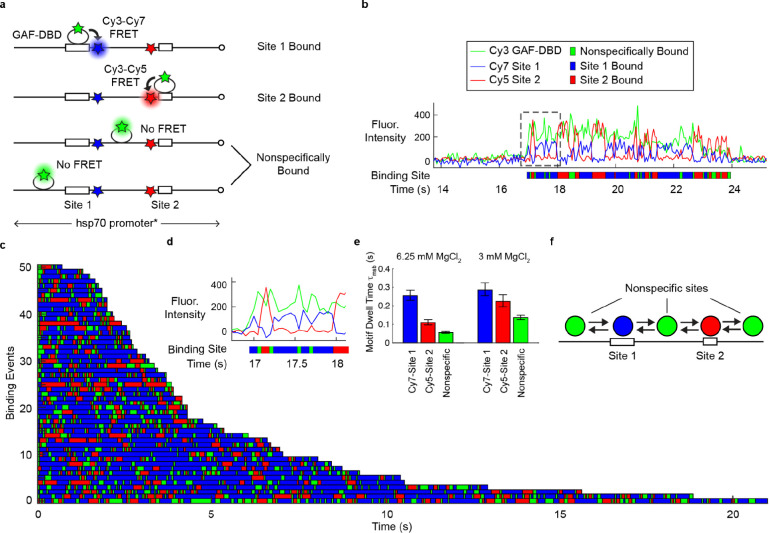
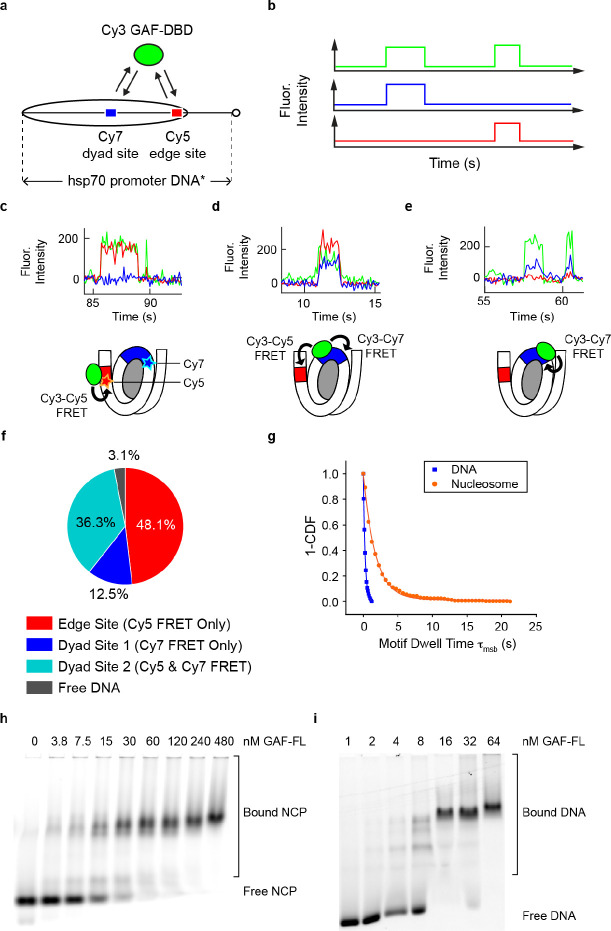
To elucidate how eukaryotic sequence-specific transcription factors (TFs) search for gene targets on chromatin, we used multi-color smFRET and single-particle imaging to track the diffusion of purified GAGA-Associated Factor (GAF) on DNA and nucleosomes. Monomeric GAF DNA-binding domain (DBD) bearing one zinc finger finds its cognate site by 1D or 3D diffusion on bare DNA and rapidly slides back-and-forth between naturally clustered motifs for seconds before escape. Multimeric, full-length GAF also finds clustered motifs on DNA by 1D-3D diffusion, but remains locked on target for longer periods. Nucleosome architecture effectively blocks GAF-DBD 1D-sliding into the histone core but favors retention of GAF-DBD when targeting solvent-exposed sites by 3D-diffusion. Despite the occlusive power of nucleosomes, 1D-3D facilitated diffusion enables GAF to effectively search for clustered cognate motifs in chromatin, providing a mechanism for navigation to nucleosome and nucleosome-free sites by a member of the largest TF family.


Figures

Extended Data Figure 1.
Model for GAF-DBD and GAF-FL target search. a, GAF-DBD uses two search modes to locate its target on chromatin. In the 1D sliding mode, GAF-DBD lands on an off-target location on free DNA, then slides back and forth to locate the cognate motif (“GAGAG”). It can escape the cognate site to search for the next site nearby. This 1D search mode allows GAF-DBD to invade into the nucleosome edge but no further. Alternatively, GAF-DBD can also directly associate with a solvent-exposed cognate motif in the nucleosome core from 3D space. This 3D search mode allows GAF to effectively target nucleosomal motifs that are inaccessible by 1D sliding. b. GAF-FL uses both 3D and 1D diffusion to locate cognate motif clusters on free DNA. If the motif cluster is inside a nucleosome, GAF-FL can use 3D diffusion for target location.
Extended Data Figure 2.
Purification of GAF-DBD protein. a, Subtractive Ni-NTA purification after “one-pot” reaction which cleaved off 6xHis-SUMO and labeled the N-terminus of GAF-DBD with Cy3. The calculated molecular weights are 34.4 kDa for 6xHis-SUMO-Cys-GAF-DBD, 21.0 kDa for Cys-GAF-DBD and 13.4 kDa for 6xHis-SUMO. b, Schematics of GAF-FL short isoform, GAF-DBD and NURF-binding regions (PMID 11583616) to scale. c, Native hsp70 promoter DNA sequence. GAF cognate sites are highlighted in red. TATA box in bold.
Extended Data Figure 3.
Donor-only dwell time is inversely correlated with ionic strength of buffer solution. a, Representative trajectories showing Cy5-cognate DNA bound by Cy3-GAF-DBD in 0, 25, 50 or 100 mM NaCl. Grey-highlighted durations indicate donor-only dwell times. b, Representative trajectories showing Cy5-cognate DNA bound by Cy3-GAF-DBD in 0, 1, 5, 7.5, or 10 mM MgCl2. c, Donor-only dwell time (t from fitting 1-CDF to a single-exponential decay; see Methods) as a function of NaCl concentration, and d, MgCl2 concentration. Error bars are standard error from fitting. DNA is the same as cognate DNA in Fig. 1.
Extended Data Figure 4.
GAF sliding kinetics on Cy5 & Cy7 dual-labeled DNA as a function of salt concentration, cognate site and motif orientation. a, Representative single-molecule trajectories of Cy5 & Cy7 DNA bound by Cy3-GAF-DBD in low MgCl2 (3 mM). b, Rastergram of 31 Cy5 & Cy7 DNA molecules bound by Cy3-GAF-DBD at 3 mM MgCl2. c, Schematic of Site 2 Only construct where Site 1 was replaced with non-cognate sequence. d, Representative single-molecule trajectories of Site 2 Only DNA bound by GAF-DBD. e, Rastergram of 40 Site 2 Only DNA molecules bound by GAF-DBD. f, Schematic of the flipped motif DNA construct where Site 1 is replaced with its complementary sequence Site 1’. g, Representative single-molecule trajectories of flipped motif DNA bound by GAF-DBD. h, Rastergram of 57 flipped motif DNA molecules bound by GAF-DBD. DNA same as Fig. 4. i, Categories of GAF-DBD arrival landing site and departure launching site.
Extended Data Figure 5.
Nucleosomal motif accessibility depends on helical phasing. a, Classification of Cy3-GAF-DBD binding events on ‘601’ nucleosomes (40-N-40) with a cognate site placed at SHL6.5, SHL4.5 and SHL2.5. Classification is based on Cy3-Cy7 FRET dynamics, see details in methods. b, Classification of Cy3-GAF-DBD binding events on same ‘601’ (40-N-40) nucleosomes with cognate site placed at SHL7, SHL5 and SHL3 (same dataset as Figure 3, re-analyzed for direct comparison with a).
Extended Data Figure 6.
GAF-DBD preferentially re-visits the same cognate site on individual hsp70 nucleosomes. a, Representative single-molecule trajectories showing repetitive visits to the same binding site on a single nucleosome. Upper trace shows repetitive visits to binding site A; middle trace, site B; lower trace, site C. Black asterisks mark transient Cy3 only fluorescence within a binding event, potentially caused by ultra-short-range 1D diffusion on the nucleosome. Green asterisks indicate binding events to non-cognate sites on the nucleosome. b, Pie charts showing for all binding events at site A (left pie chart, N = 65), B (middle, N = 45) or C (right, N = 25), the fraction of events that were followed by a second binding to site A, B or C.
Extended Data Figure 7.
Purification of SNAP-tagged GAF-FL and GAF-ΔPOZ. a, GAF-FL purification workflow. b, SDS-PAGE gel of GAF-FL elution after 6XHis pulldown, stained with Coomassie Blue. c, SDS-PAGE gel of GAF-FL elution after MBP pulldown, stained with Coomassie Blue. d, SDS-PAGE gel of AF546-GAF-ΔPOZ, scanned for AlexaFluor 546 fluorescence, then stained with Coomassie Blue.
Extended Data Figure 8.
Optical tweezers experiment; design and confirmation of DNA assembly. a, Agarose gel electrophoresis of concatenated plasmid DNA. b, Force versus distance plot reveals the length of double-stranded DNA tether. c, Diagram of flow cell constituents during imaging. Streptavidin coated beads, DNA, and Imaging Buffer were injected to the flow cell under laminar flow. Beads were first optically captured, moved to the DNA channel; once DNA was properly tethered to the trapped beads, the whole assemblage was moved to the protein channel containing AF-488 GAF-FL in Imaging Buffer. Imaging was performed in this channel to maximally visualize binding events. d, Representative kymographs where GAF-FL undergoes 1D search on vector+hsp70 DNA. e, Representative kymographs where GAF-FL binds to its target on vector+hsp70 DNA abruptly from 3D without 1D search. f, Representative kymograph where GAF-FL undergoes 1D diffusion from one target to another on vector+hsp70 DNA.
Extended Data Figure 9.
Extended Data Figure 9.. Behavior of full-length GAF depends on multimerization by POZ domain.
a, Representative kymographs show AF546-GAF-ΔPOZ binding to DNA over time on + hsp70 DNA. b, Representative fluorescence intensity versus time plot for a single trace showing GAF-ΔPOZ photobleaching (indicated by an arrow). c, Representative trace showing GAF-ΔPOZ dissociation (at ~ 5.7 s). Note the abrupt loss of fluorescence signal in this case, which is distinguishable from photobleaching, shown in b, where fluorescence decreases to a near-zero but detectable level. d, Representative trace showing GAF-FL photobleaching. Arrows indicate stepwise photobleaching. e, Fraction of GAF-ΔPOZ (N=100) and GAF-FL (N=200) molecules with 1 or multiple photobleaching steps.
Extended Data Figure 10.
Hypothetical stepwise model for GAF-remodeler collaboration to mobilize targeted nucleosome for PIC assembly.
Figure 1.
Figure 1.
DNA sequence specificity of GAF-DBD is kinetically defined. a, Domain map of GAF. b, Schematics of two-color smFRET experiment to measure cognate-specific binding of GAF-DBD. c, Single-molecule trajectories showing Cy3-GAF-DBD binding to Cy5-DNA containing a GAF cognate site. Boxed binding events are zoomed in in e. Examples of dwell time measurements (t) are shown on the third trajectory. d, Representative single-molecule trajectories of Cy5-cognate DNA bound by Cy3-GAF-DBD showing an initial donor-only period before acceptor signal increases. The donor-only period is highlighted in grey. e, Zoomed-in view of binding events boxed in c. “*” indicates transient Cy3-only fluorescence spike during binding. f, Single-molecule trajectories showing Cy3-GAF-DBD nonspecifically binding to Cy5-DNA where the cognate site was substituted with a non-cognate sequence. g, Binding frequency of GAF-DBD to cognate or non-cognate DNA. h, Dwell time of GAF-DBD on cognate or non-cognate DNA. Error bars show standard deviation of three technical replicates.
Figure 2.
Figure 2.
GAF-DBD explores free DNA by 1-dimensional diffusion. a, 3-color smFRET experiment distinguishes whether GAF-DBD is bound to Cy7-labeled Site 1, Cy5-labeled Site 2, or a nonspecific site on Drosophila hsp70 promoter DNA. b, A single-molecule trajectory shows GAF-DBD sliding back-and-forth on the DNA between two cognate motifs. Binding site assignment is shown below as a colored ribbon. c, 55 binding events shown as a rastergram d, Zoomed-in view of the boxed region in b. e, GAF-DBD dwell times on Site 1, Site 2, or nonspecific site on the DNA at regular (6.25 mM) or low (3 mM) MgCl2. f, Schematic of GAF-DBD sliding on DNA. Circles represent GAF-DBD. Green circles indicate GAF-DBD binding to a nonspecific site; blue circle, GAF-DBD binding to Site 1; red circle, GAF-DBD binding to Site 2.
Figure 3.
Figure 3.
Nucleosome blocks GAF-DBD 1D sliding beyond SHL7. a, Schematics of nucleosome constructs where the nucleosomal Cy7-labeled cognate site (blue) is placed at SHL7, SHL5, or SHL3 locations and the other Cy5-labeled cognate site (red) is on linker DNA. The nucleosome is positioned by the Widom 601 sequence flanked by 40 bp linker DNA on both sides (40-N-40). b-d, Representative single-molecule trajectories of GAF-DBD binding to linker or nucleosomal sites at SHL7 (b), SHL5 (c) and SHL3. e-g, Binding site rastergrams for GAF-DBD on nucleosome constructs where the Cy7-labeled motif is located at SHL7 (e), SHL5 (f) or SHL3 (g). h, GAF-DBD binding categories for each construct. N=485 for SHL7, N=260 for SHL5, N=272 for SHL3. i, Categories of binding events on SHL7 construct. j, GAF-DBD motif dwell times on SHL7, linker site and nonspecific sites on the SHL7 construct.
Figure 4.
Figure 4.
3D diffusion dominates for inner nucleosomal targets. a, Drosophila hsp70 promoter nucleosome construct (0-N-40) for investigating GAF-DBD search when two binding sites are within nucleosome core. b, Idealized single-molecule trajectories for GAF-DBD locating two nearby cognate sites. c-e, Representative single-molecule trajectories on this nucleosome construct. 0.4 nM Cy3-GAF-DBD was used for these experiments. f, Binding event categories on the nucleosome. g, 1-CDF of motif dwell times for nucleosome (orange) compared with free DNA (blue). Free DNA data are from Cy7-Site 1 dwell time (Fig. 2e, 6.25 mM MgCl2). h, EMSA showing GAF-FL binding to Cy5-NCP formed on hsp70 promoter DNA fragment. i, EMSA showing GAF-FL binding to Cy5-DNA. The same DNA was used to reconstitute Cy5-NCP in h.
Figure 5.
Figure 5.. Full-length GAF multimer undergoes 1D diffusion during target search.
a, Schematic of construct design. Plasmids with or without the hsp70 promoter sequence were digested with HindIII and concatenated using T4 DNA ligase. Exposed ends were then biotinylated with adaptors, resulting in dual-end biotinylated DNA carrying repeating hsp70 promoters. b, Set-up of dual optical tweezers for confocal microscopy of stretched DNA tethered between two streptavidin-coated polystyrene beads. c-d, Representative kymographs show AF488-GAF-FL fluorescence signal (cyan) on DNA over time in the absence (c, vector only) or presence of hsp70 promoter (d, vector+hsp70). White arrowhead shows GAF-FL binding directly to target from 3D; black arrowheads show GAF-FL undergoing 1D search before finding target; white asterisk shows direct 3D dissociation. e, Compiled plots of position versus time for GAF-FL trajectories on vector only DNA. 100 traces were collected for each condition and arranged to start from zero time. f, Compiled plot for GAF-FL positions over time on vector+hsp70 DNA. g, Average mean squared displacement (MSD) over time lag of all collected traces for vector only (purple) and vector+hsp70 DNA (blue). Shaded area reports standard error of the mean (SEM). N=100. h, Pie charts categorizing GAF-FL traces by DNA binding at onset of movie (left), and targeting directly (3D binding) or indirectly (1D sliding) (right). i, A representative kymograph of GAF-ΔPOZ on vector+hsp70 DNA. j, 1-CDF comparing dwell times of GAF-ΔPOZ on vector+hsp70 DNA (red, τ = 1.67 s), GAF-FL on vector+hsp70 (blue, τ = 43.4 s) and GAF-FL on vector-only (purple, τ = 21.0 s). k, Single-trace diffusion coefficients for GAF-FL on vector+hsp70 and vector-only DNA and GAF-ΔPOZ on vector+hsp70 DNA. Error bars are SEM. Statistical differences were determined by unpaired t-test (n=100, **** = p < 0.0001).

References

    1. Flury V. & Groth A. Safeguarding the epigenome through the cell cycle: a multitasking game. Curr. Opin. Genet. Dev. 85, 102161 (2024). - PubMed
    1. Li B., Carey M. & Workman J. L. The role of chromatin during transcription. Cell 128, 707–719 (2007). - PubMed
    1. Kadonaga J. T. Eukaryotic transcription: an interlaced network of transcription factors and chromatin-modifying machines. Cell 92, 307–313 (1998). - PubMed
    1. Isbel L., Grand R. S. & Schübeler D. Generating specificity in genome regulation through transcription factor sensitivity to chromatin. Nat. Rev. Genet. 23, 728–740 (2022). - PubMed
    1. Lukas J., Lukas C. & Bartek J. More than just a focus: The chromatin response to DNA damage and its role in genome integrity maintenance. Nat. Cell Biol. 13, 1161–1169 (2011). - PubMed

Publication types