This is a preprint.
Increasing adult-born neurons protects mice from epilepsy
- PMID: 37502909
- PMCID: PMC10369878
- DOI: 10.1101/2023.07.08.548217
Increasing adult-born neurons protects mice from epilepsy
Update in
-
Increasing adult-born neurons protects mice from epilepsy.Elife. 2024 Oct 24;12:RP90893. doi: 10.7554/eLife.90893. Elife. 2024. PMID: 39446467 Free PMC article.
Abstract
Neurogenesis occurs in the adult brain in the hippocampal dentate gyrus, an area that contains neurons which are vulnerable to insults and injury, such as severe seizures. Previous studies showed that increasing adult neurogenesis reduced neuronal damage after these seizures. Because the damage typically is followed by chronic life-long seizures (epilepsy), we asked if increasing adult-born neurons would prevent epilepsy. Adult-born neurons were selectively increased by deleting the pro-apoptotic gene Bax from Nestin-expressing progenitors. Tamoxifen was administered at 6 weeks of age to conditionally delete Bax in Nestin-CreERT2 Bax fl/fl mice. Six weeks after tamoxifen administration, severe seizures (status epilepticus; SE) were induced by injection of the convulsant pilocarpine. After mice developed epilepsy, seizure frequency was quantified for 3 weeks. Mice with increased adult-born neurons exhibited fewer chronic seizures. Postictal depression was reduced also. These results were primarily in female mice, possibly because they were the more affected by Bax deletion than males, consistent with sex differences in Bax. The female mice with enhanced adult-born neurons also showed less neuronal loss of hilar mossy cells and hilar somatostatin-expressing neurons than wild type females or males, which is notable because these two hilar cell types are implicated in epileptogenesis. The results suggest that selective Bax deletion to increase adult-born neurons can reduce experimental epilepsy, and the effect shows a striking sex difference. The results are surprising in light of past studies showing that suppressing adult-born neurons can also reduce chronic seizures.
Keywords: Bax; dentate gyrus; ectopic granule cell; mossy cell; pilocarpine; sex differences; somatostatin; temporal lobe epilepsy.
Figures

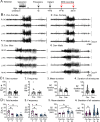
Tamoxifen was injected 1/day for 5 days in 6 week-old Nestin-CreERT2 Baxfl/fl mice. Six weeks after the last tamoxifen injection, mice were injected with pilocarpine (Pilo) at a dose that induces status epilepticus (SE).
On the day of pilocarpine injection, one group of mice without EEG electrodes were monitored for behavioral seizures for 2 hr after pilocarpine injection. Another group of mice were implanted with EEG electrodes 3 weeks prior to pilocarpine injection. In these mice, video-electroencephalogram (video-EEG) was used to monitor SE for 10 hr after pilocarpine injection.
The latency to the onset of first seizure was similar in both genotypes (t-test, p=0.761). The seizure was a behavioral seizure ≥stage 3 of the Racine scale (unilateral forelimb jerking). For this figure and all others, detailed statistics are in the Results.
The number of seizures in the first 2 hr after pilocarpine injection was similar in both genotypes (t-test, p=0.377).
After separating males and females, females showed a shorter latency to the onset of the first seizure compared to males (two-way ANOVA, p=0.043); Cre+ females had a shorter latency to the first seizure relative to Cre+ males (Bonferroni’s test, p=0.010).
The number of seizures in the first 2 hr after pilocarpine injection were similar in males and females (two-way ANOVA, p=0.436).
The severity of the first seizure (non-convulsive or convulsive) was similar between genotypes (Chi-square test, p=0.093).
Cre+ mice had a shorter duration of SE than Cre− mice (t-test, p=0.007).
After separating males and females, the first seizure was mostly non-convulsive in Cre+ females compared to Cre− females (60% vs. 14%) but no groups were statistically different (Fisher’s exact tests, p>0.05).
Once sexes were separated, there was no effect of sex by two-way ANOVA but a trend in Cre+ males to have a shorter SE duration than Cre− males (Bonferroni’s test, p=0.078).

Pooled data of females and males showed no significant effect of genotype on chronic seizure number. The total number of seizures during 3 weeks of recording were similar between genotypes (t-test, p=0. 882).
After separating data based on sex, females showed fewer seizures. Cre+ females had fewer seizures than Cre− females (Bonferroni’s test, p=0.004). There was a sex difference in control mice, with fewer seizures in Cre− males compared to Cre− females (Bonferroni’s test, p<0.001).
Pooled data of females and males showed no significant effect of genotype on or chronic seizure frequency. The frequency of chronic seizures (number of seizures per day) were similar (Welch’s t-test, p=0.717).
Seizure frequency was reduced in Cre+ females compared to Cre− females (Bonferroni’s test, p=0.004). There was a sex difference in control mice, with lower seizure frequency in Cre− males compared to Cre− females (Bonferroni’s test, p<0.001).
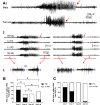
Each data point is the mean seizure duration for a mouse. Pooled data of females and males showed no significant effect of genotype on seizure duration (t-test, p=0.379).
There was a sex difference in seizure duration, with Cre− males having longer seizures than Cre− females (Bonferroni’s test, p=0.005). Because females exhibited more postictal depression (see Fig. 3), corresponding to spreading depolarization (Ssentongo et al. 2017), the shorter female seizures may have been due to truncation of seizures by spreading depolarization.
Every seizure is shown as a data point. The durations were similar for each genotype (Mann-Whitney U test, p=0.079).
Cre+ females showed longer seizures than Cre− females (Dunn’s test, p<0.001). Cre+ females may have had longer seizures because they were protected from spreading depolarization.

A seizure of a male mouse and female mouse are shown to illustrate postictal depression starting at the end of the seizure (red arrow).
All 4 channels are shown for the male (left) and female mouse (right). Rt OC, right occipital cortex; Lt FC, left frontal cortex; Lt HC, left hippocampus; Rt HC, right hippocampus. The red arrows point to the end of the seizure.
The areas in A2 marked by the red bar are expanded. The blue double -sided arrows reflect the mean EEG amplitude before (a, c) and after the seizure (b,d).

The number of days with seizures were similar between genotypes (t-test, p=0.822).
The maximum seizure-free interval was similar between genotypes (t-test, p=0.107).
After separating females and males, two-way ANOVA showed no effect of genotype or sex on days with seizures.
Two-way ANOVA showed no effect of genotype or sex on the maximum seizure-free interval.
The cluster durations were similar between genotypes (Mann-Whitney’s U test, p=0.723).
The maximum inter-cluster interval was similar between genotypes (t-test, p=0.104.
Cre+ females had significantly fewer clusters than Cre− females (two-way ANOVA followed by Bonferroni’s test, p=0.009). There was a sex difference, with females having more clusters than males. Cre− females had more days with >3 seizures than control males (Cre− females: 6.3 ± 1.4 days; Cre− males: 2.3 ± 0.5 days; Bonferroni’s test, p < 0.001).
There was no significant effect of genotype or sex on the maximum inter-cluster interval. However, there was a trend for the inter-cluster interval to be longer in Cre+ females relative to than Cre− females.

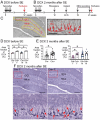
Sexes were pooled. The area fraction of DCX-ir was greater in Cre+ than Cre− mice (t-test, p=0.041).
When sexes were separated, Cre+ females showed greater DCX-ir than Cre− females (two-way ANOVA followed by Bonferroni’s test, p=0.015). There was a sex difference, with Cre− males showing more DCX-ir than Cre− females (Bonferroni’s test, p=0.007). DCX-ir was similar in Cre− and Cre+ males (Bonferroni’s test, p=0.498).
Cre− female mouse.
Cre+ female mouse. The red boxes in a are expanded in b. Arrows point to DCX-ir cells. Calibration, 100 μm (a); 50 μm (b).

Cre+ mice had more hilar Prox1-ir cells than Cre− mice (t-test, p<0.001).
When sexes were divided, Cre+ mice had more hilar Prox1-ir cells than Cre− mice in both female (two-way ANOVA followed by Bonferroni’s test, p<0.001) and male mice (Bonferroni’s test, p=0.001).
All Cre− and Cre− mice were compared regardless of sex. For the Cre− mice there was a significant inverse correlation between the # of Prox1-ir cells and # of chronic seizures (R2=0.296). Thus, the more Prox1-ir cells there were, the fewer chronic seizures there were. However, that was not true for Cre+ mice (R2=0.072).
There was an inverse correlation between the number of hilar Prox1-ir cells and the seizure-free interval for Cre+ mice (R2=0.467) but not Cre− mice (R2=0.008). Thus, the more hilar Prox1-ir cells there were, the shorter the seizure-free periods were. However, this was not true for Cre− mice.
When data were divided by genotype and sex there was no significant correlation between hilar Prox1-ir cells and # of seizures (Cre− F, R2=0.0035; Cre+ F, R2=0.043; Cre− M, R2=0.104; Cre+ M, R2=0.083).
When data were divided by genotype and sex, there was a significant inverse correlation for the # of hilar Prox1-ir cells and seizure-free interval, but only for male Cre+ mice (R2=0.704). Cre+ females showed a trend (R2=0.395) and Cre− mice did not (Cre− F, R2=0.007, Cre− M, R2=0.046).

1–2. Representative examples of GluR2/3 labelling of Cre− (1) and Cre+ mice (2). Calibration, 50 μm.
3. Cre+ mice had more hilar GluR2/3-immunofluorescent (positive; +) cells than Cre− mice (t-test, p=0.022). Sexes were pooled.
4. After separating females and males, Cre+ females showed more hilar GluR2/3+ cells than Cre− females (Bonferroni’s test, p=0.011). Hilar GluR2/3+ cells were similar between genotypes in males (Bonferroni’s test, p=0.915).
1–2. Representative examples of SOM labelling in Cre− and Cre+ mice are shown. Calibration, 100 μm (a); 20 μm (b).
3. In pooled data, Cre+ mice had more hilar SOM cells than Cre− mice (t-test, p=0.008).
4. After separating females and males, Cre+ females showed more hilar SOM cells than Cre− females (Bonferroni’s test, p=0.019). Hilar SOM cells were similar between genotypes in males (Bonferroni’s test, p=0.897).
1–2. Representative examples of parvalbumin labelling in Cre− and Cre+ mice are shown. Calibration, 100 μm.
3. The number of parvalbumin+ cells in the DG were similar in Cre− and Cre+ mice in pooled data (t-test, p=0.095).
There was no effect of genotype (p=0.096) or sex (p=0.616) on the number of DG parvalbumin+ cells.

Comparisons of female mice by two-way ANOVA showed an effect of genotype (F(1,15)=11.97, p=0.004) with less Fluorojade C in Cre+ mice for CA1 (p=0.016) and subiculum p=0.016).
Comparisons of male mice showed no significant effect of genotype on Fluorojade C in either CA1 or the subiculum (F(1,8)=0.002, p=0.965; CA1, p=0.828, subiculum, p=0.973, respectively).
When genotypes were pooled, female mice did not have significantly more damage than males (two-way ANOVA, sex (F(1,34)=3.16, p=0.085) and there was no effect of subfield (F(1,34)=0.0016, p=0.968).
References
-
- Altman J 2011. The discovery of adult mammalian neurogenesis. In: Seki T, Sawamoto K, Parent JM & Alvarez-Buylla A (eds.) Neurogenesis in the adult brain 1: Neurobiology. Springer.
Publication types
Grants and funding
LinkOut - more resources
Full Text Sources
Research Materials
Miscellaneous
