[Preprint]. 2024 Sep 15:2023.07.21.549993.
doi: 10.1101/2023.07.21.549993.

Integrative determination of the atomic structure of mutant huntingtin exon 1 fibrils implicated in Huntington's disease

Affiliations

Integrative determination of the atomic structure of mutant huntingtin exon 1 fibrils implicated in Huntington's disease

Mahdi Bagherpoor Helabad et al. bioRxiv. .

Update in

Abstract

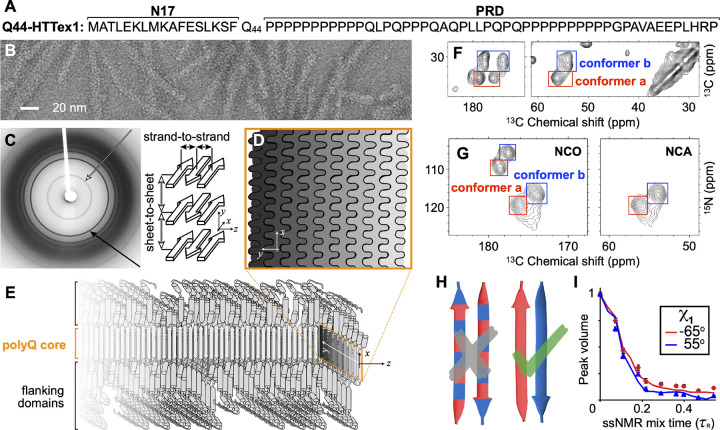
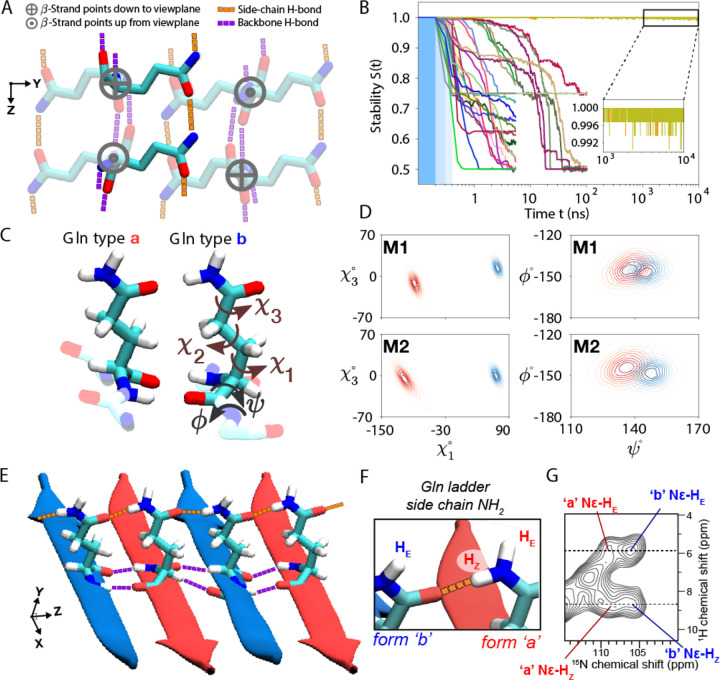
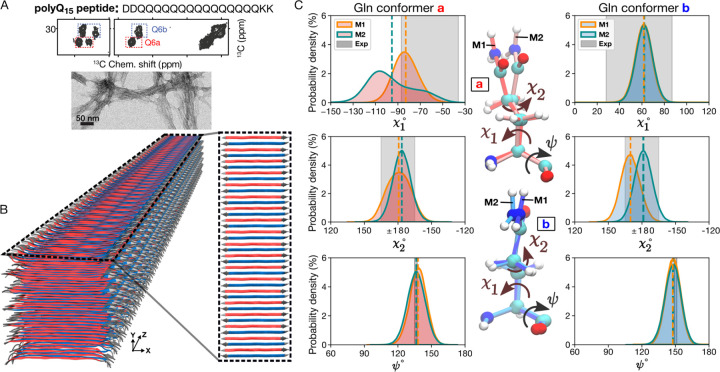
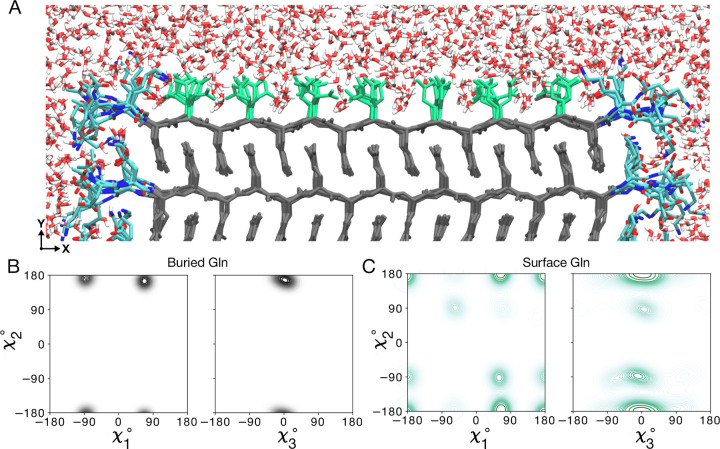
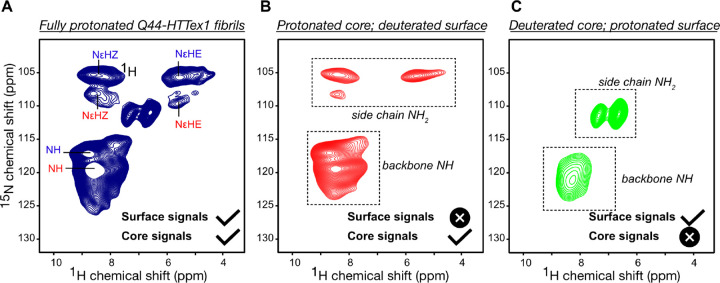
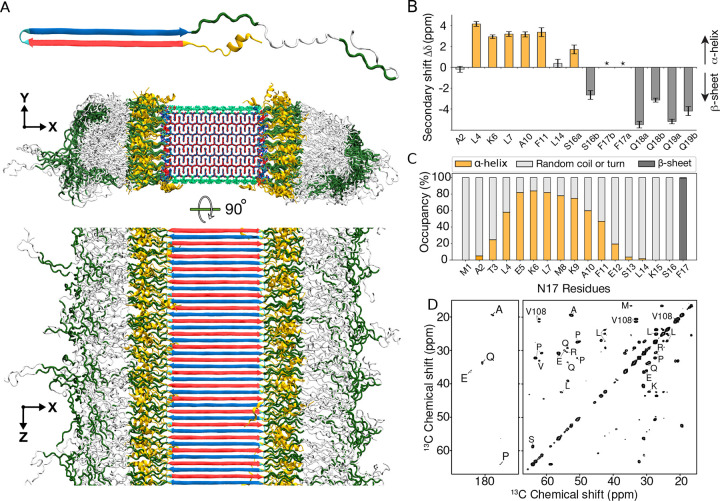
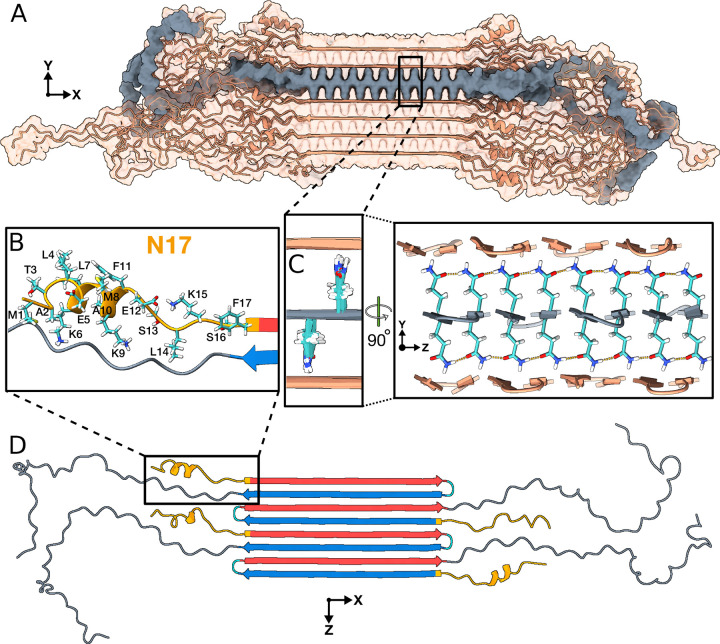
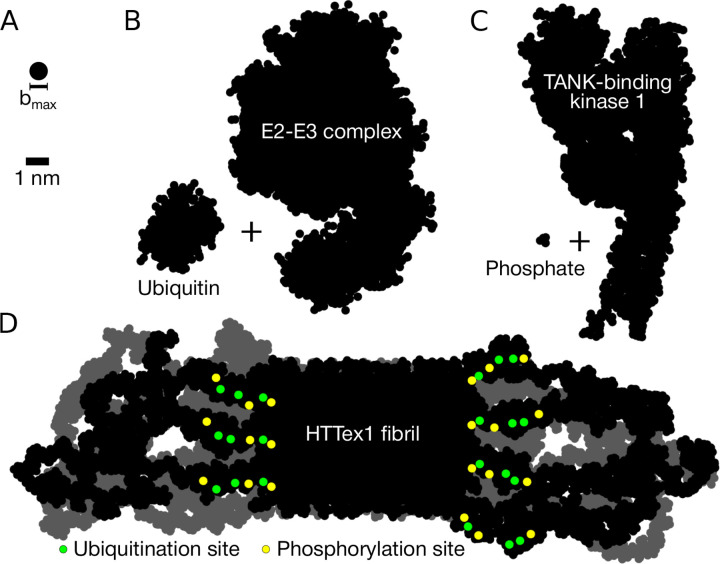
Neurodegeneration in Huntington's disease (HD) is accompanied by the aggregation of fragments of the mutant huntingtin protein, a biomarker of disease progression. A particular pathogenic role has been attributed to the aggregation-prone huntingtin exon 1 (HTTex1), generated by aberrant splicing or proteolysis, and containing the expanded polyglutamine (polyQ) segment. Unlike amyloid fibrils from Parkinson's and Alzheimer's diseases, the atomic-level structure of HTTex1 fibrils has remained unknown, limiting diagnostic and treatment efforts. We present and analyze the structure of fibrils formed by polyQ peptides and polyQ-expanded HTTex1 in vitro. Atomic-resolution perspectives are enabled by an integrative analysis and unrestrained all-atom molecular dynamics (MD) simulations incorporating experimental data from electron microscopy (EM), solid-state NMR, and other techniques. Alongside the use of prior data, we report new magic angle spinning NMR studies of glutamine residues of the polyQ fibril core and surface, distinguished via hydrogen-deuterium exchange (HDX). Our study provides a new understanding of the structure of the core as well as surface of aggregated HTTex1, including the fuzzy coat and polyQ-water interface. The obtained data are discussed in context of their implications for understanding the detection of such aggregates (diagnostics) as well as known biological properties of the fibrils.


Conflict of interest statement

Competing Interests The authors declare no competing interests.

Figures

Figure 1.
Figure 1.. Select structural data on HTT Exon 1 aggregates.
(A) Sequence of Q44-HTTex1. N- and C-terminal flanking domains marked as N17 and PRD, respectively. (B) Negatively-stained TEM of Q44-HTTex1 aggregates formed in vitro; average fiber width ~6.5 nm. (C) X-ray fiber diffraction of K2Q31K2 fibrils, detecting the cross-β reflections of the amyloid core that represent the inter-strand and inter-sheet distances shown on the right. (D) Cross-section of the (6–7-nm wide) block-like core showing the layering and interdigitation of (differently shaded) β-sheets. (E) Schematic model of a Q44-HTTex1 fibril, showing the N17 and PRD flanking domains outside the polyQ core. (F) 2D 13C–13C ssNMR spectrum of 13C,15N-labeled Q44-HTTex1 fibrils showing backbone and sidechain cross-peaks of the dominant signals of the polyQ fibril core. Peaks for Cα–CX correlations of two distinct “a” and “b” Gln conformers are marked with red and blue boxes, respectively. (G) 2D NCO and NCA ssNMR spectra of Q44-HTTex1 fibrils, with the conformer “a” and “b” again marked. (H) Pairs of antiparallel β-strands, schematically showing two previously proposed arrangements of the “a” (red) and “b” (blue) types of Gln. Given the ssNMR data (panels F–G), only the right one fits the experimental data. See also Supplementary Fig. S1 (I) ssNMR measurements sensitive of the side-chain dihedral angle χ1, with simulated curves for “a” (red) and “b” (blue) types of Gln. Panels B–C and I adapted with permission from Ref. 8, D–E from 38, and G from 39.
Figure 2.
Figure 2.. Glutamine zippers and ladders within the polyQ amyloid core.
(A) The eight-Gln building block used to generate polyQ core candidates. Six residues are shown faded out to bring the two non-faded in focus: these two are on adjacent β-strands of an antiparallel β-sheet, stabilized by backbone hydrogen bonds (purple), and continuous chains of side-chain hydrogen bonds (orange). The latter are crucial for packing the polar glutamines into a waterless amyloid core. When generating the core candidates, all the χ1 and χ3 dihedral angles were independently rotated to explore all potential hydrogen bond networks. (B) Stabilities (see Eq. (1) in Methods) of the 30 experimentally-feasible polyQ core candidates (represented by color-coded lines) as a function of MD simulation time. The three blue-shaded sections indicate the gentle protocol chosen for initiating simulations from the energy-minimized ideal structures: Decreasing position restraints (of 1000, 500, and 100 kJ/mol/nm2) over three consecutive 100-ps periods led to the unrestrained simulation. Notably, only two candidates maintain stability throughout the 10-μs MD simulations; we denote these M1 and M2. (C) Atomic-level structures of the type “a” and “b” Glns in M2. Gln dihedral angle names shown on “b”. (D) The side-chain χ1χ3 (left panels) and backbone ψϕ (right) dihedral angle distributions of conformers “a” (red) and “b” (blue) for the final models M1 (top) and M2 (bottom). (E) Illustration of the inter-side-chain hydrogen-bond ‘ladders’ (orange) in M2. (F) Nomenclature for Nϵ protons involved in the H-bonding along the ladder (HZ) or orthogonal to it (HE). (G) 2D 1H-15N MAS NMR spectrum on HTTex1 fibrils (see also Supplementary Fig. S7). Four cross-peaks are marked for the Gln side-chain NH2 protons of the “a”- and “b”-conformers that form the core. The dashed lines mark the 1H shifts for the HZ and HE protons, showing that they are identical for two conformers. Panels B didate the Amber14SB45 force field; for OPLSAA/M46 and CHARMM36m47 see Supplementary Figs S4, S5.
Figure 3.
Figure 3.. PolyQ peptide fibril structure.
(A) Amino acid sequence of D2Q15K2 peptide (top), 2D 13C–13C ssNMR spectrum (middle) of D2Q15K2 fibrils with single 13C-labeled Gln (Q6), and negatively-stained TEM of the peptide aggregates (bottom). The ssNMR data adapted from Ref. 8. Signals from type ”a” and ”b” Gln conformers are shown in red and blue boxes, respectively. (B) 3D cartoon representation of the structural model of the D2Q15K2 fibril. The alternation of β-strands of ”a” (red) and ”b” (blue) Gln conformers within a single sheet is shown on the right. (C) The χ1, χ2, and ψ dihedral angle distributions of “a” (left) and “b” (right) conformers in the context of the D2Q15K2 fibril for the M1 (orange) and M2 (green) models; dashed vertical lines represent mean values. The data were obtained from 1-μs MD simulations (using the OPLSAA/M force field; for Amber14SB see Supplementary Fig. S10). Gray shading depicts the ssNMR constraints for the dihedral angles. The structures at the center show representative “a” (top) and “b” (bottom) conformers of the M1 and M2 models.
Figure 4.
Figure 4.. Atomic model of the water-facing surface of polyQ amyloid.
(A) Atomistic MD snapshot of the D2Q15K2 peptide fibril’s polyQ surface in contact with water. Exposed and buried Gln residues are colored green and gray, respectively. Note how the Gln side-chains internal to the (model M1, for M2 see Supplementary Fig. S12) amyloid core are well-ordered, while the water-facing side-chains display more mobility. (B) Side-chain dihedral angle distributions for the buried Gln residues and (C) for the Gln residues on the fibril surface (Amber14SB; for OPLSAA/M see Supplementary Figs. S13, S14). The surface-facing residues show more disorder, but are nonetheless constrained to just few varyingly prominent specific rotamer states.
Figure 5.
Figure 5.. NMR analysis of polyQ core and surface residues based on H–D exchange.
(A) 2D 1Hdetected 1H–15N HETCOR NMR spectrum of fully protonated Q44-HTTex1 fibrils. The peak labels are color-coded based on the conformer type (“a” = red; “b” = blue), corresponding to the amyloid core assignments from Supplementary Fig. S7. Attenuation of peaks from the “a”-conformer side-chains is attributed to different dynamics (see also Supplementary Fig. S15D). (B) Analogous data for surface-deuterated Q44-HTTex1 fibers, which is expected to only show peaks from the fibril core. (C) Analogous 2D spectrum for core-deuterated, surface-detected Q44-HTTex1 fibers, which reveals distinct signals from residues on the polyQ surface. The most dramatic difference is seen for the side chain NH2 group. Measurements at 700 MHz using 60 kHz MAS, at 253 K setpoint temperature. See also Supplementary Fig. S15 for additional data and relaxation measurements.
Figure 6.
Figure 6.. Structure of Q44-HTTex1 amyloid fibril.
(A) Atomic-level structural model for mutant HTTex1 fibril. The top image shows a representative monomer within the fibril, with its β-hairpin polyQ segment to the left and the largely disordered flanking segments to the right. The middle image shows a cross-section, and the bottom image a side view of the fibril. The polyQ core is shown with the conformer-identifying red (for “a”) and blue (for “b”) β-strands, the N-terminal flanking segments yellow, and the C-terminal polyproline II helices dark green. Surface residues of the polyQ amyloid core are light green. (B) Secondary chemical shift values for residues in the N-terminal end, indicating local α-helix (positive values) or β-sheet (negative) conformations, replotted from previously reported work. Doubled peaks indicating multiple co-existing conformations are marked with letters a and b. The asterisks mark F17, for which a peak (13Cβ) was not detected, but other resonances indicate β-sheet structure. (C) Secondary structure distribution of the 17 residues in the N-terminal flanking domain during the last 500ns of 5-μs MD simulation (Amber14SB). (D) A 2D TOBSY ssNMR spectrum of Q44-HTTex1 fibrils, in which observed cross-peaks correspond to highly flexible residues outside the fibril core. Most, but not all, peaks originate from the C-terminal tail of the PRD. Spectrum was acquired at 600MHz at 8.33kHz MAS.
Figure 7.
Figure 7.. Structural analysis of the Q44-HTTex1 amyloid fibril.
For an illustrative 3D exploration of Q44-HTTex1 fibril structure, see the associated video in Extended Data 1. (A) A graphical depiction (after 5-μs simulation in Amber14SB) of the HTTex1 fibril. The region shaded in gray denotes a single sheet within the fibril’s architecture. (B) An atomic view of the N17 domain within the fibril, naming the specific amino acids. (C) An atomic depiction of the glutamine side-chains within the fibril. The high stability of the fibril structure is primarily attributed to the extensive hydrogen bonding interactions among the glutamines, as depicted in the right panel. (D) Top view representation of the β-sheet highlighted in panel A. A quartet of HTTex1 monomers is visible. The polyQ is color-coded for the type “a” (red) and “b” (blue) strands; the tight β-turn is cyan. The N17 and PRD domains are orange and gray, respectively. Note the structural variation between different monomers in the same fibril sheet, including in particular the range of helical content in the N17.
Figure 8.
Figure 8.. PRD-domain brushes prevent post-translational-modification enzymes from reaching their target sites in HTTex1 fibrils.
(A) Size of the largest molecular species (bmax= 0.8 nm) that can penetrate the polymer brush formed by the C-terminal PRD domains (as given by the polymer brush theory, see Methods). Silhouettes of the (B) E2-E3 Ubiquitin-Conjugating Complex (PDB code 1C4Z) + ubiquitin (1UBQ), and (C) TANK-Binding Kinase 1 (6CQ0) + phosphate. (D) Silhouette of the HTTex1 fibril. The view is along the fibril growth direction. Shown are two consecutive monomer layers: the top layer in black, the layer behind it in gray. Post-translational modification sites in the top layer highlighted in colour: the potential phosphorylation sites (residues T3, S13, and S16 in the N-terminal N17 domain) in yellow, and ubiquitination sites (residues K6, K9, and K15, also in the N17 domain) in green.

Similar articles

References

    1. Ross C. A. Polyglutamine pathogenesis: emergence of unifying mechanisms for Huntington’s disease and related disorders. Neuron 35, 819–822 (2002). - PubMed
    1. Bates G. P. et al. Huntington disease. Nature Reviews Disease Primers 1, 1–21 (2015). - PubMed
    1. DiFiglia M. et al. Aggregation of huntingtin in neuronal intranuclear inclusions and dystrophic neurites in brain. Science 277, 1990–1993 (1997). - PubMed
    1. Bauerlein F. J.¨ et al. In situ architecture and cellular interactions of polyq inclusions. Cell 171, 179–187 (2017). - PubMed
    1. Peskett T. R. et al. A Liquid to Solid Phase Transition Underlying Pathological Huntingtin Exon1 Aggregation. Mol Cell 70, 588–601.e6 (2018). - PMC - PubMed

Publication types