[Preprint]. 2023 Jul 18:rs.3.rs-3131295.
doi: 10.21203/rs.3.rs-3131295/v1.

Inhibiting tau-induced elevated nSMase2 activity and ceramides is therapeutic in murine Alzheimer's disease

Affiliations

Inhibiting tau-induced elevated nSMase2 activity and ceramides is therapeutic in murine Alzheimer's disease

Carolyn Tallon et al. Res Sq. .

Update in

Abstract

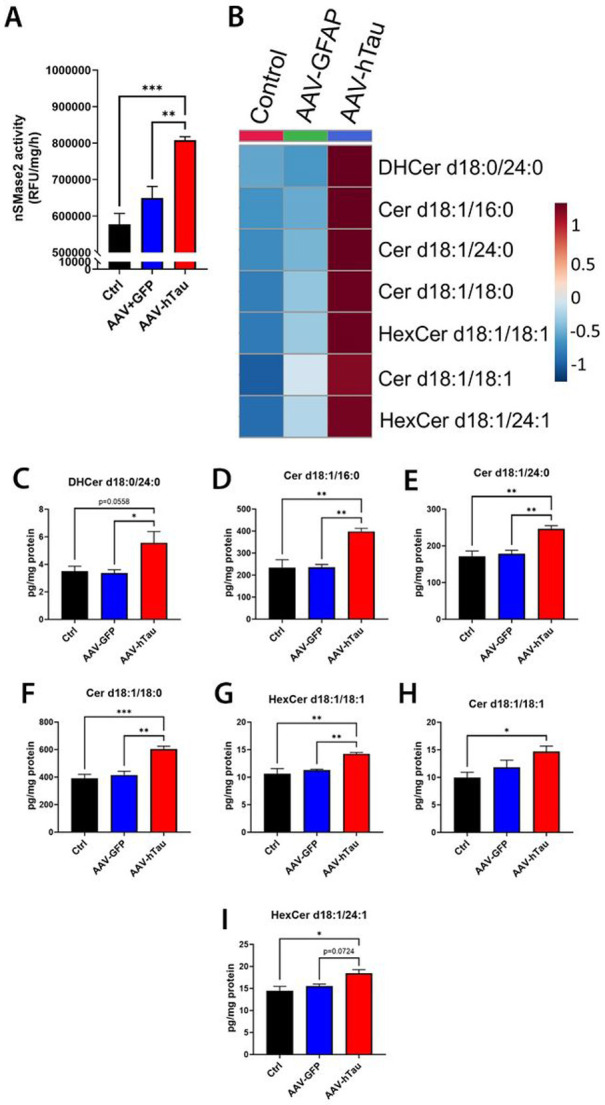
Background: Cognitive decline in Alzheimer's disease (AD) is associated with prion-like tau propagation between neurons along synaptically connected networks, in part via extracellular vesicles (EV). EV biogenesis is triggered by ceramide enrichment at the plasma membrane from neutral sphingomyelinase2(nSMase2)-mediated cleavage of sphingomyelin. We report, for the first time, that tau expression triggers an elevation in brain ceramides and nSMase2 activity.

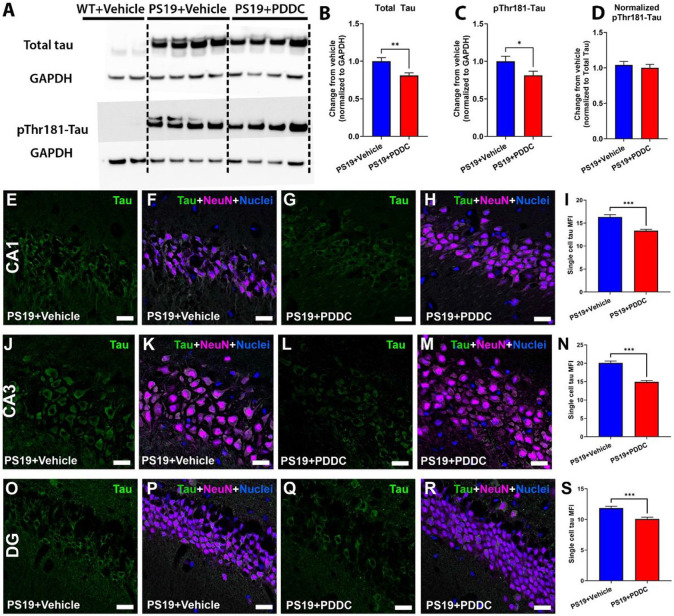
Methods: To determine the therapeutic benefit of inhibiting this elevation, we evaluated the efficacy of PDDC, the first potent, selective, orally bioavailable, and brain-penetrable nSMase2 inhibitor, in the PS19 tau transgenic AD murine model. Changes in brain ceramide and sphingomyelin levels, Tau content, histopathology, and nSMase2 target engagement were monitored, as well as changes in the number of brain-derived EVs in plasma and their Tau content. Additionally, we evaluated the ability of PDDC to impede tau propagation in a murine model where an adeno-associated virus(AAV) encoding for P301L/S320F double mutant human tau was stereotaxically-injected unilaterally into the hippocampus and the contralateral transfer to the dentate gyrus was monitored.

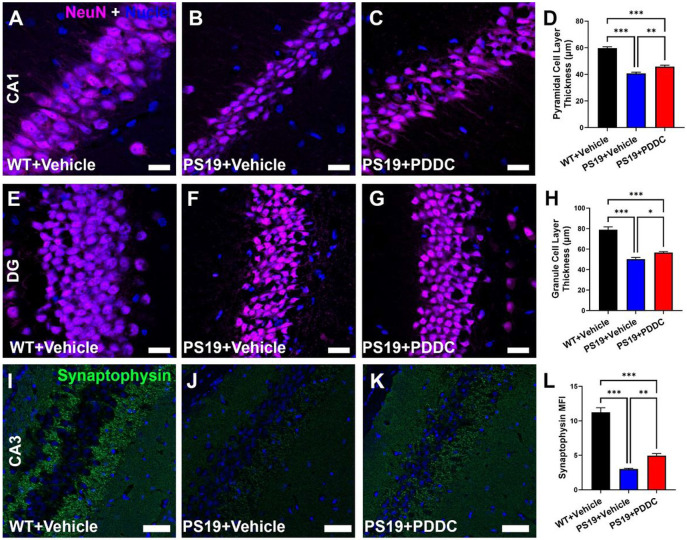
Results: Similar to human AD, PS19 mice exhibited increased brain ceramides and nSMase2 activity; both were completely normalized by PDDC treatment. PS19 mice exhibited elevated tau immunostaining, thinning of hippocampal neuronal cell layers, increased mossy fiber synaptophysin immunostaining, and glial activation, all pathologic features of human AD. PDDC treatment significantly attenuated these aberrant changes. Mouse plasma isolated from PDDC-treated PS19 mice exhibited reduced levels of neuron- and microglia-derived EVs, the former carrying lower phosphorylated Tau(pTau) levels, compared to untreated mice. In the AAV tau propagation model, PDDC normalized the tau-induced increase in brain ceramides and significantly decreased tau spreading to the contralateral side.

Conclusions: PDDC is a first-in-class therapeutic candidate that normalizes elevated brain ceramides and nSMase2 activity leading to the slowing of tau spread in AD mice.

Keywords: Alzheimer’s disease; ceramide; extracellular vesicles; neutral sphingomyelinase 2; tau.


Conflict of interest statement

Competing interests: C.T., A.G.T., R.R., and N.J.H and B.S.S. are listed as inventors in patent applications filed by Johns Hopkins Technology Ventures covering novel compositions and utilities of nSMase2 inhibitors, including PDDC. This arrangement has been reviewed and approved by the Johns Hopkins University in accordance with its conflict-of-interest policies. Other authors declare that no conflict of interest exist.

Figures

Figure 1
Figure 1. Mutant tau expression induces a significant increase in nSMase2 activity and ceramide levels in cultured neurons.
A) nSMase2 activity from untransduced control (Ctrl), AAV-GFP transduced, and AAV-hTau(P301L/S320F) transduced cells. B) Heat map of the significantly elevated ceramide species in AAV-hTau(P301L/S320F) transduced cells compared to either control or AAV-GFP transduced cells. Colors represent fold-change in relative-abundance compared to untransduced control cell levels. C-I) Individual levels of the altered ceramides. N=4/group. Bars represent mean±SEM. *p<0.05, **p<0.01, ***p<0.001. One-way ANOVA with Tukey’s multiple comparison.
Figure 2
Figure 2. Brain ceramides are robustly elevated in PS19 mice and are normalized with PDDC treatment.
A) Plasma and brain levels of PDDC measured over 24h following 4 weeks of dosing. N=3/group/time point. Points represent mean±SEM. B) Dosing schematic. C) Percent change of body weight at the time of sacrifice from the maximum body weight over a 5-month dosing period from WT+Vehicle, PS19+Vehicle, and PS19+PDDC groups. N=16-20. D) Quantification of hippocampal nSMase2 activity in WT+Vehicle, PS19+Vehicle, and PS19+PDDC mice. N=8-10/group. E) Heatmap showing the ceramide species significantly reduced in PDDC-treated PS19 mice compared to vehicle-treated PS19 mice(p<0.05). Colors represent relative abundance of each ceramide. F-P) Cortical ceramide levels in WT and PS19 mice chronically treated with vehicle or PDDC. N=6-11/group. Bars represent mean±SEM. *p<0.05. **p<0.01. ***p<0.001. One-way ANOVA with Tukey’s multiple comparison.
Figure 3
Figure 3. PDDC treatment reduces hippocampal tau levels in PS19 mice.
A) Representative Western blots from micro-dissected hippocampal tissue showing total human tau (upper blot) and pThr181-Tau (lower blot). GAPDH shown as a loading control. B) Quantification of Western blots for total tau. C) Quantification of Western blots for pThr181-Tau. D) pThr181-Tau level normalized to total tau. N=11-12/group. Representative images showing pThr181-Tau staining (green) and neuronal staining (magenta) from vehicle and PDDC treated PS19 mice at the CA1 (E-H), CA3 (J-M) and dentate gyrus (DG, O-R). Single cell mean fluorescence intensity (MFI) from the CA1 (I), CA3 (N), and DG (S). Nuclei shown in blue. N=120cells/group from 4 mice/group. Bars represent mean±SEM. *p<0.05, **p<0.01, ***p<0.001. Scale bar, 20μm. Gamma and brightness adjusted equally for all images presented. All graphs, unpaired two-tailed t-test.
Figure 4
Figure 4. PDDC reduces hippocampal cell layer thinning and mossy fiber synaptophysin loss in PS19 mice.
A-H) Pyramidal cell layer thickness from the CA1 region (A-D) and granule cell layer thickness from the dentate gyrus (DG, E-H). Representative images showing NeuN neuronal staining (magenta) from WT (A, E), vehicle-treated PS19 (B, F) and PDDC-treated PS19 (C, G) mice. Nuclei shown in blue. Scale bar, 20μm. D, H) Quantification of neuronal cell density counts from CA1 (D) and DG (H). N=122-141 images/group from 7-8 mice/group. I-L) Synaptophysin staining (green) of the mossy fiber layer in the CA3 from WT (I), vehicle-treated PS19 (J), and PDDC-treated PS19 (K) mice. Scale bar, 50μm. L) Quantification of the mean fluorescence intensity (MFI) of synaptophysin staining in the mossy fiber layer. Bars represent mean±SEM. *p<0.05, **p<0.01, ***p<0.001. N=45-54 images/group from 5-6 mice/group. One-way ANOVA with Tukey’s multiple comparison.
Figure 5
Figure 5. PDDC treatment reduces glial activation in the hippocampus of PS19 mice.
Representative images from WT mice (A-C), vehicle-treated PS19 mice (D-F), and PDDC-treated PS19 mice (G-I). Microglia were stained with Iba1 (red). Astrocytes were stained with GFAP (green). Nuclei shown in blue. J) Quantification of Iba1 MFI staining. K) Quantification of GFAP MFI staining. N=216-232 images/group from 9-10 mice/group. Bars represent mean±SEM. **p<0.01, ***p<0.001. Scale bar, 50μm. Gamma and brightness adjusted equally for all images. One-way ANOVA with Tukey’s multiple comparison.
Figure 6
Figure 6. PDDC reduces plasma nEVs carrying pThr181-Tau in PS19 mice.
A) Quantification of L1CAM+ nEVs immunocaptured from the plasma of WT mice, vehicle- and PDDC-treated PS19 mice by NTA. N=15-16. B) Averaged size profiles of L1CAM+ nEVs from the plasma of WT mice, vehicle- and PDDC-treated PS19 mice (N=15-16). C) pThr181-Tau in lysed L1CAM+ nEVs from WT mice, vehicle- and PDDC-treated PS19 mice. N=11-12. D) pThr181-Tau normalized to nEV concentration from WT mice, vehicle- and PDDC-treated PS19 mice. N=11-12. One-way ANOVA with Tukey’s multiple comparison. E) Dot plots showing the vSSC vs. APC-β-III-tubulin signal of BSE+ events gated in Fig S5 for vehicle (left, blue events) and PDDC (middle, red events). Black line: threshold for APC-β-III-tubulin + events. Yellow events indicate negative control EVs labeled with BSE only. Bar graph: average percentage of APC-β-III-tubulin+ events out of total BSE+ events. F) Dot plots showing the vSSC vs PE-pTau-Ser262 signal of APC-β-III-tubulin+ events gated in B. Black line: threshold for PE-pTau-Ser262+ signal. Bar graph: average percentage of APC-β-III-tubulin+ events double-positive for PE-pTau-Ser262. G and H)Bar graph: mean percentage of APC-Iba-1+ events out of total BSE+ events (G) or APC-Iba-1+ events double-positive for PE-pTau-Ser262 (H) for each group. E-H, Two-way ANOVA. Bars represent mean±SEM. *p<0.05. **p<0.01. ***p<0.001.
Figure 7
Figure 7. PDDC treatment reduces tau spread in an AAV mutant hTau propagation model.
A) AAV-hTau model and dosing schematic. Mice were stereotaxically injected at 10 weeks-old into the left dorsal hippocampus with AAV-CBA-hTau24(P301L)(S320F)-WPRE which was taken up and expressed by cells in the left CA3 and dentate gyrus and propagated to the right DG hilus region over the course of 6 weeks. B) Representative images of the contralateral DG showing pThr181-Tau staining (green) from vehicle-treated (top) and PDDC-treated (bottom) AAV-hTau mice. Neurons stained with NeuN (magenta). Nuclei shown in blue. Scale bar, 50μm. Gamma and brightness adjusted equally for all images presented. C) Quantification of pThr181-Tau MFI of the contralateral DG normalized to the ipsilateral DG pThr181-Tau MFI. N=81-84 images/group from 17 mice/group. D) Quantification of the percentage of pThr181-Tau+ neurons in the contralateral dentate gyrus. N=56-72 images/group from 17 mice/group. Unpaired two-tailed t-test. **p<0.01. Bars represent mean±SEM.

References

    1. Biogen, Biogen and Eisai Announce Design of ADUHELM ICARE AD-US Study, the First Real-World Observational Phase 4 Study in Alzheimer’s Disease at AAIC 2021. (2021).
    1. Avgerinos K. I., Ferrucci L., Kapogiannis D., Effects of monoclonal antibodies against amyloid-beta on clinical and biomarker outcomes and adverse event risks: A systematic review and meta-analysis of phase III RCTs in Alzheimer's disease. Ageing Res Rev 68, 101339 (2021). - PMC - PubMed
    1. Braak H., Braak E., Neuropathological stageing of Alzheimer-related changes. Acta Neuropathologica 82, 239–259 (1991). - PubMed
    1. Ossenkoppele R., Pichet Binette A., Groot C., Smith R., Strandberg O., Palmqvist S., Stomrud E., Tideman P., Ohlsson T., Jogi J., Johnson K., Sperling R., Dore V., Masters C. L., Rowe C., Visser D., van Berckel B. N. M., van der Flier W. M., Baker S., Jagust W. J., Wiste H. J., Petersen R. C., Jack C. R. Jr., Hansson O., Amyloid and tau PET-positive cognitively unimpaired individuals are at high risk for future cognitive decline. Nature medicine 28, 2381–2387 (2022). - PMC - PubMed
    1. Simon D., Garcia-Garcia E., Royo F., Falcon-Perez J. M., Avila J., Proteostasis of tau. Tau overexpression results in its secretion via membrane vesicles. FEBS Lett 586, 47–54 (2012). - PubMed

Publication types

LinkOut - more resources