[Preprint]. 2023 Jul 12:2023.07.12.548736.
doi: 10.1101/2023.07.12.548736.

High throughput PRIME editing screens identify functional DNA variants in the human genome

Affiliations

High throughput PRIME editing screens identify functional DNA variants in the human genome

Xingjie Ren et al. bioRxiv. .

Update in

Abstract

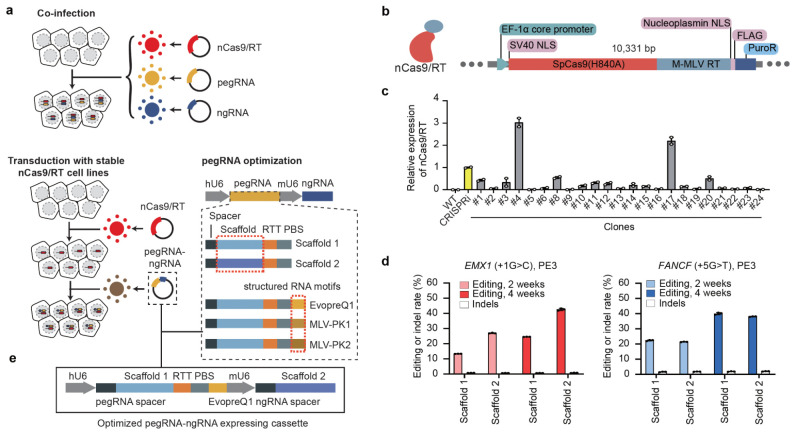
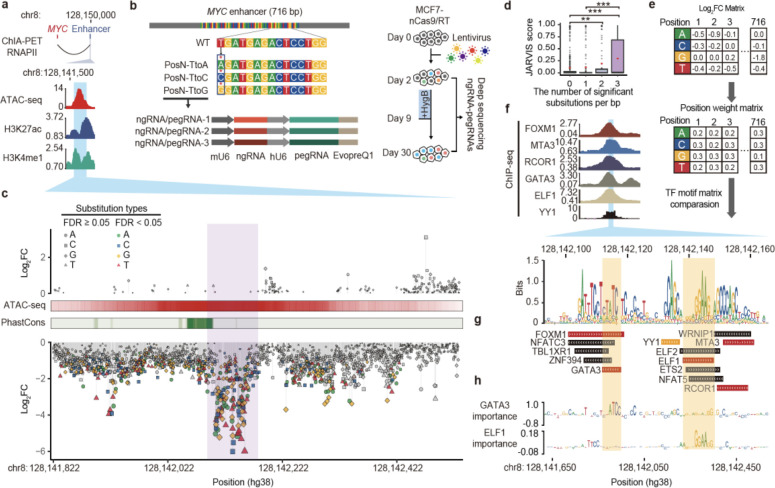
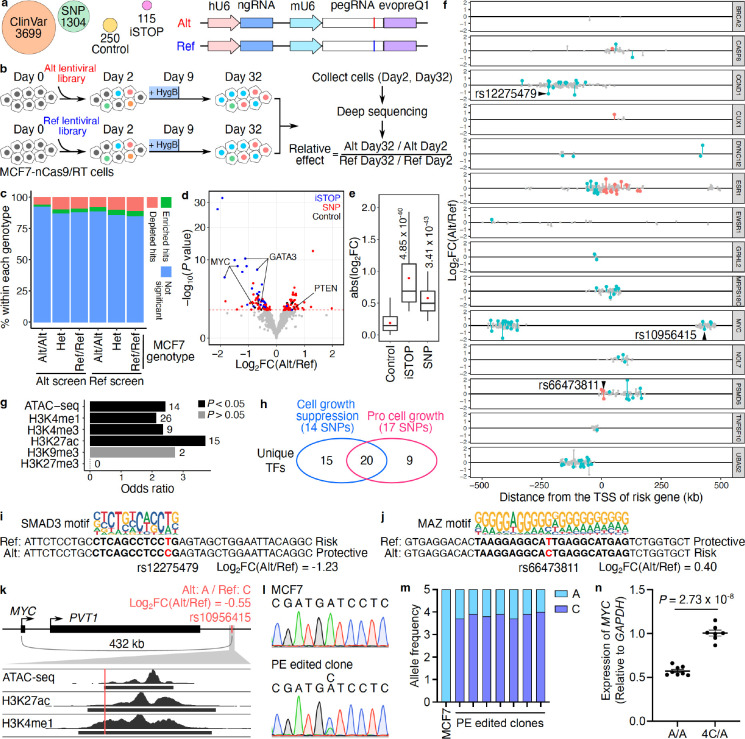
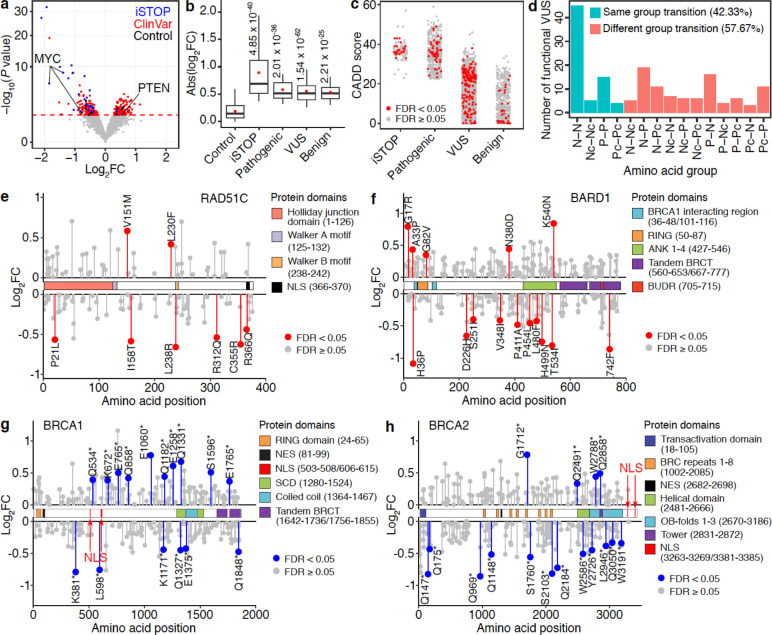
Despite tremendous progress in detecting DNA variants associated with human disease, interpreting their functional impact in a high-throughput and base-pair resolution manner remains challenging. Here, we develop a novel pooled prime editing screen method, PRIME, which can be applied to characterize thousands of coding and non-coding variants in a single experiment with high reproducibility. To showcase its applications, we first identified essential nucleotides for a 716 bp MYC enhancer via PRIME-mediated saturation mutagenesis. Next, we applied PRIME to functionally characterize 1,304 non-coding variants associated with breast cancer and 3,699 variants from ClinVar. We discovered that 103 non-coding variants and 156 variants of uncertain significance are functional via affecting cell fitness. Collectively, we demonstrate PRIME capable of characterizing genetic variants at base-pair resolution and scale, advancing accurate genome annotation for disease risk prediction, diagnosis, and therapeutic target identification.


Conflict of interest statement

Competing interests statement X.R., H.Y., and Y.S. have filed a patent application related to pooled prime editing screens. Code availability statement A copy of the custom code used for data analysis and figure generation in this study is available upon request.

Figures

Figure 1.
Figure 1.. Optimizing PE efficiency in mammalian cells using lentiviral delivery.
(a) The different strategies tested for optimizing PE efficiency in MCF7 cell lines. Top: co-infecting three different viruses to deliver PE machinery. Bottom: dual pegRNA/ngRNA viral infection of clonal MCF7 line stably expressing nickase Cas9 (nCas9) and Moloney murine leukemia virus reverse transcriptase (M-MLV RT). Two scaffolds and three different structured RNA motifs tested are also shown. (b) Lentiviral construct for generating nCas9/RT expressing MCF7 clones. PuroR, Puromycin resistance gene. M-MLV RT, Moloney murine leukemia virus reverse transcriptase. (c) RT-qPCR analysis showing the relative expression of nCas9/RT in different clones, normalized to the dCas9 expression of an established CRISPRi iPSC line (Yellow). Error bars represent the s.e.m. (d) The editing efficiency and indel rate for EMX1 and FANCF loci at 2 weeks and 4 weeks after PE installation using two different RNA scaffolds. Error bars represent the s.d. (e) Improved vector for expression of pegRNA and ngRNA for PRIME. RTT: reverse transcription template, PBS: primer binding site.
Figure 2.
Figure 2.. Functional characterization of a MYC enhancer by saturation mutagenesis using PRIME.
(a) (Top) The target enhancer is downstream of MYC. (Bottom) The enhancer region is highly enriched with ATAC-seq, H3K27ac, and H3K4me1 ChIP-seq signals. The blue area indicates the region selected for PRIME. (b) (Top) Diagram showing the design of saturation mutagenesis screening at the 716 bp enhancer. Each nucleotide was subjected to substitution with three nucleotides by PE. (Middle) Each substitution event was covered by three uniquely designed pegRNA/ngRNA pairs. (Bottom) The PRIME workflow. (c) Log2(fold change) of each substitution at each base pair ordered by their genomic locations. Mutations with a significant effect on cell fitness are colored. ATAC-seq signals and conservation scores calculated by PhastCons are shown. (d) JARVIS scores for base pairs with different numbers of significant substitutions. Box plots indicate median, IQR, Q1 − 1.5 × IQR, and Q3 + 1.5 × IQR. Outliers are shown as gray dots. Mean values are shown as red dots. P values were calculated using a two-tailed two-sample t-test. (e) The creation of a functional PWM for identifying potential TF binding sites. (f) (Top) ChIP-seq signals of 6 TFs in MCF7. The blue region indicates the core enhancer region. (Bottom) The sequence logo plot for the core enhancer regions generated by the functional PWM from (e). (g) Matched TF binding sites. (h) (Top) Dense tracks showing BPNet model-derived nucleotide importance scores for GATA3 and ELF1 binding sites.
Figure 3
Figure 3. PRIME reveals functional SNPs associated with breast cancer.
(a) Alt and Ref library design overview. In the design, we included breast cancer-associated variants (SNP), clinical variants (ClinVar), introduced stop codons (iSTOP), and non-targeting controls. For each variant, pegRNA/ngRNA pairs introducing either the Alt or Ref allele were designed. (b) Workflow of PRIME with Alt and Ref libraries. MCF7-nCas9/RT cells were infected with either lentiviral library. Cells were collected on days 2 and 32 post-infection. The abundance of pegRNA/ngRNA pairs in the samples collected on days 2 and 32 were deep sequenced. The relative effect of each variant was determined based on its relative impact on cell growth between Alt versus Ref alleles. (c) The percentage of significant hits (FDR < 0.05) identified from Alt and Ref screens for Alt/Alt, Het, and Ref/Ref genotypes in MCF7. (d) The functional SNPs (red) with either a positive or a negative impact on cell growth were determined by their relative effect in the Alt versus Ref screens. Blue dots represent significant iSTOPs, and black dots represent controls. The red dashed line indicates 0.05 FDR. (e) Absolute effects of identified functional iSTOPs and SNPs are higher than the effects of negative controls (P values were calculated by two-tailed two-sample t-test). (f) The genomic distance of SNPs tested at each risk locus relative to each gene’s TSS. Red dots are functional SNPs within gene bodies, blue dots are functional SNPs in distal regions, and gray dots are SNPs with non-significant effects. (g) Relative enrichment of genomic features for identified functional SNPs (P values were calculated by two-tailed Fisher’s exact test). The numbers of SNPs overlapping each genomic feature are labeled next to each bar. (h) Venn diagram showing the numbers of unique transcription factors (TFs) with differential binding sites centered on functional SNPs. The numbers of SNPs that alter TF binding sites are also in the parentheses. (i, j) Examples of functional SNPs disrupting TF binding sites. (i) The Alt protective allele of rs12275749 (position shown in f) affects the SMAD3 binding site and (j) The Alt risk allele of rs66473811 (position shown in f) is matched with the MAZ binding motif. (k) rs10956415 located within a candidate enhancer region overlapping with ATAC-seq, H3K27ac and H3K4me1 peaks in MCF7 cells. (l) Representative Sanger sequencing results for the rs10956415 locus in unedited MCF7 cells and a PE edited clone. (m) Allele frequencies of alternative (A) and reference (C) alleles of rs10956415 in unedited MCF7 cells and PE edited clones. (n) Relative MYC expression in control clones and PE edited clones (P = 2.73 × 10⁻⁸, two-tailed two-sample t-test).
Fig 4.
Fig 4.. Functional clinical variants identified using PRIME.
(a) Functional clinical variants (red) with either a positive or a negative impact on cell growth were determined by relative effects on cell fitness between Alt and Ref alleles. Blue dots represent significant iSTOPs, and black dots represent negative controls. The red dashed line indicates 5% FDR. (b) Effect sizes of identified functional iSTOPs and clinical variants are larger than that of negative controls (P values were calculated by two-tailed two-sample t-test). Box plots indicate the median, IQR, Q1 − 1.5 × IQR, and Q3 + 1.5 × IQR. Red dots indicate the mean. (c) CADD scores for iSTOPs and clinical variants. (d) Number of identified functional VUS causing each amino acid group transition. (N, Nonpolar; P, Polar; Pc, Positively charged; Nc, Negatively charged). (e,f) Lollipop plots of functional VUS in RAD51C and BARD1 mapped to their canonical isoforms. The identified significant VUSs are labeled in red. Their effects on cell growth are indicated by fold changes. (g,h) Lollipop plots of the nonsense variants in BRCA1 and BRCA2 mapped to their canonical isoforms. The identified significant hits are labeled in blue. Their effects on cell growth are indicated by fold changes.

References

    1. Taliun D. et al. Sequencing of 53,831 diverse genomes from the NHLBI TOPMed Program. Nature 590, 290–299 (2021). - PMC - PubMed
    1. Shalem O., Sanjana N.E. & Zhang F. High-throughput functional genomics using CRISPR-Cas9. Nat Rev Genet 16, 299–311 (2015). - PMC - PubMed
    1. Anzalone A.V., Koblan L.W. & Liu D.R. Genome editing with CRISPR-Cas nucleases, base editors, transposases and prime editors. Nat Biotechnol 38, 824–844 (2020). - PubMed
    1. Chen P.J. & Liu D.R. Prime editing for precise and highly versatile genome manipulation. Nat Rev Genet (2022). - PMC - PubMed
    1. Anzalone A.V. et al. Search-and-replace genome editing without double-strand breaks or donor DNA. Nature 576, 149–157 (2019). - PMC - PubMed

Publication types