[Preprint]. 2023 Jul 11:2023.07.10.548451.
doi: 10.1101/2023.07.10.548451.

Integrated single-cell multiomics uncovers foundational regulatory mechanisms of lens development and pathology

Affiliations

Integrated single-cell multiomics uncovers foundational regulatory mechanisms of lens development and pathology

Jared A Tangeman et al. bioRxiv. .

Update in

Abstract

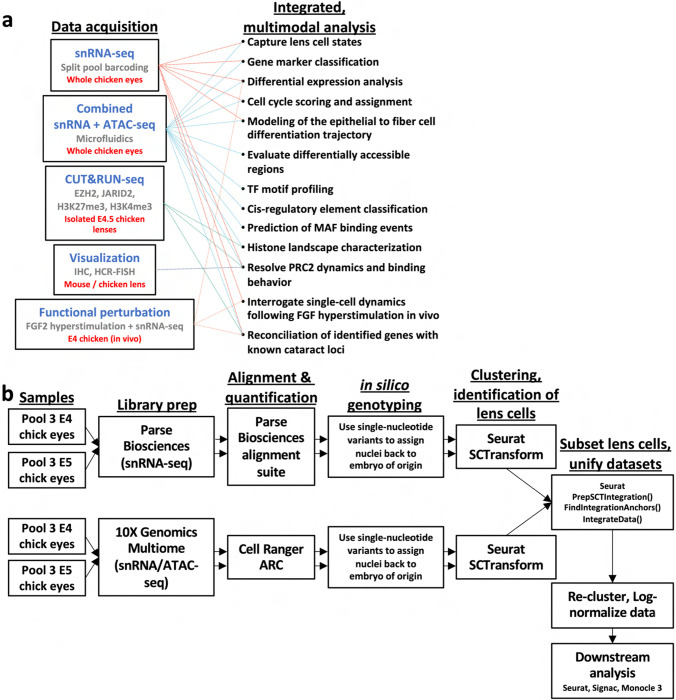
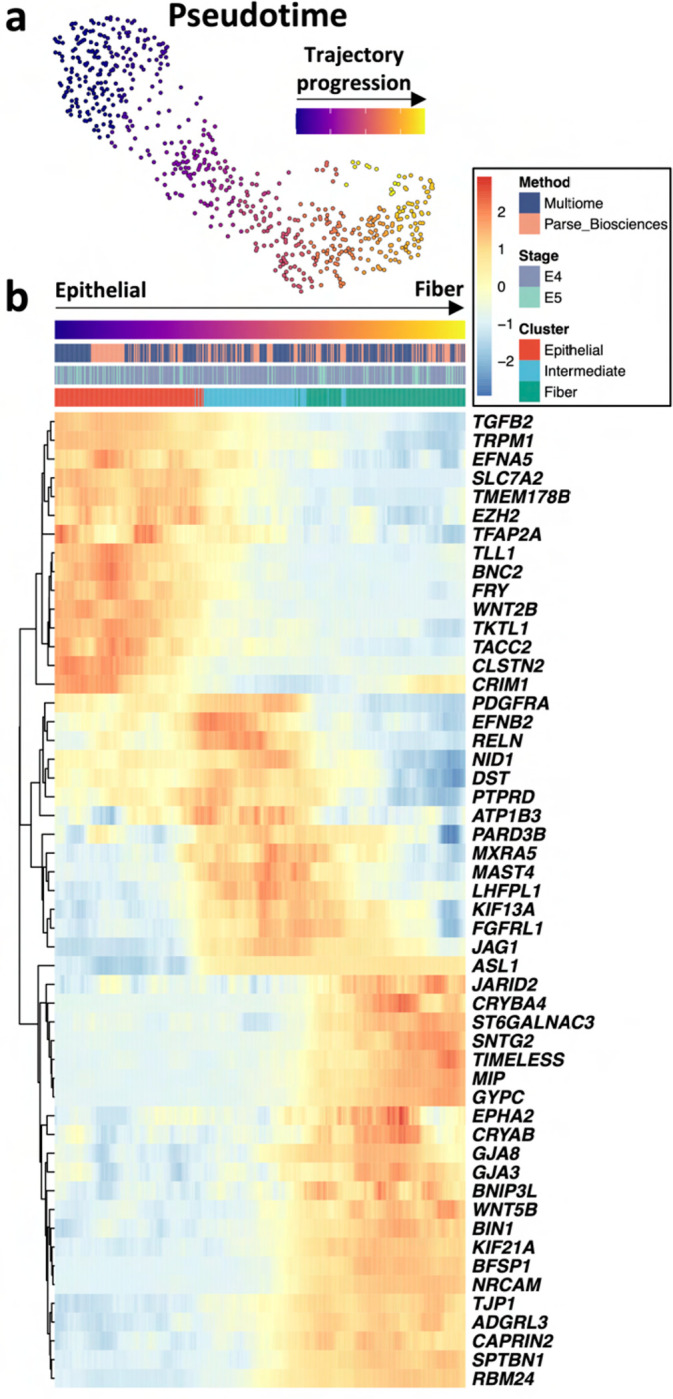
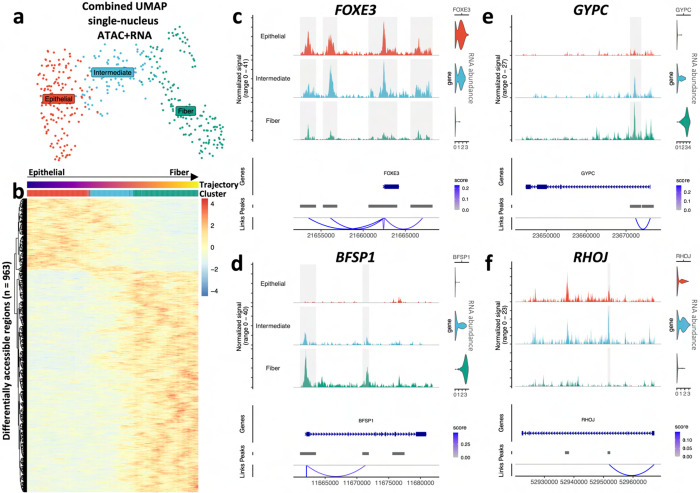
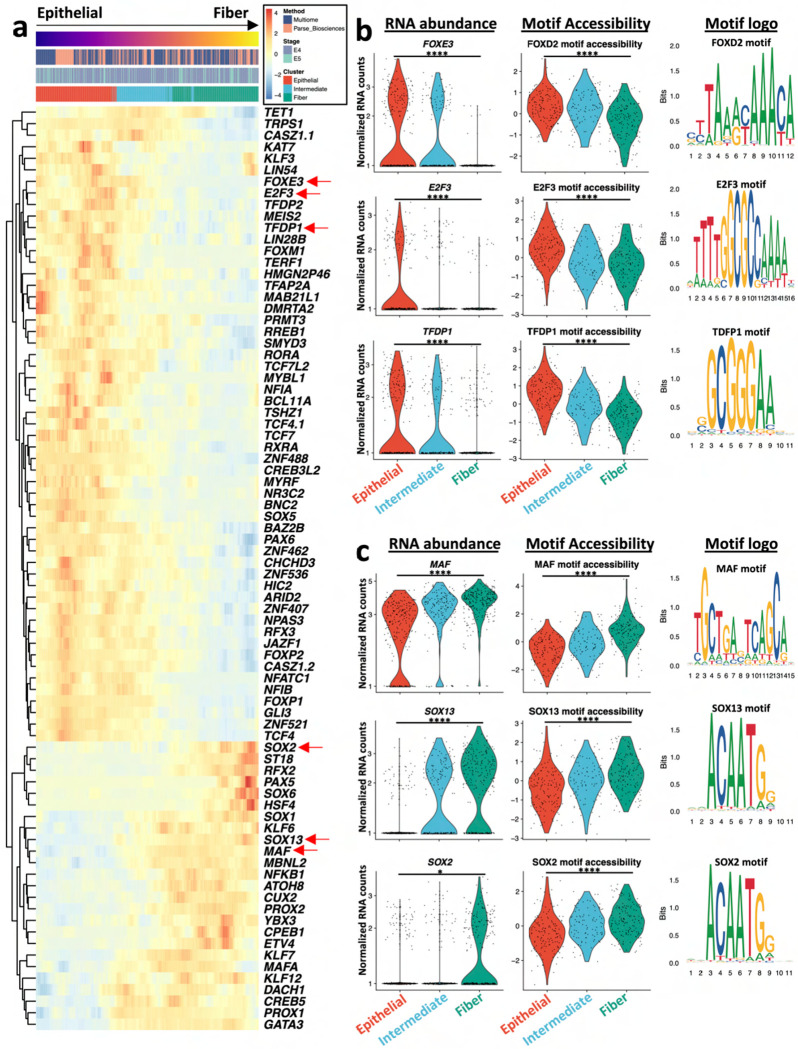
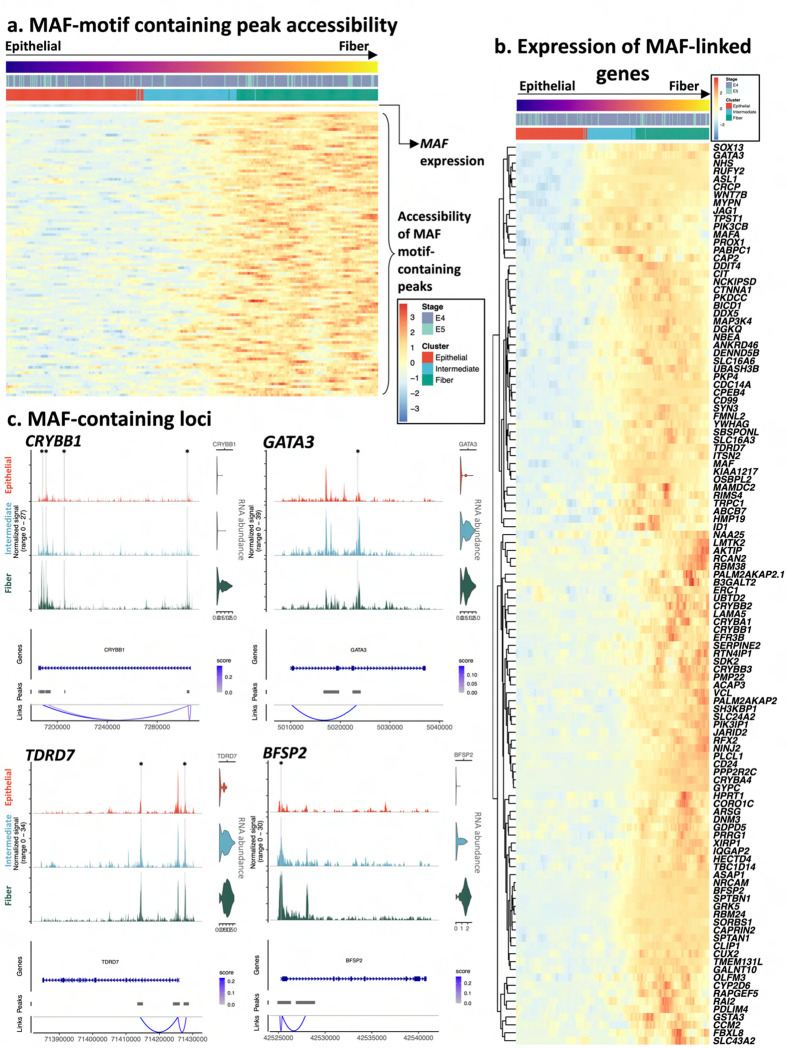
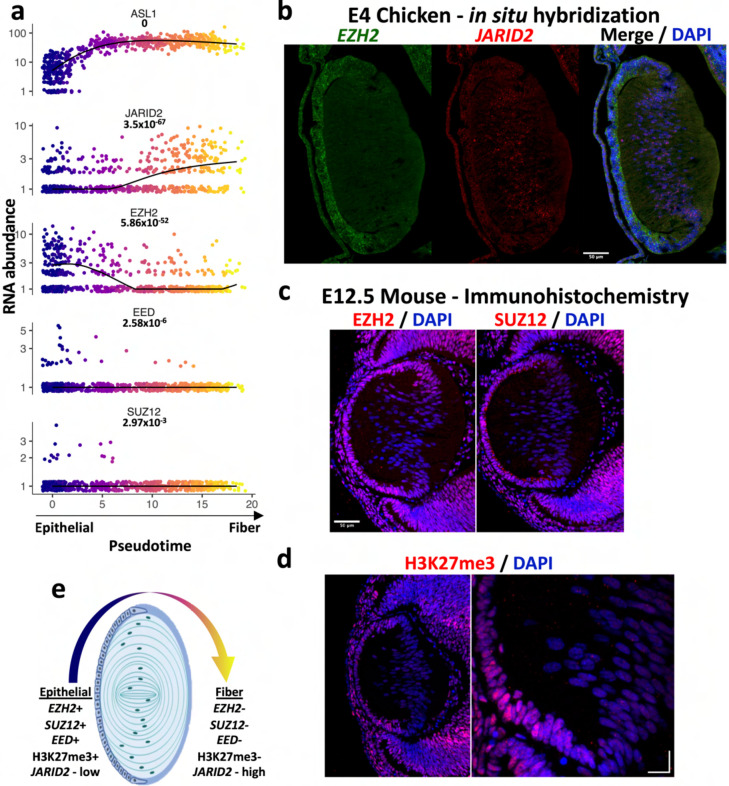
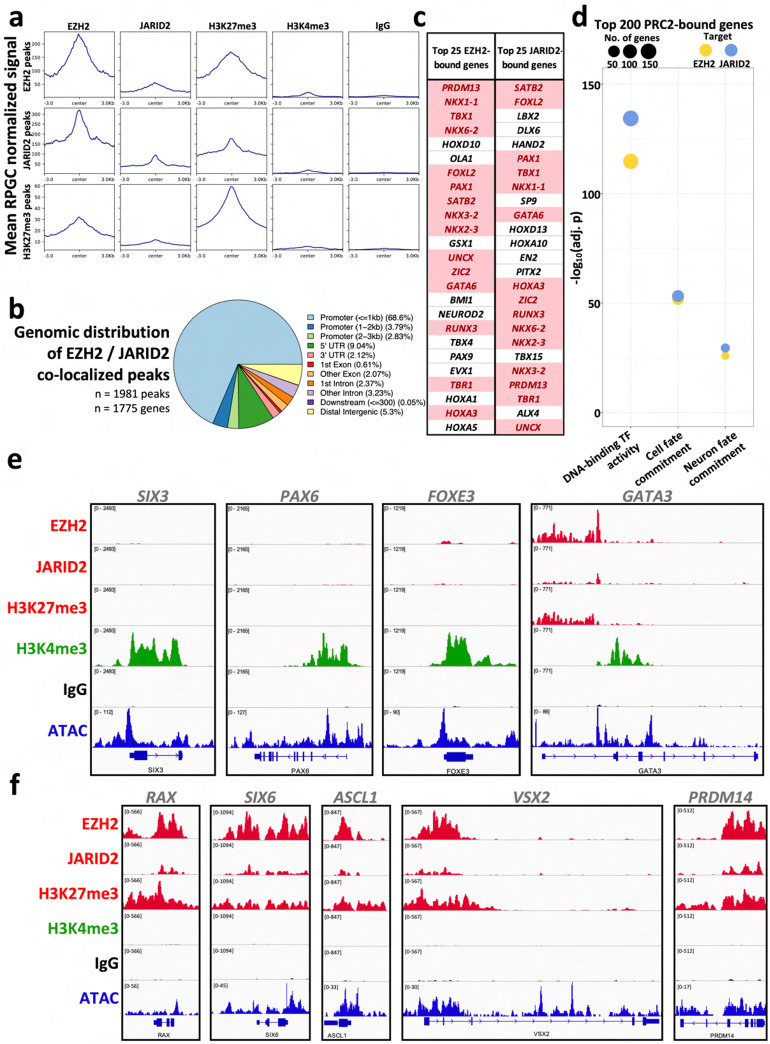
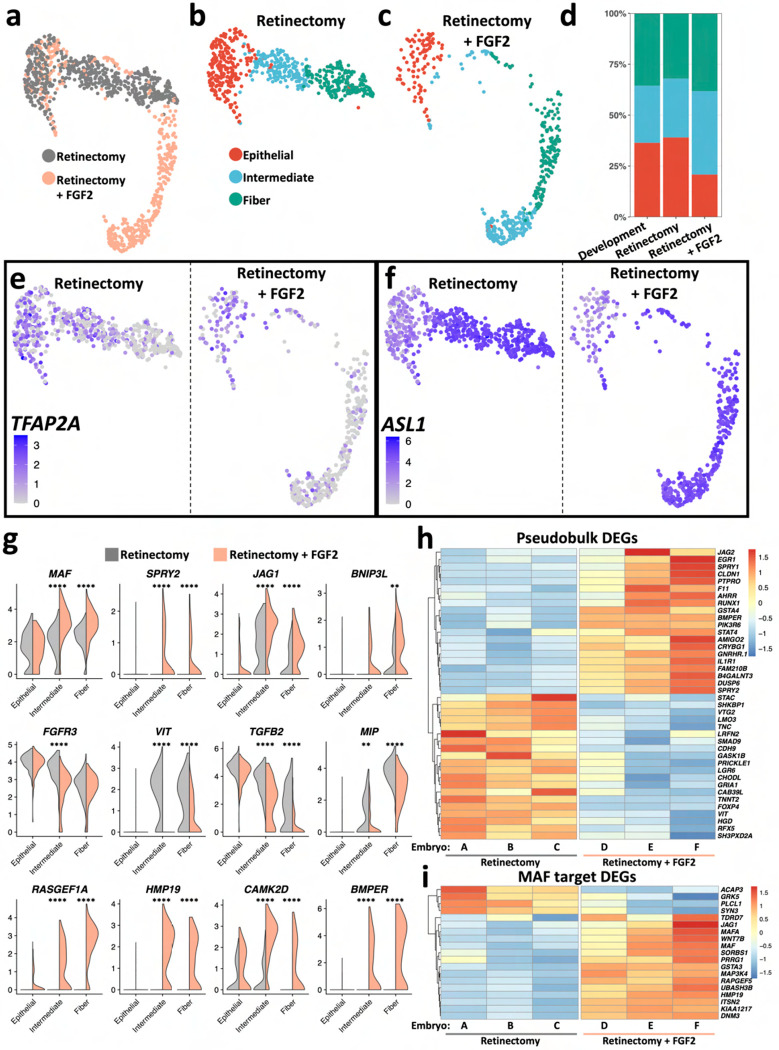
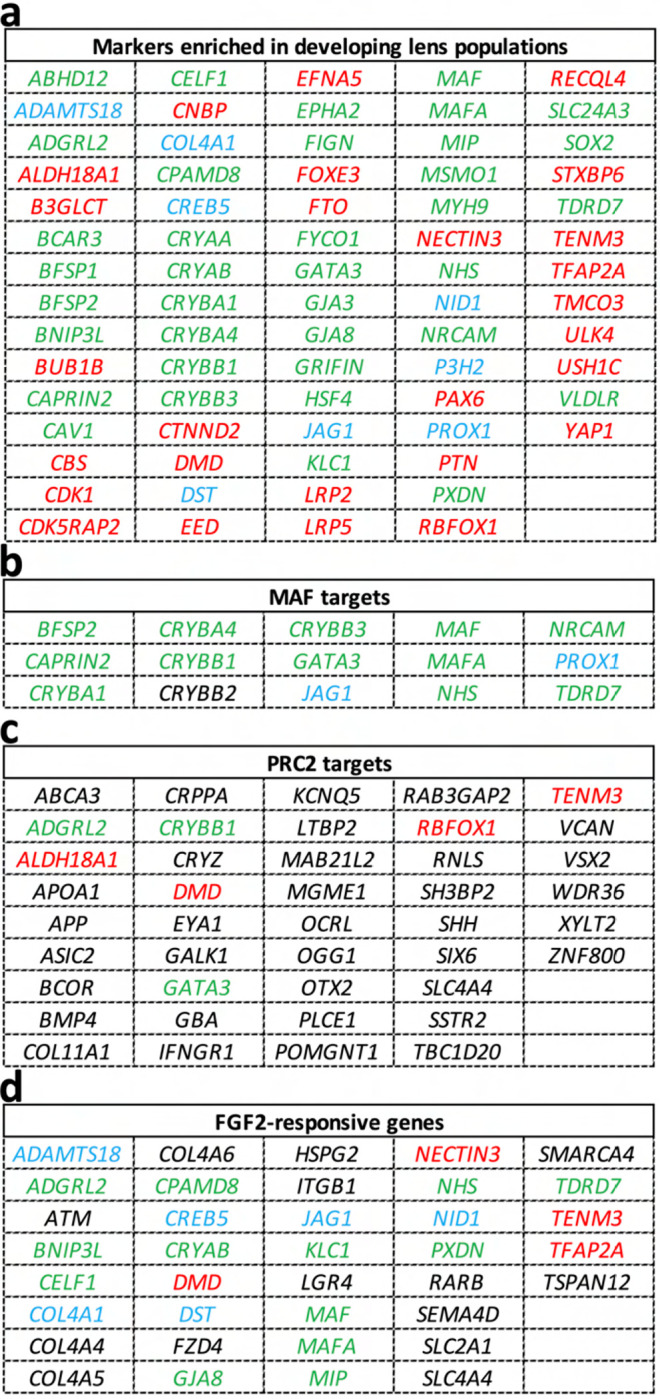
Ocular lens development entails epithelial to fiber cell differentiation, defects in which cause congenital cataract. We report the first single-cell multiomic atlas of lens development, leveraging snRNA-seq, snATAC-seq, and CUT&RUN-seq to discover novel mechanisms of cell fate determination and cataract-linked regulatory networks. A comprehensive profile of cis- and trans-regulatory interactions, including for the cataract-linked transcription factor MAF, is established across a temporal trajectory of fiber cell differentiation. Further, we divulge a conserved epigenetic paradigm of cellular differentiation, defined by progressive loss of H3K27 methylation writer Polycomb repressive complex 2 (PRC2). PRC2 localizes to heterochromatin domains across master-regulator transcription factor gene bodies, suggesting it safeguards epithelial cell fate. Moreover, we demonstrate that FGF hyper-stimulation in vivo leads to MAF network activation and the emergence of novel lens cell states. Collectively, these data depict a comprehensive portrait of lens fiber cell differentiation, while defining regulatory effectors of cell identity and cataract formation.


Conflict of interest statement

Competing Interests The authors declare no competing interests.

Figures

Fig. 1.
Fig. 1.. Experimental overview.
(a): Schematic outlines the major methodology and analysis employed to capture an integrated, multimodal portrait of lens development. IHC = immunohistochemistry; HCR-FISH = Hybridization Chain Reaction-Fluorescent In-Situ Hybridization; TF = Transcription Factor. (b): Workflow summarizes major steps in the generation of single-nuclei libraries, as well as the initial processing of snRNA-seq data and identification of lens cells.
Fig. 2.
Fig. 2.. Single-nucleus profiling of the chick lens.
(a) UMAP feature plot displays ASL1 transcript abundance, in log-normalized gene counts, in nuclei collected from the whole eye of developing chicken embryos. (b) Lens nuclei were subset and re-clustered, revealing 3 major cell states. Cells are colored by ASL1 RNA abundance, cluster, stage, or cell cycle phase. (c) Violin plots display the distribution of log-normalized RNA abundance for genes related to epithelial (on the left) or fiber cell identity (on the right). Adjusted p-values above violin plots represent gene marker enrichment, calculated via Wilcoxon Rank Sum test applied to each cluster relative to other two cell populations. (d): Pathway enrichment summarizes major biological functions associated with marker genes for each cluster.
Fig. 3.
Fig. 3.. An inferred temporal map of epithelial to fiber cell differentiation.
(a): UMAP displays lens nuclei color-coded by pseudotime value. (b): Heatmap displays the expression of select gene markers for epithelial, intermediate, or fiber cell identity along the inferred differentiation trajectory.
Fig. 4.
Fig. 4.. Cis-regulatory modules of the lens differentiation program.
(a): UMAP generated from weighted nearest neighbor analysis of RNA and ATAC profiles of lens nuclei. (b): Row-normalized ATAC signal within differentially accessible regions are displayed across the pseudotime trajectory. (c-f): Genome browsers display accessibility signal plotted across the loci of marker genes for each subcluster. The structure of the gene body is indicated by blue bars, with thick regions corresponding to exons, and arrows oriented toward direction of coding sequence. Link tracks on bottom display predicted looping interactions between peak regions and transcription start sites. The links are colored by the link score, which corresponds to the strength of the predicted association between accessibility and expression. Accessible peak regions linked to transcription are highlighted. Normalized RNA abundance for each gene is displayed in violin plots on right. Numbers along the bottom of each panel are genomic coordinates.
Fig. 5.
Fig. 5.. Global chromatin footprints imparted by the trans-effectors of epithelial vs. fiber cell identity.
(a): Trans-effectors of the lens differentiation program. Heatmap displays pseudotemporal regulatory expression patterns of a manually curated list of transcription factor-encoding genes regulated during lens fiber cell differentiation. (b): Left violin plots display log-normalized RNA abundance for genes down-regulated in fiber cells within each cell population. Right violin plots display the chromVAR enrichment scores for the cognate motif within accessible peak regions. Motifs are derived from the JASPAR database. (c): Same as B but displaying genes up-regulated in fiber cells. Asterisk (*) denotes adjusted p-value < 0.05; (****) denotes adjusted p < 0.00005; calculated via Wilcoxon Rank Sum test comparing Epithelial vs. Fiber clusters.
Fig. 6.
Fig. 6.. Derivation of the MAF regulatory network.
(a): Top row of row-normalized heatmap displays RNA abundance of MAF RNA transcripts across the pseudotime trajectory. Rows below display accessibility of MAF motif-containing loci linked to nearby changes in transcription. (b): The RNA abundances of MAF-linked genes are shown. (c): The loci of genes containing MAF-linked peaks are displayed, with MAF motif-containing peaks highlighted and marked by an asterisk. Accessibility signal is plotted across the loci. The structure of the gene body is indicated by blue bars, with thick regions corresponding to exons, and arrows oriented toward direction of coding sequence. Link tracks on bottom display predicted looping interactions between peak regions and transcription start sites. The links are colored by the link score, which corresponds to the strength of the predicted association between accessibility and expression. Normalized RNA abundance for each gene is displayed in violin plots on right. Numbers along the bottom of each subpanel are genomic coordinates.
Fig. 7.
Fig. 7.. PRC2 dynamics constitute an epigenetic program of fiber cell differentiation.
(a): The expression of genes encoding PRC2 complex subunits are altered throughout the chick lens fiber cell differentiation program. Nuclei are ordered by pseudotime on the x-axis, and the black line represents the expression trend. Adjusted p-values displayed calculated via Moran’s I test using principal graph. (b): FISH-HCR is used to visualize changes in localization of EZH2 and JARID2 transcripts in E4 (HH23–24) chick embryos. Scale bar is 50 μm. (c): Immunohistochemistry performed on E12 mouse sections show loss of PRC2 members during fiber cell differentiation. Scale bar is 50 μm. (d): H3K27me3 is lost from differentiating mouse fiber cells. Scale bar from C applies to left image. Right image scale bar is 15 μm. (e): Schematic summarizes changes in PRC2 complex members.
Fig. 8.
Fig. 8.. Localization of PRC2 members and histone modifications in the E4.5 chicken lens.
CUT&RUN-seq was performed using antibodies against EZH2, JARID2, H3K27me3, H3K4me3, and IgG control. (a): Average signal was plotted for the top 1000 peaks identified for EZH2, JARID2, and H3K27me3, revealing a high degree of co-localization between the targets. (b): The genomic distribution is displayed for loci co-bound by EZH2 and JARID2, showing predominantly promoter and genic localization. (c): Top 25 genes displaying the highest signal for EZH2 and JARID2 are displayed. Duplicated values highlighted in red. (d): Bubble chart summarizes pathway enrichment results performed on top 200 genes bound by EZH2 and JARID2. (e): Genome browsers display RPGC-normalized (reads per genomic content-normalized) signal for CUT&RUN targets across select loci, as well as aggregate ATAC signal from the snATAC-seq dataset. (f): Genome browsers display RPGC-normalized CUT&RUN signal across PRC2-marked loci. Signal ranges are equally scaled for CUT&RUN targets and displayed in top left of each track.
Fig. 9.
Fig. 9.. The FGF2-treated lens.
(a): UMAP displays lens nuclei captured via snRNA-seq, performed using chicken eyes 6 hours after retinectomy ± FGF2-coated beads. (b): UMAP displays lens nuclei from the retinectomy-only (control) sample, colored by the predicted cell state when annotated against the development reference dataset. (c): Same as B, for FGF2-treated samples. (d): The proportion of nuclei assigned to each cell state for each condition and compared to the intact (developing) eye. (e): Feature plot displays log-normalized abundance of the epithelial-enriched gene TFAP2A; UMAP is split by condition. (f): Same as (e), but for the fiber-enriched gene ASL1. (g): Violin plots display the distribution of log-normalized transcript abundance for DEGs. ** denotes adjusted p-value < 0.005; **** denotes adjusted p < 0.00005; calculated via Wilcoxon Rank Sum test comparing retinectomy vs. FGF2-treated for each lens cell state. (h): Row-normalized heatmap displays select DEGs, calculated via pseudobulk analysis. Each column corresponds to a single individual (embryo). (i): Same as (h), displaying expression of predicted MAF regulatory targets. All genes in heatmap have adjusted p-value < 0.05.
Fig. 10.
Fig. 10.. Cataract-associated genes.
Tables summarize the genes identified in the current study that are documented in the CAT-MAP database, a repository for cataract-associated genes @ps://cat-map.wustl.edu/. Lists encompass significant marker genes drawn from the developing chicken snRNA-seq dataset (a), genes with regulatory correlation to nearby predicted MAF binding sites (b), genes bound by PRC2 in the developing chick lens (c), and genes with significant regulation in response to FGF2 hyperstimulation (d). Genes are colored according to their enrichment patterns during lens development: Red = Epithelial-enriched; Blue = Intermediate-enriched; Green = Fiber-enriched; Black = Not significantly enriched in a cluster during development, or not expressed.

References

    1. Anand D, Lachke SA. Systems biology of lens development: A paradigm for disease gene discovery in the eye. Exp Eye Res. 2017;156:22–33. doi:10.1016/j.exer.2016.03.010 - DOI - PMC - PubMed
    1. Chauhan BK, Reed NA, Zhang W, Duncan MK, Kilimann MW, Cvekl A. Identification of genes downstream of Pax6 in the mouse lens using cDNA microarrays. J Biol Chem. 2002;277(13):11539–11548. doi:10.1074/jbc.M110531200 - DOI - PubMed
    1. Chauhan BK, Reed NA, Yang Y, et al. A comparative cDNA microarray analysis reveals a spectrum of genes regulated by Pax6 in mouse lens. Genes Cells. 2002;7(12):1267–1283. - PMC - PubMed
    1. Hawse JR, Hejtmancik JF, Huang Q, et al. Identification and functional clustering of global gene expression differences between human age-related cataract and clear lenses. Mol Vis. 2003;9:515–537. - PMC - PubMed
    1. Hawse JR, Hejtmancik JF, Horwitz J, Kantorow M. Identification and functional clustering of global gene expression differences between age-related cataract and clear human lenses and aged human lenses. Exp Eye Res. 2004;79(6):935–940. doi:10.1016/j.exer.2004.04.007 - DOI - PMC - PubMed

Publication types