[Preprint]. 2023 Jul 11:2023.07.11.548536.
doi: 10.1101/2023.07.11.548536.

Patterns of recombination in snakes reveal a tug of war between PRDM9 and promoter-like features

Affiliations

Patterns of recombination in snakes reveal a tug of war between PRDM9 and promoter-like features

Carla Hoge et al. bioRxiv. .

Update in

Abstract

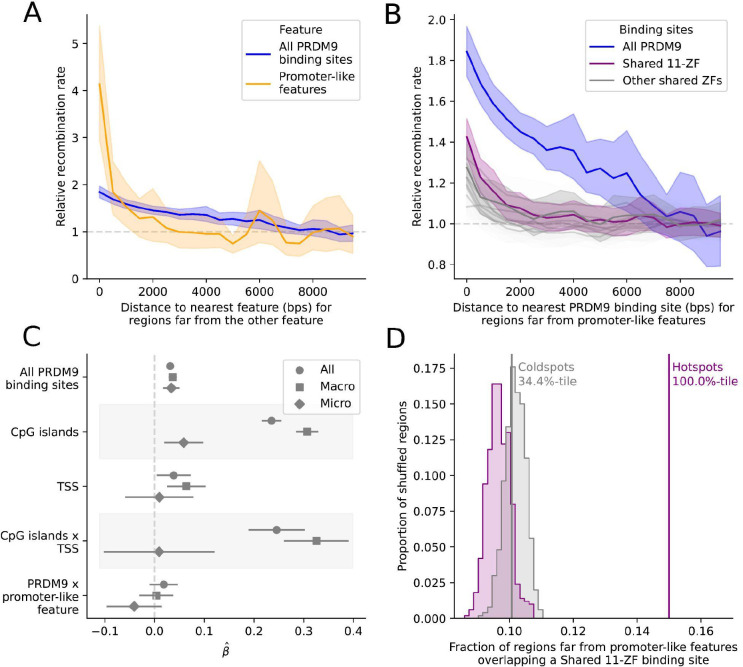
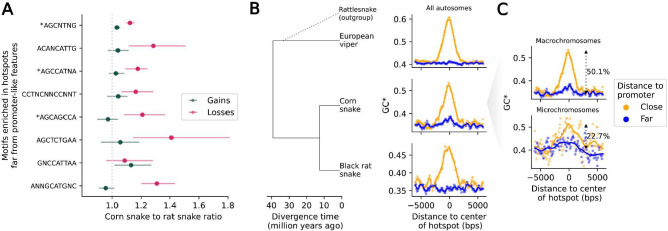
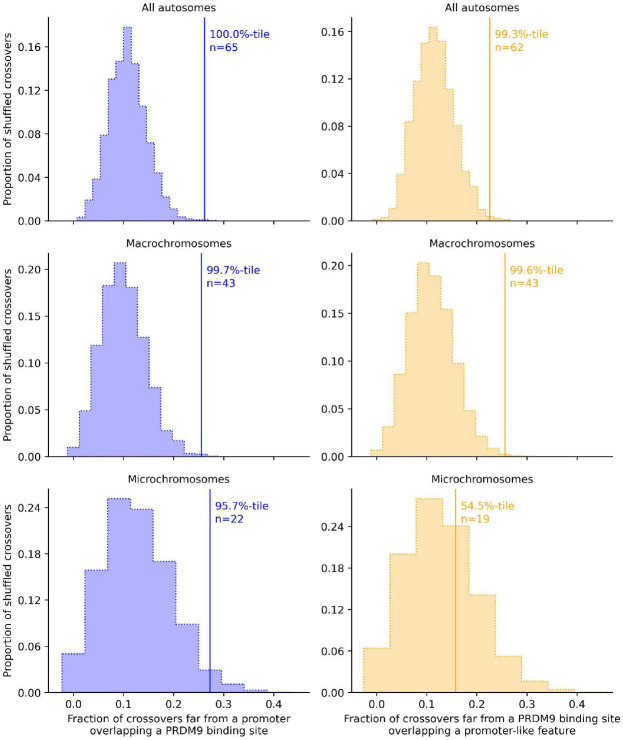
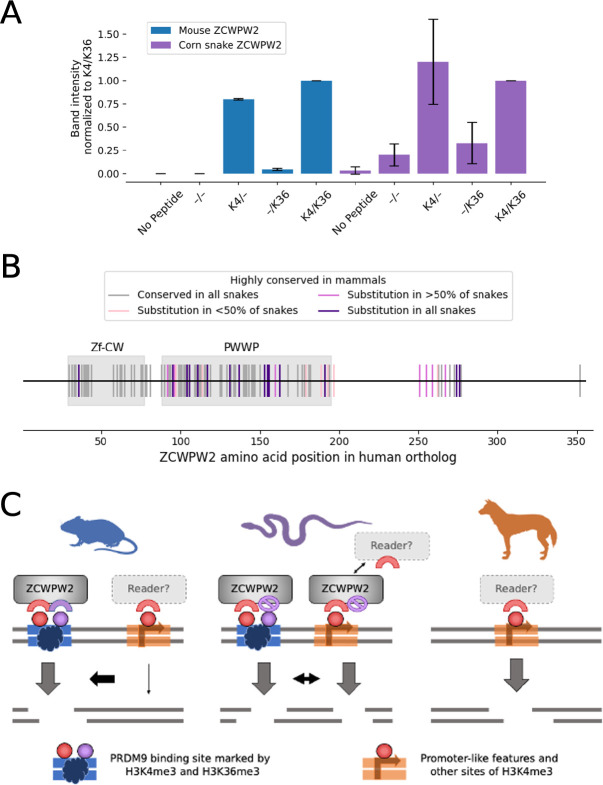
In vertebrates, there are two known mechanisms by which meiotic recombination is directed to the genome: in humans, mice, and other mammals, recombination occurs almost exclusively where the protein PRDM9 binds, while in species lacking an intact PRDM9, such as birds and canids, recombination rates are elevated near promoter-like features. To test if PRDM9 also directs recombination in non-mammalian vertebrates, we focused on an exemplar species, the corn snake (Pantherophis guttatus). Unlike birds, this species possesses a single, intact PRDM9 ortholog. By inferring historical recombination rates along the genome from patterns of linkage disequilibrium and identifying crossovers in pedigrees, we found that PRDM9 specifies the location of recombination events outside of mammals. However, we also detected an independent effect of promoter-like features on recombination, which is more pronounced on macro- than microchromosomes. Thus, our findings reveal that the uses of PRDM9 and promoter-like features are not mutually-exclusive, and instead reflect a tug of war, which varies in strength along the genome and is more lopsided in some species than others.


Conflict of interest statement

Competing interests: Authors declare that they have no competing interests.

Figures

Figure 1:
Figure 1:. Genome sequences of corn snakes and PRDM9 zinc finger alleles in our samples.
A) Sample collection locations for wild-caught individuals are shown for the 19 individuals depicted by a diamond. The number in each diamond indicates the mean fold-coverage of whole genome sequencing. B) The pedigree structures for samples from the colony, also including “unrelated” individuals, indicated with an asterisk. The number in each diamond indicates the mean fold-coverage of genome sequencing. C) PRDM9 zinc finger domain structure for 22 PRDM9 alleles, grouped and aligned by the similarity of their computationally-predicted binding affinity. Zinc fingers with distinct predictions for their binding affinities are shown in different colors; loosely, more similar colors represent zinc fingers with more similar computationally-predicted binding affinities (Figure S3). Each observation of a given allele is shown in the table; gold diamonds indicate wild samples and red diamonds colony samples. If the same allele was identified multiple times in closely related individuals, it is only shown once. The purple box highlights a succession of 11 zinc fingers (Shared 11-ZF) that are shared among five different alleles, including the only allele seen more than twice in the sample, PRDM9-A.
Figure 2:
Figure 2:. An increase in the population recombination rate is seen around both PRDM9 binding sites and promoter-like features.
A) Mean population recombination rate in 100 bp windows as a function of distance to the nearest predicted PRDM9 binding site (blue) or promoter-like feature (orange). When considering one feature, we condition on windows >10 kb from the other feature; thus, when focusing on predicted PRDM9 binding sites, we only consider windows that are >10 kb from promoter-like features (i.e., TSS or CpG island). The recombination rate is relative to the mean rate 8–10 kb away. Shaded regions represent the central 95% confidence interval obtained by bootstrapping (see Methods). B) Mean population recombination in 100 bp windows as a function of distance from predicted binding sites for sets of zinc fingers shared among PRDM9 alleles. This plot is conditional on the windows being far from promoter-like features. The “Shared 11-ZF” allele shared among five PRDM9 alleles is shown in purple and the set of all PRDM9 alleles, equivalent to the curve in (A), is shown in blue. C) Point estimate and 95% CI for the coefficients of a linear model, in which the response variable is the (log) recombination rate in 1 kb windows (thinned to be 10 kb apart) and the predictors are the (binary) presence or absence of one or more predicted PRDM9 binding sites, TSS, or CpG islands. Covariates include the background recombination rate (1 Mb scale) and GC content (see Methods). Results are reported for data from the autosomes (circles), only scaffolds assigned to macrochromosomes (squares), and only microchromosomes (diamonds). D) Overlap of hotspots (purple) and matched coldspots (gray) far from a promoter-like feature with the predicted binding sites for the Shared 11-ZF allele. The observed values are shown with solid lines. The overlap expected by chance is shown with the shaded distribution and is based on 500 replicates, in which each hotspot was placed at random within 5 Mb of the original location conditional on there not being a gap in the genome sequence (see Methods). We note that while hotspots and coldspots are matched for base composition (see Methods), that need no longer be the case once we condition on them laying far from a promoter-like feature, driving the slight difference between the null distributions.
Figure 3:
Figure 3:. Footprints of recombination in divergence data.
A) The ratio of losses in the corn snake lineage relative to the black rat snake (in magenta) and the ratio of gains in the corn snake lineage relative to the black rat snake (in green), for motifs enriched in recombination hotspots far from promoter-like features (>10 kb), ordered by motif enrichment significance (top to bottom). The 95% confidence intervals are obtained by bootstrapping over 5 Mb regions with at least one gain or loss event in either of the two lineages. B) Increased flux to GC (GC*) as a function of distance from corn snake autosomal hotspots, in sliding windows of 500 bp with a 100 bp offset, for the lineages leading to European viper (top), corn snake (middle) and black rat snake (bottom). Note that rattlesnakes, a sister species to European viper, were included only to infer the ancestral state in substitutions (see Methods). GC* around hotspots that are close (<500 bp) to a promoter-like feature (orange) and far from any promoter-like feature (blue) are shown. Local regression curves are shown for a span of 0.05. C) GC* in the lineage leading to corn snakes, for hotspots in macro- (top) and microchromosomes (bottom), using the same color scheme as in B. Local regression curves are shown for a span of 0.05 and 0.2 in macro- and microchromosomes, respectively. The percentage increase in the mean GC* for sites >3 kb away from the center of the hotspot relative to that within 200 bps of the center are shown.
Figure 4:
Figure 4:. Crossovers identified from pedigree resequencing overlap both predicted PRDM9 binding sites and promoter-like features significantly more often than expected by chance in corn snakes.
Shown is the overlap for crossovers resolved to within 5 kb. In the first column (blue) is the overlap of crossovers with the predicted binding sites of the PRDM9 alleles carried by the parent in which the crossover is inferred to have occurred, for binding sites far from a promoter-like feature (>10 kb). In the second column (orange) is the overlap of crossovers with promoter-like features far (>10kb) from the PRDM9 binding sites of alleles carried by the parents. The solid line is the observed overlap for the subset of crossovers, n, that satisfy the criteria. The frequency distribution represents the overlap for 3000 sets of simulated crossovers obtained by placing the observed interval lengths down at random within 5 Mb of the original crossover interval, conditional on it containing at least two informative markers and there not being a gap in the genome sequence at that location (see Methods). The rank of the observation relative to realizations under the null is given as a percentile (47). The three rows present results for all scaffolds, only those assigned to macrochromosomes and only those assigned to microchromosomes (see Methods).
Figure 5
Figure 5. Possible role for ZCWPW2 in the tug of war between promoter-like features and PRDM9.
A) In vitro binding affinity of mouse (blue) and snake (purple) ZCWPW2 for histone peptides methylated with H3K4me3 (K4) and H3K36me3 (K36). Plotted are the band intensities of mouse and snake HA-tagged ZCWPW2 in Western Blotting following H3-peptide pull-down (see Methods). For each experimental replicate, the band intensities were normalized to the band intensity of Zcwpw2 pulled down using the K4/K36 labeled peptide. The experiment was performed once using corn-snake Zcwpw2-HA alone, and twice using both mouse and corn-snake Zcwpw2-HA. Whiskers denote two standard deviations. B) Conservation of ZCWPW2 amino acids among 137 mammalian and nine snake species. Each tick mark denotes a site at which >95% mammals carry the same amino acid. Amino acids shown as gray ticks are completely conserved in the nine snakes; pink are conserved in all but 1–4 snakes, maroon are changed in 5–8 snakes, and purple amino acids are changed in all 9 snakes. Of the 20 sites in the Zf-CW domain that are highly conserved in mammals, there is a substitution in all snakes at 1 site (5%), whereas of 58 such sites in the PWWP, 12 (21%) have changed in all snakes. C) Proposed schema by which decreased binding affinity of ZCWPW2 to H3K4me36 in snakes could lead to DSBs and resulting crossovers at both PRDM9 binding sites and promoter-like features, in contrast to their mutually exclusive use in mammals studied to date.

References

    1. de Massy B., Initiation of meiotic recombination: how and where? Conservation and specificities among eukaryotes. Annu. Rev. Genet. 47, 563–599 (2013). - PubMed
    1. Baudat F., Buard J., Grey C., Fledel-Alon A., Ober C., Przeworski M., Coop G., de Massy B., PRDM9 is a major determinant of meiotic recombination hotspots in humans and mice. Science. 327, 836–840 (2010). - PMC - PubMed
    1. Myers S., Bowden R., Tumian A., Bontrop R. E., Freeman C., MacFie T. S., McVean G., Donnelly P., Drive against hotspot motifs in primates implicates the PRDM9 gene in meiotic recombination. Science. 327, 876–879 (2010). - PMC - PubMed
    1. Zhou Y., Shen B., Jiang J., Padhi A., Park K.-E., Oswalt A., Sattler C. G., Telugu B. P., Chen H., Cole J. B., Liu G. E., Ma L., Construction of PRDM9 allele-specific recombination maps in cattle using large-scale pedigree analysis and genome-wide single sperm genomics. DNA Res. 25, 183–194 (2018). - PMC - PubMed
    1. Stevison L. S., Woerner A. E., Kidd J. M., Kelley J. L., Veeramah K. R., McManus K. F., Great Ape Genome Project, C. D. Bustamante, M. F. Hammer, J. D. Wall, The Time Scale of Recombination Rate Evolution in Great Apes. Mol. Biol. Evol. 33, 928–945 (2016). - PMC - PubMed

Publication types