[Preprint]. 2023 Oct 4:2023.07.14.23292668.
doi: 10.1101/2023.07.14.23292668.

The genetic diversity of Nipah virus across spatial scales

Affiliations

The genetic diversity of Nipah virus across spatial scales

Oscar Cortés Azuero et al. medRxiv. .

Update in

  • The Genetic Diversity of Nipah Virus Across Spatial Scales.
    Cortes-Azuero O, Lefrancq N, Nikolay B, McKee C, Cappelle J, Hul V, Ou TP, Hoem T, Lemey P, Rahman MZ, Islam A, Gurley ES, Duong V, Salje H. Cortes-Azuero O, et al. J Infect Dis. 2024 Dec 16;230(6):e1235-e1244. doi: 10.1093/infdis/jiae221. J Infect Dis. 2024. PMID: 38682164 Free PMC article.

Abstract

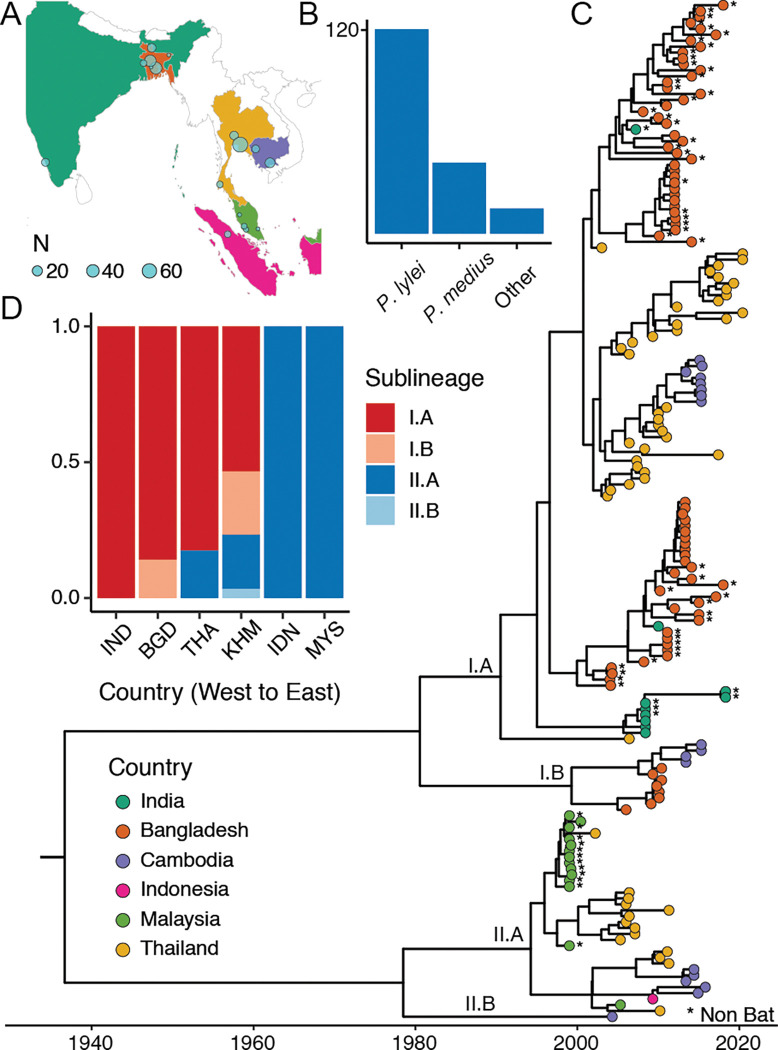
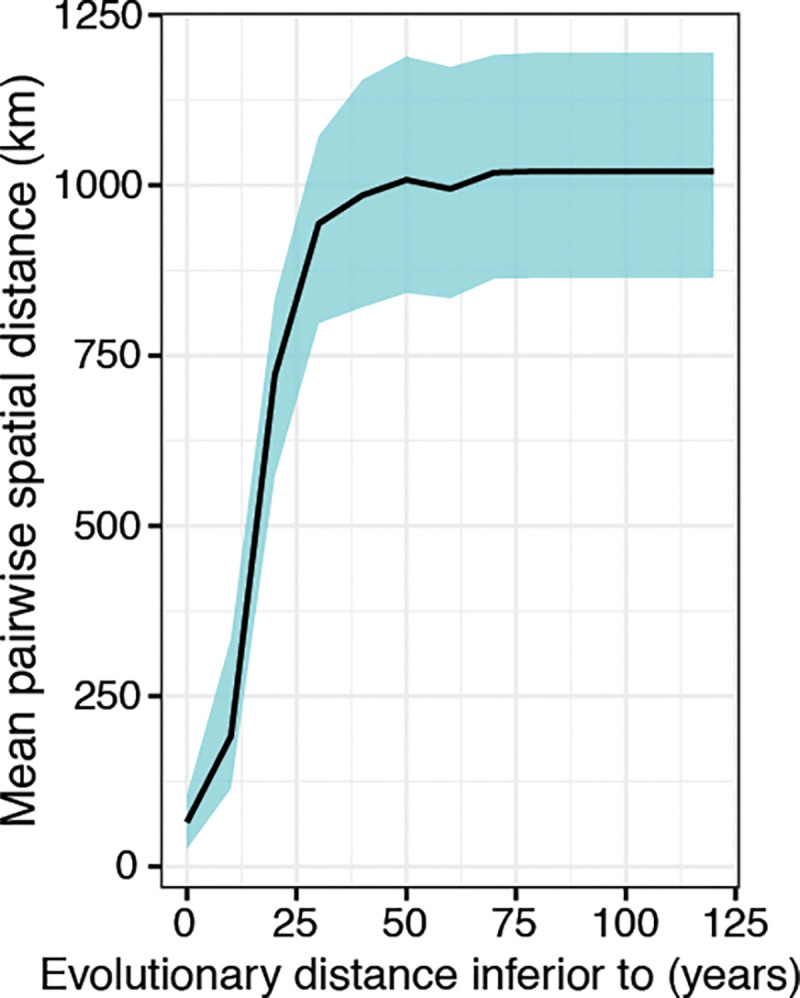
Nipah virus (NiV), a highly lethal virus in humans, circulates silently in Pteropus bats throughout South and Southeast Asia. Difficulty in obtaining genomes from bats means we have a poor understanding of NiV diversity, including how many lineages circulate within a roost and the spread of NiV over increasing spatial scales. Here we develop phylogenetic approaches applied to the most comprehensive collection of genomes to date (N=257, 175 from bats, 73 from humans) from six countries over 22 years (1999-2020). In Bangladesh, where most human infections occur, we find evidence of increased spillover risk from one of the two co-circulating sublineages. We divide the four major NiV sublineages into 15 genetic clusters (emerged 20-44 years ago). Within any bat roost, there are an average of 2.4 co-circulating genetic clusters, rising to 5.5 clusters at areas of 1,500-2,000 km2. Using Approximate Bayesian Computation fit to a spatial signature of viral diversity, we estimate that each genetic cluster occupies an average area of 1.3 million km2 (95%CI: 0.6-2.3 million), with 14 clusters in an area of 100,000 km2 (95%CI: 6-24). In the few sites in Bangladesh and Cambodia where genomic surveillance has been concentrated, we estimate that most of the genetic clusters have been identified, but only ~15% of overall NiV diversity has been uncovered. Our findings are consistent with entrenched co-circulation of distinct lineages, even within individual roosts, coupled with slow migration over larger spatial scales.


Figures

Figure 1:
Figure 1:
(A) Country of origin sequences. (B) Distribution of host species for sequences coming from bats (N=175). (C) Reconstructed time resolved Maximum Clade Credibility phylogeny with tips coloured with country of origin and non-bat sequences are marked with an asterisk. (D) Sublineage distribution per country.
Figure 2:
Figure 2:
Mean pairwise spatial distance (in km) in function of pairwise evolutionary distance (in years).
Figure 3:
Figure 3:
(A) Spatial distribution of identified lineages for bats. Each line represents the proportion of sequences coming from a specific country for the corresponding genetic cluster. (B) Bat host species distribution of lineages. (C) Distribution of bat host species per country. (D) Time-resolved phylogeny divided into fifteen distinct clades using an adapted form of PhyCLIP. (E) Proportion of sequence pairs belonging to the same cluster as a function of their spatial distance. The green shaded region represents 95% confidence intervals. (F) Odds ratio of belonging to the same genetic cluster if sequence pairs were sampled from the same bat host species or not. The error bar represents 95% confidence intervals.
Figure 4:
Figure 4:
(A) Model fit using Approximate Bayesian Computation (ABC) on the proportion of sequence pairs that belong to the same genetic cluster in function of their spatial distance. The orange dots represent the median and the lines represent the 95% confidence intervals. Median proportions calculated on NiV data and used to calibrate the model are represented in blue. (B) Predicted number of genetic clusters in function of area (in square kilometers). The points and bars represent estimates of diversity for specific areas with 95% confidence intervals. (C) Estimated number of clusters in function of number of sampled NiV sequences for six regions in South and Southeast Asia. The dots represent the current number of observed samples and clusters in each region, the solid lines represent interpolated values based on observed data, and the dashed lines represent extrapolated values using Hill numbers of order 0.

References

    1. World Health Organization, NIPAH RESEARCH AND DEVELOPMENT (R&D) ROADMAP (2019) (available at https://cdn.who.int/media/docs/default-source/blue-print/nipah_rdbluepri...)
    1. Nikolay B., Salje H., Hossain M. J., Khan A. K. M. D., Sazzad H. M. S., Rahman M., Daszak P., Ströher U., Pulliam J. R. C., Kilpatrick A. M., Nichol S. T., Klena J. D., Sultana S., Afroj S., Luby S. P., Cauchemez S., Gurley E. S., Transmission of Nipah Virus - 14 Years of Investigations in Bangladesh. N. Engl. J. Med. 380, 1804–1814 (2019). - PMC - PubMed
    1. Plowright R. K., Becker D. J., Crowley D. E., Washburne A. D., Huang T., Nameer P. O., Gurley E. S., Han B. A., Prioritizing surveillance of Nipah virus in India. PLoS Negl. Trop. Dis. 13, e0007393 (2019). - PMC - PubMed
    1. Soman Pillai V., Krishna G., Valiya Veettil M., Nipah Virus: Past Outbreaks and Future Containment. Viruses 12 (2020), doi:10.3390/v12040465. - DOI - PMC - PubMed
    1. Lo M. K., Lowe L., Hummel K. B., Sazzad H. M. S., Gurley E. S., Hossain M. J., Luby S. P., Miller D. M., Comer J. A., Rollin P. E., Bellini W. J., Rota P. A., Characterization of Nipah virus from outbreaks in Bangladesh, 2008–2010. Emerg. Infect. Dis. 18, 248–255 (2012). - PMC - PubMed

Publication types