[Preprint]. 2024 Feb 18:2023.07.13.548836.
doi: 10.1101/2023.07.13.548836.

Regression and Alignment for Functional Data and Network Topology

Affiliations

Regression and Alignment for Functional Data and Network Topology

Danni Tu et al. bioRxiv. .

Update in

Abstract

In the brain, functional connections form a network whose topological organization can be described by graph-theoretic network diagnostics. These include characterizations of the community structure, such as modularity and participation coefficient, which have been shown to change over the course of childhood and adolescence. To investigate if such changes in the functional network are associated with changes in cognitive performance during development, network studies often rely on an arbitrary choice of pre-processing parameters, in particular the proportional threshold of network edges. Because the choice of parameter can impact the value of the network diagnostic, and therefore downstream conclusions, we propose to circumvent that choice by conceptualizing the network diagnostic as a function of the parameter. As opposed to a single value, a network diagnostic curve describes the connectome topology at multiple scales-from the sparsest group of the strongest edges to the entire edge set. To relate these curves to executive function and other covariates, we use scalar-on-function regression, which is more flexible than previous functional data-based models used in network neuroscience. We then consider how systematic differences between networks can manifest in misalignment of diagnostic curves, and consequently propose a supervised curve alignment method that incorporates auxiliary information from other variables. Our algorithm performs both functional regression and alignment via an iterative, penalized, and nonlinear likelihood optimization. The illustrated method has the potential to improve the interpretability and generalizability of neuroscience studies where the goal is to study heterogeneity among a mixture of function- and scalar-valued measures.

Keywords: Alignment; Functional Data Analysis; Functional Regression; Network Neuroscience.


Conflict of interest statement

Conflict of Interest: None declared.

Figures

Fig. 1.
Fig. 1.
Network diagnostic curves represent graph topology at multiple scales. For any adjacency matrix, the threshold t0,1 represents the proportion of strongest edges to keep, which defines a sparser weighted network. When t=0, the resulting network is the set of disconnected nodes. As t increases, edges are added to those nodes in decreasing order of strength. For each network, various network diagnostics describing the topology of edge connections can be evaluated (e.g., modularity and participation coefficient). Therefore, calculating the network diagnostic at multiple values of t0,1 results in a network diagnostic curve.
Fig. 2.
Fig. 2.
Forms of variation in functional data. Left: For network diagnostic curves that are functions of t, amplitude variation refers to differences in the vertical distance between curves at fixed values of t. Right: For curves with similar features, phase variation manifests as differences in the “timing” of those features, i.e., horizontal misalignment.
Fig. 3.
Fig. 3.
In simulated data, alignment improves the accuracy of model coefficient estimation beyond using the unwarped curves, and towards the scenario where the true curves are known. The data generating mechanism consisted of a set of true β1t and β2t functions describing the association between the true aligned curves and z and y, respectively, where sinusoidal noise (Panel A) and Gaussian noise (Panel B) were added to the functions to induce amplitude variation. This process was repeated for curves with added sinusoidal noise (Panel C) and Gaussian noise (Panel D) under a different set of true β1t and β2t functions. For the supervised alignment methods, the tuning parameters λ1, λ2 were chosen in that order, and using the automated method in 2.6.1. Performance was assessed using MISE(β2t) and MSE(y). Box-and-whisker plots show the median, 25th, and 75th percentile for the box, and 1.5 ∗ (Interquartile Range) for the whiskers. Overall, we found that RAFT most consistently improved prediction performance, even when the variables z and y were not linearly related (Panels B and D), while the unsupervised FPCA-based method registr worked often but occasionally performed worse than using the unwarped curves, likely due to the increased flexibility in modeling the warping functions.
Fig. 4.
Fig. 4.
Data from the Philadelphia Neurodevelopmental Cohort (Satterthwaite and others, 2016). Left column: The distribution of functional connectivity (FC) strength, which determine network edge weights, is related to age (Panel A) but not motion (Panel B). Middle and right columns: Modularity and participation coefficient given the 7 communities defined in Yeo and others (2011) as a function of t. The color of the curve corresponds to age (Panel A; darker = younger) or motion (Panel B; darker = less motion).
Fig. 5.
Fig. 5.
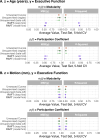
In data from the Philadelphia Neurodevelopmental Cohort (Satterthwaite and others, 2016), RAFT alignment of the modularity and participation coefficient curves improved prediction of executive function when the auxiliary variable was age, but not when the auxiliary variable was motion. We considered modularity (left column) and participation coefficient (right column) using communities defined by the 7-community parcellation described in (Yeo and others, 2011); age was measured in years, and motion measured as average relative RMS displacement in millimeters. (Panel A) The superior performance of RAFT when z is age could be due to multiple factors: age has a strong association with both the network diagnostic curves (Figure S.13 and Figure S.14) and executive function. Therefore, warping the curves to predict age well will likely improve prediction of y. Another possibility is that age-related misalignment has obscured the true association between executive function and network diagnostic curves, which RAFT has recovered. (Panel B) The similarly poor performance of all alignment methods, including RAFT, when z is motion could be due to the weak association between z and the network diagnostics, leading to a warping that look similar to the unsupervised case.

References

    1. Achard Sophie. (2006, January). A resilient, low-frequency, small-world human brain functional network with highly connected association cortical hubs. Journal of Neuroscience 26(1), 63–72. - PMC - PubMed
    1. Afyouni Soroosh, Smith Stephen M. and Nichols Thomas E. (2019, October). Effective degrees of freedom of the pearson's correlation coefficient under autocorrelation. NeuroImage 199, 609–625. - PMC - PubMed
    1. Bassett Danielle S., Nelson Brent G., Mueller Bryon A., Camchong Jazmin and Lim Kelvin O. (2012, February). Altered resting state complexity in schizophrenia. NeuroImage 59(3), 2196–2207. - PMC - PubMed
    1. Baum Graham L., Ciric Rastko, Roalf David R., Betzel Richard F., Moore Tyler M., Shinohara Russell T., Kahn Ari E., Vandekar Simon N., Rupert Petra E., Quarmley Megan, Cook Philip A., Elliott Mark A., Ruparel Kosha, Gur Raquel E., Gur Ruben C., Bassett Danielle S. and others. (2017, June). Modular segregation of structural brain networks supports the development of executive function in youth. Current Biology 27(11), 1561–1572.e8. - PMC - PubMed
    1. Betzel Richard F. and Bassett Danielle S. (2017, October). Multi-scale brain networks. NeuroImage 160, 73–83. - PMC - PubMed

Publication types