[Preprint]. 2023 Jul 11:2023.07.10.548432.
doi: 10.1101/2023.07.10.548432.

Proteome-wide copy-number estimation from transcriptomics

Affiliations

Proteome-wide copy-number estimation from transcriptomics

Andrew J Sweatt et al. bioRxiv. .

Update in

  • Proteome-wide copy-number estimation from transcriptomics.
    Sweatt AJ, Griffiths CD, Groves SM, Paudel BB, Wang L, Kashatus DF, Janes KA. Sweatt AJ, et al. Mol Syst Biol. 2024 Nov;20(11):1230-1256. doi: 10.1038/s44320-024-00064-3. Epub 2024 Sep 27. Mol Syst Biol. 2024. PMID: 39333715 Free PMC article.

Abstract

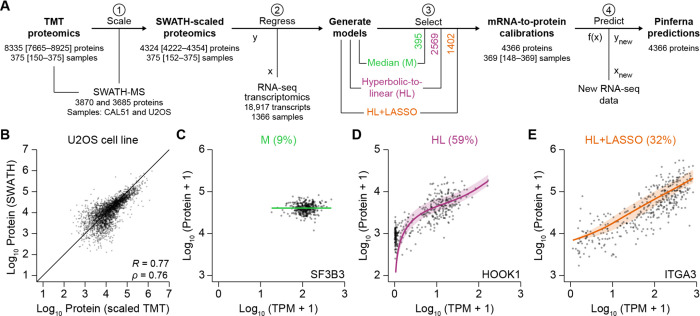
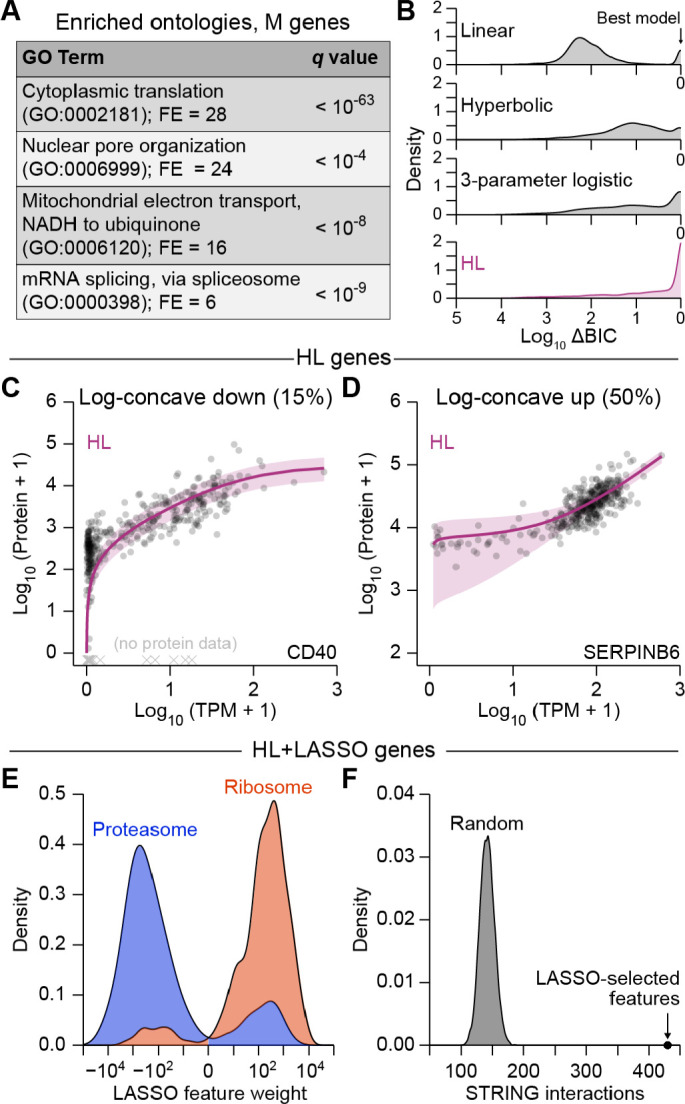
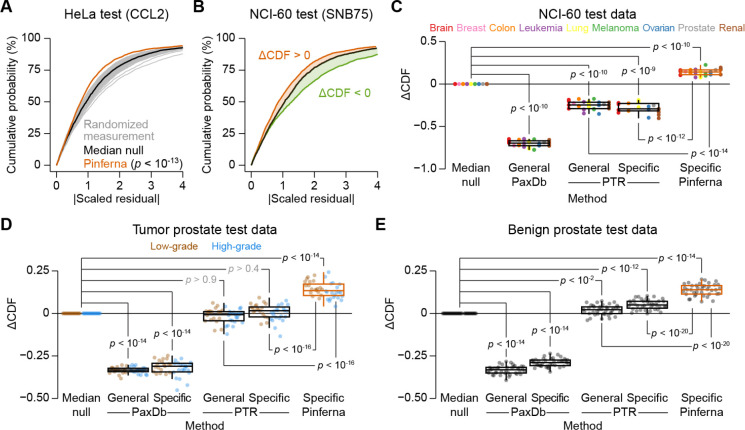
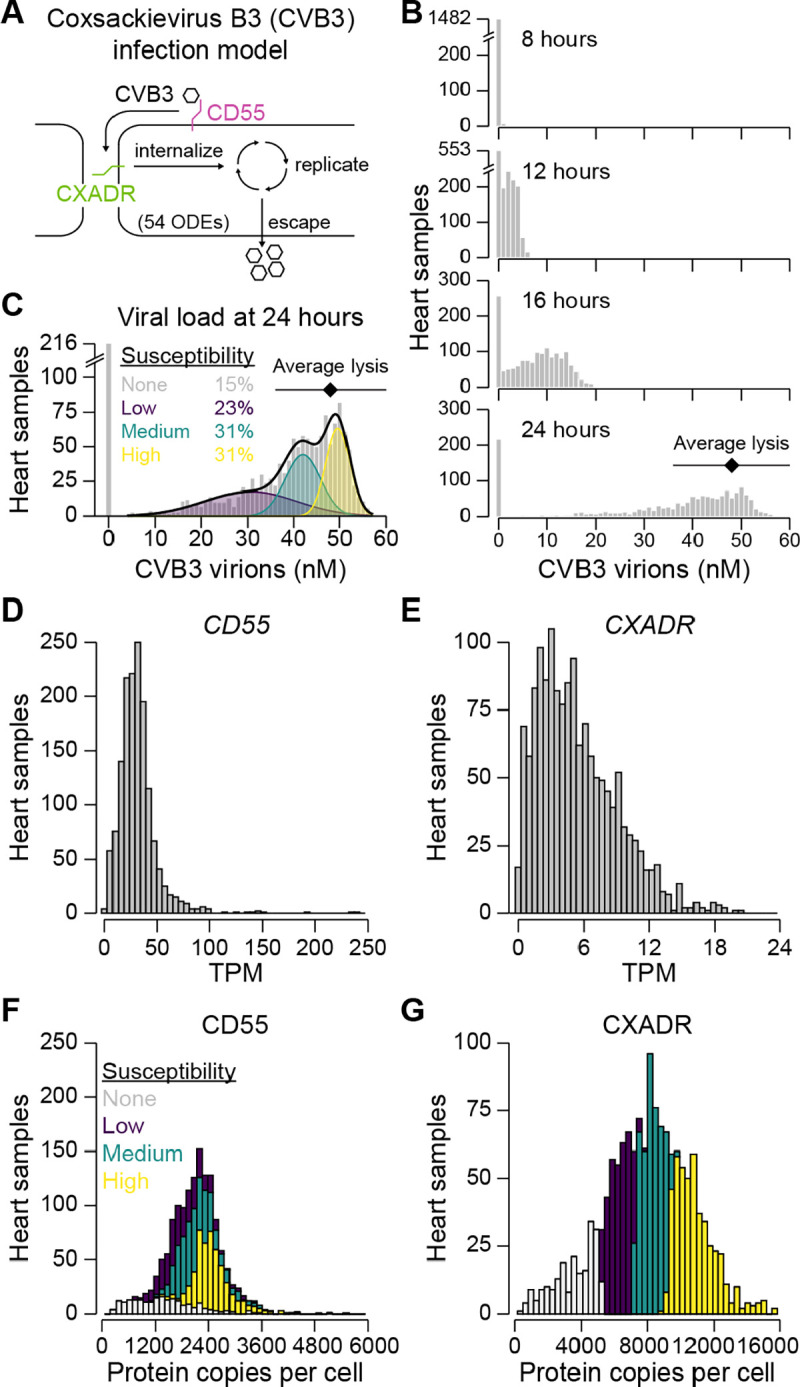
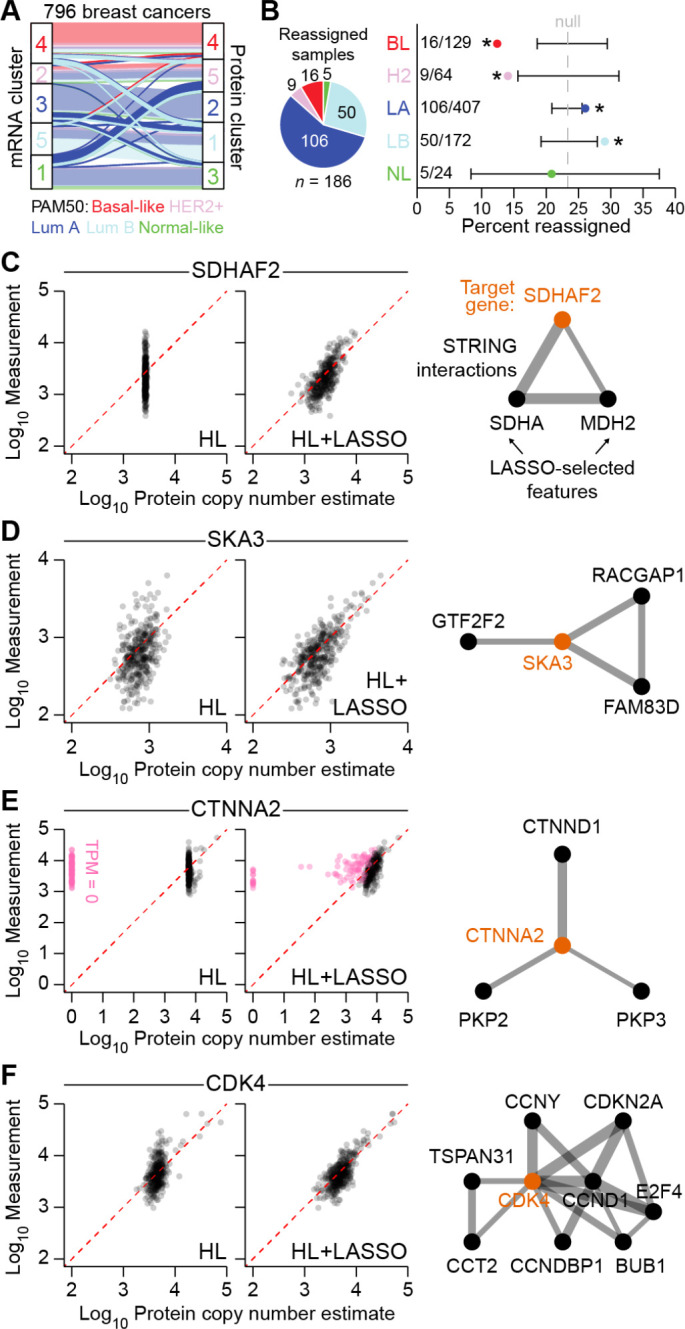
Protein copy numbers constrain systems-level properties of regulatory networks, but absolute proteomic data remain scarce compared to transcriptomics obtained by RNA sequencing. We addressed this persistent gap by relating mRNA to protein statistically using best-available data from quantitative proteomics-transcriptomics for 4366 genes in 369 cell lines. The approach starts with a central estimate of protein copy number and hierarchically appends mRNA-protein and mRNA-mRNA dependencies to define an optimal gene-specific model that links mRNAs to protein. For dozens of independent cell lines and primary prostate samples, these protein inferences from mRNA outmatch stringent null models, a count-based protein-abundance repository, and empirical protein-to-mRNA ratios. The optimal mRNA-to-protein relationships capture biological processes along with hundreds of known protein-protein interaction complexes, suggesting mechanistic relationships are embedded. We use the method to estimate viral-receptor abundances of CD55-CXADR from human heart transcriptomes and build 1489 systems-biology models of coxsackievirus B3 infection susceptibility. When applied to 796 RNA sequencing profiles of breast cancer from The Cancer Genome Atlas, inferred copy-number estimates collectively reclassify 26% of Luminal A and 29% of Luminal B tumors. Protein-based reassignments strongly involve a pharmacologic target for luminal breast cancer (CDK4) and an α-catenin that is often undetectable at the mRNA level (CTTNA2). Thus, by adopting a gene-centered perspective of mRNA-protein covariation across different biological contexts, we achieve accuracies comparable to the technical reproducibility limits of contemporary proteomics. The collection of gene-specific models is assembled as a web tool for users seeking mRNA-guided predictions of absolute protein abundance (http://janeslab.shinyapps.io/Pinferna).

Keywords: Biological Sciences; CCLE; CVB3; Pinferna; SWATH; Systems Biology; TMT.


Figures

Fig. 1.
Fig. 1.
Meta-assembly and inference of conditional mRNA-to-protein relationships for 4366 human genes. (A) Data fusion and model discrimination. (1) Tandem mass tag (TMT) proteomics of 375 cancer cell lines (27) were calibrated to an absolute scale based on sequential window acquisition of all theoretical mass spectra (SWATH) proteomics of CAL51 and U2OS cells (PXD003278; PXD000954). (2) SWATH-scaled proteins were regressed using three models that incorporate transcript abundance from RNA sequencing (RNA-seq) to different extents: median (M), no contribution of mRNA; hyperbolic-to-linear (HL) relationship incorporating mRNA of the gene, abmRNAc+mRNA+mRNA; HL + least absolute shrinkage and selection operator (LASSO) regressors with mRNAs other than the gene of interest. (3) Model selection for each gene was based on the Bayesian Information Criterion. The number of genes selected in each class is indicated. (4) New samples profiled by RNA-seq were used with the calibrated models to make protein inference from RNA (Pinferna) predictions. The number of proteins measured per sample or number of samples with data per protein is shown at each step as the median with the range in brackets. (B) Reliable cross-calibration of the TMT and SWATH meta-assembly. Step 1 of Fig. 1A was performed with CAL51 data alone and the SWATH-scaled TMT proteomics of U2OS cells compared with data obtained directly by SWATH. Pearson’s R and Spearman’s ρ are shown. The reciprocal cross-calibration is shown in SI Appendix, Fig. S1B. (C–E) Representative M, HL, and HL+LASSO genes. Absolute protein copies per cell were regressed against the mRNA abundance normalized as transcripts per million (TPM). Best-fit calibrations ± 95% confidence intervals are overlaid on the proteomic–transcriptomic data from n = 369 cancer cell lines. Evidence for model selection is shown in SI Appendix, Fig. S1C–E.
Fig. 2.
Fig. 2.
Pinferna model selection is consistent with known biological mechanisms and mRNA-to-protein relationships. (A) Gene ontology (GO) enrichments for M genes. The largest non-redundant GO term is shown with the fold enrichment (FE) and false discovery rate-corrected p value (q). The complete list of GO enrichments for each relationship class is available in SI Appendix, Table S6. (B) HL outperforms competing mRNA-to-protein relationships. Models encoding linear, hyperbolic, three-parameter logistic, and HL relationships were built for all genes (n = 4366) and compared by Bayesian Information Criterion (BIC). Results are shown as the smoothed density of BIC differences (ΔBIC) relative to the best model for that gene (ΔBIC = 0). Distributions of BIC weights (34) are shown in SI Appendix, Fig. S2D. (C–D) HL captures different empirical classes of mRNA-to-protein relationships. Log concave-down genes (C) saturate at high mRNA abundance, whereas log concave-up genes (D) plateau at low mRNA abundance. The remaining genes exhibited characteristics of both fits or linear relationships to varying degrees (SI Appendix, Fig. S2G–I). (E) Feature weights of HL+LASSO genes are biologically sensible. Smoothed densities of LASSO feature weights (indicating strength and direction of modulation for an HL fit) among mRNAs encoding subunits of the proteasome (n = 127 feature weights; blue) and the ribosome (n = 397 feature weights; red) are shown. (F) HL+LASSO feature weights are highly enriched for STRING interactions. For each HL+LASSO gene, LASSO-selected features were replaced with random genes (n = 10,000 iterations) to build a null distribution for finding binary interactions in STRING (36). The actual number of STRING interactions among HL+LASSO genes of Pinferna is indicated.
Fig. 3.
Fig. 3.
Pinferna outperforms empirical guesses and competing methods for absolute protein abundance estimation. (A) Pinferna compared to random protein-specific guesses. Model predictions were nondimensionalized as a scaled residual by subtracting the measured abundance, dividing by the standard deviation of the SWATH-scaled protein measured across the meta-assembly, and taking the absolute value (|Scaled residual|). The |Scaled residual| cumulative density was compared to randomized measurements drawn from the SWATH-scaled proteomic data for each gene. Randomized measurements were iterated 100 times (gray) to identify a median null (black) that served as a null distribution for model assessment. Left-shifted distributions indicate improved proteome-wide accuracy (relative to each protein’s variability) compared to protein-specific randomized measurements. Pinferna predictions of HeLa cells (orange; PRJNA437150; PXD009273) were compared to the null distribution by K-S test (p < 10−13). (B) Aggregate performance assessment of protein abundance predictions. The difference in cumulative density functions between test predictions and the median null distribution (ΔCDF) was integrated to identify approaches that performed better (ΔCDF > 0, orange) or worse (ΔCDF < 0, green) than protein-specific guessing. Data are from a prediction of Pinferna (orange) and tissue-specific protein-to-mRNA ratio (PTR; green). (C–E) Pinferna is consistently and uniquely superior to empirical guessing. ΔCDF values were calculated for NCI-60 cell lines (C; PRJNA433861; (43)) excluded from model training (Fig. 1A) and organized by cancer type (n = 5 brain, 1 breast, 3 colon, 4 leukemia, 4 lung, 3 melanoma, 3 ovarian, 1 prostate, 5 renal), primary prostate cancer samples organized by grade of the cancer (D; n = 19 low-grade, 21 high-grade), and normal prostate tissue (E; n = 39; PRJNA579899; PXD004589). PaxDb (40) and PTR (41) were used generically or in a tissue-specific way as alternative approaches (Materials and Methods). A cell line-specific PaxDb estimate was only available for U251 cells. Differences between groups were assessed by rank-sum test with Šidák correction. Box-and-whisker plots show the median (horizontal line), interquartile range (IQR, box), and an additional 1.5 IQR extension (whiskers) of the data.
Fig. 4.
Fig. 4.
Simulating degrees of human cardio-susceptibility to coxsackievirus B3 (CVB3) infection based on inferred abundance differences in CVB3 receptors. (A) An in silico model of CVB3 initiated by its receptors CD55 and CXADR. After binding, the virus undergoes internalization, replication, and escape. The viral life cycle is mathematically modeled with 54 ordinary differential equations (ODEs; MODEL2110250001). (B) Distribution of viral load over time from 1489 human heart samples. Inferred abundances of CD55 and CXADR from each sample were used to simulate CVB3 infection. Each model run consisted of 100 simulated infections up to 24 hours with a coefficient of variation in model parameters of 5%. Viral loads (gray) at the indicated time points are shown along with the estimated point of lysis (black: mean estimated lytic yield ± s.d. (24, 25, 53)). (C) Four modes of infection susceptibility to terminal CVB3 infection. Viral load at 24 hours was replotted from B fit to a Gaussian mixture model (black) of three components (purple, green, yellow). Relative population densities in each of the susceptibility groups is shown along with the estimated point of lysis (black: mean estimated lytic yield ± s.d. (24, 25, 53)). (D, E) Distribution of mRNA abundances for CD55 (D) and CXADR (E) normalized as TPM. (F, G) Distribution of inferred protein copy numbers per cell for CD55 (F) and CXADR (G) with each sample colored by its susceptibility.
Fig. 5.
Fig. 5.
Inferred proteomics reassigns luminal A/B transcriptomic subtypes of breast cancer. (A) Reorganization of five consensus clusters defined by RNA-seq (left) and Pinferna (right) for 796 breast cancers in The Cancer Genome Atlas (26). Clusters were determined by Monte Carlo consensus clustering (91) and colored according to the dominant PAM50 subtype of each cluster. Samples that did not change clusters are transparent in the background while samples that changed are opaque in the foreground. Lum A: Luminal A; Lum B: Luminal B. (B) Reassigned samples are predominated by luminal A/B PAM50 subtypes. (Left) Proportion of each subtype among samples that were reassigned. (Right) Percent reassignments for each subtype. The average overall reassignment rate is shown as a null reference (186/796 = 23%; gray dashed) with the 90% hypergeometric confidence interval (black) for each subtype. Reassignment enrichments were determined by hypergeometric test, asterisk indicates p < 0.05. BL: Basal-like; H2: HER2+; LA: Luminal A; LB: Luminal B; NL: Normal-like. (C–F) Cluster-reorganizing genes are highly dependent on other genes. (Left) Concordance between SWATH measurements and the HL fit ± LASSO in the meta-assembly. Perfect concordance is given by the red dashed line. Pink points in E are samples with TPM = 0 for CTNNA2. (Right) STRING interactions (edges) among the target gene (orange) and its LASSO-selected features (black). Edge thickness (gray) reflects the confidence of the interaction as determined by STRING. Thicker lines represent a higher confidence score. Line lengths are arbitrary.

References

    1. Phillips R., Milo R., A feeling for the numbers in biology. Proc. Natl. Acad. Sci. U. S. A. 106, 21465–21471 (2009). - PMC - PubMed
    1. Wang Z., Gerstein M., Snyder M., RNA-Seq: a revolutionary tool for transcriptomics. Nat. Rev. Genet. 10, 57–63 (2009). - PMC - PubMed
    1. Barrett T. et al., NCBI GEO: archive for functional genomics data sets--update. Nucleic Acids Res. 41, D991–995 (2013). - PMC - PubMed
    1. Fehrmann R. S. et al., Gene expression analysis identifies global gene dosage sensitivity in cancer. Nat. Genet. 47, 115–125 (2015). - PubMed
    1. Duren Z., Chen X., Jiang R., Wang Y., Wong W. H., Modeling gene regulation from paired expression and chromatin accessibility data. Proc. Natl. Acad. Sci. U. S. A. 114, E4914–E4923 (2017). - PMC - PubMed

Publication types