[Preprint]. 2023 Jul 19:rs.3.rs-3150748.
doi: 10.21203/rs.3.rs-3150748/v1.

Entire Expressed Peripheral Blood Transcriptome in Pediatric Severe Malarial Anemia

Affiliations

Entire Expressed Peripheral Blood Transcriptome in Pediatric Severe Malarial Anemia

Samuel Anyona et al. Res Sq. .

Update in

Abstract

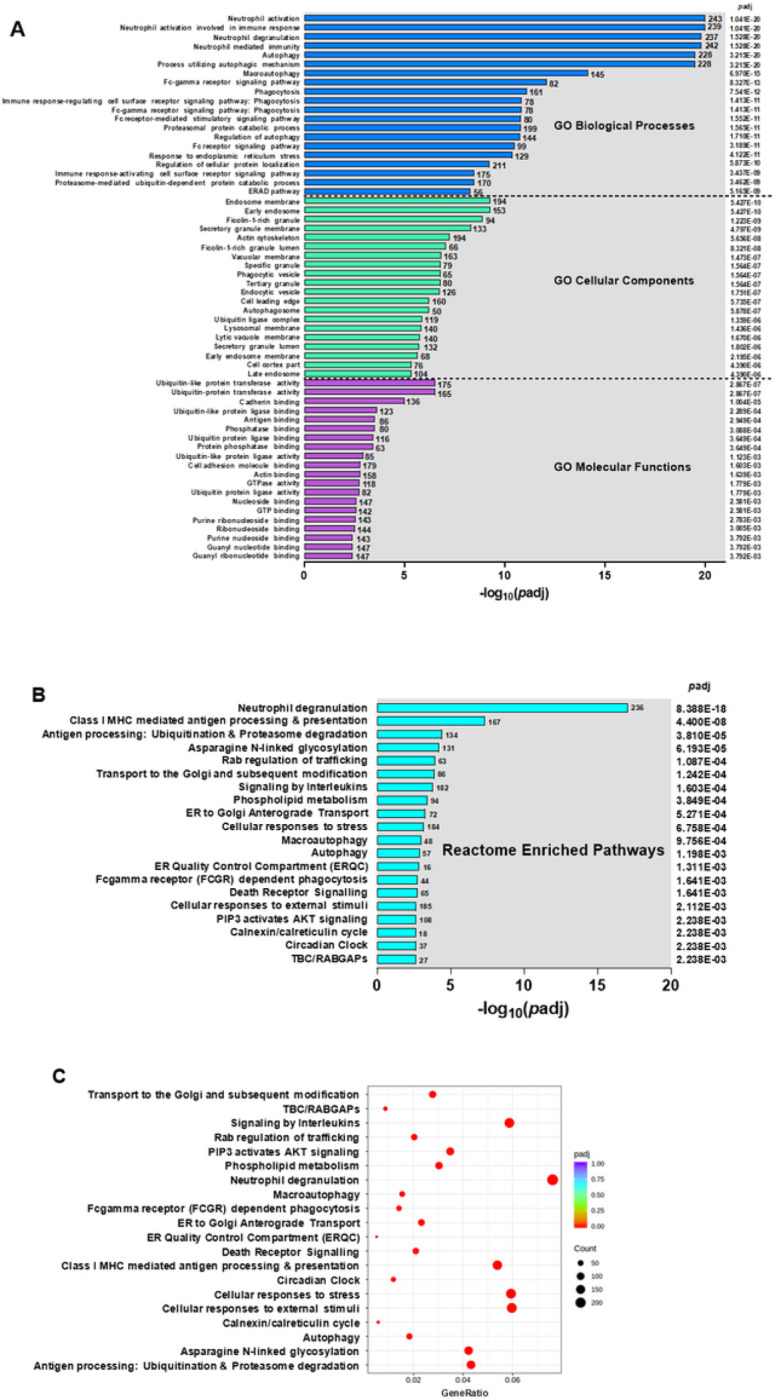
This study on severe malarial anemia (SMA: Hb < 6.0 g/dL), a leading global cause of childhood morbidity and mortality, analyzed the entire expressed transcriptome in whole blood from children with non-SMA (Hb ≥ 6.0 g/dL, n = 41) and SMA (n = 25). Analyses revealed 3,420 up-regulated and 3,442 down-regulated transcripts, signifying impairments in host inflammasome activation, cell death, innate immune responses, and cellular stress responses in SMA. Immune cell profiling showed a decreased antigenic and immune priming response in children with SMA, favoring polarization toward cellular proliferation and repair. Enrichment analysis further identified altered neutrophil and autophagy-related processes, consistent with neutrophil degranulation and altered ubiquitination and proteasome degradation. Pathway analyses highlighted SMA-related alterations in cellular homeostasis, signaling, response to environmental cues, and cellular and immune stress responses. Validation with a qRT-PCR array showed strong concordance with the sequencing data. These findings identify key molecular themes in SMA pathogenesis, providing potential targets for new malaria therapies.


Conflict of interest statement

COMPETING INTERESTS The authors declare no competing interests.

Figures

Figure 1
Figure 1. RNA-seq data for Kenyan children presenting with non-SMA (Hb≥6.0g/dL, n=41) and SMA (Hb<6.0g/dL, n=25).
We used the edgeR R package (3.16.5) to infer the overall distribution of differentially expressed genes. (A). Volcano plot showing 3,420 up-regulated and 3,442 down-regulated protein coding genes in Kenyan children presenting with non-SMA (Hb³6.0 g/dL, n=41) and SMA (Hb<6.0 g/dL, n=25) cases.Horizontal axis shows the fold change of genes in different groups. Vertical axis shows the statistically significant degree of changes in gene expression levels. The points represent genes, blue dots indicate no significant difference in genes, red dots indicate up-regulated differential expression genes, green dots indicate down-regulated differential expression genes. (B). Venn Diagram showing Co-expression genes uniquely expressed within each clinical group, with the overlapping regions showing the number of genes that are co-expressed in two or more groups. At enrollment into the study, children with non-SMA had 992 uniquely expressed genes, while those in the SMA group had 328 genes expressed. Co-expressed genes in both clinical groups were 15,596. (C). Hierarchical Clustering Heatmap showing a Cluster analysis on top 1000 differential expressed genes. Hierarchical clustering analysis was carried out for log2(FPKM+1) of union differential expression genes in children with SMA relative to those in the non-SMA group. Genes within the same cluster show the same trends in expression levels under different clinical groups. The distribution of parasitemia, sickle cell status, and age are shown on the top for each group. The white color implies the average magnitude of gene expression. The brightest blue represents the smallest value, and the brightest red represents the highest value. Cluster 1 shown in hatched black outline and cluster 2 shown with solid black outline. (D and E). DEGs enrichment analysis of the process networks based on emerging clusters from the hierarchical Heatmap. The relationship between significant DEGs in the selected clusters for the SMA and non-SMA groups was determined using enrichment analysis to identify process networks on MetaCore. The IRF1, IL-1β, caspase-1, caspase-4, FasR (CD95) present down-regulated genes (n=164) in cluster 1 of the heatmap (Fig. 1D), while the TCF7L1 (TCF3), E2A, RING2 network shows up-regulated (n=114) genes in cluster 2 (Fig. 1E). The blue-shaded circles show down-regulated genes and the red-shaded circles are up-regulated genes. The details of symbols used in these figures are available at: https://portal.genego.com/legends/MetaCoreQuickReferenceGuide.pdf.
Figure 2
Figure 2. Estimation of Immune Cell Type Proportions in Whole Blood.
Deconvolution analysis of the different cell types in blood was determined using CIBERSORTx. Cellular frequencies were imputed using LM22 as the signature matrix file. (A) Heatmap representing the cell type expression for 22 types/subtypes of leukocyte cell populations presented at the individual patient level in the non-SMA (Hb³6.0 g/dL, n=41) and SMA (Hb<6.0 g/dL, n=25) groups. *Indicates significant differences (p<0.050) in immune cell proportions between the two groups determined using two-sided, two-sample t-tests with Welch correction. (B) Relative proportion (%) of expression for the immune cell types that differed significantly between children with non-SMA and SMA. Bivariate analysis was performed using two-sided, two-sample t-tests with Welch correction and presented as mean (SEM) for the non-SMA and SMA groups.
Figure 3
Figure 3
Functional enrichment analysis. (A) GO Enrichment Analysis showing the top 20 enriched terms in the biological process, cellular component, and molecular function categories of DEGs in children with SMA (Hb<6.0 g/dL, n=25), relative to those in the non-SMA (Hb≥6.0 g/dL, n=41) group. GO enrichment analysis was done using the clusterProfiler R package, while correcting for bias on gene length. GO terms of enriched DEGs with p-adjusted values <0.050 were considered significantly. The X-axis represents the negative log10 of p-adjusted (−log10[p-adjusted) values. (B) Reactome enrichment analysis of top 20 enriched terms that were significantly different in children with SMA, relative to those with non-SMA. (C) Reactome enrichment histogram of the top 20 terms. The Y-axis indicates the pathway name. The X-axis represents the gene ratio of up- and down-regulated genes. The size of the black dots corresponds to the number of genes annotated, and the depth of the red color implies magnitude of enrichment (p-adjust)
Figure 4
Figure 4. Canonical pathway analysis of DEGs.
(A) Functional classification of KEGG pathway of the DEGs between non-SMA (Hb³6.0 g/dL, n=41) and SMA (Hb<6.0 g/dL, n=25) groups. The KEGG terms were grouped into 5 categories, namely; (i) cellular processes, (ii) environmental information processing, (iii) gene information processing, (iv) metabolism, and (v) organismal systems. The left Y-axis shows the KEGG terms. The right Y-axis shows p-adjusted values for each KEGG term. The X-axis represents the negative log 10 of p-adjusted values (−log10[p-adjusted]). (B) The top emerging KEGG term was the protein processing in the endoplasmic reticulum pathway. DEGs mapped to the pathway in children with SMA relative to non-SMA groups. Red boxes show genes that were up-regulated in children with SMA and green boxes were genes down-regulated in SMA cases relative to controls. (C) Distribution of top 20 gene ontology (GO) terms using Metacore. The GO terms were classified into 5 categories; (i) apoptosis and survival, (ii) autophagy, (iii), cytoskeleton remodeling, (iv) development and (v) immune response. The left Y-axis shows the GO terms. The right Y-axis shows p-adjusted values for each GO term. The X-axis represents the −log10[p-adjusted. (D) A schematic model of the top GO enrichment term, the positive regulation of WNT/Beta-catenin signaling in the cytoplasm. The pathway map was generated using MetaCore. The red color thermometers show annotated genes that were up-regulated in children with SMA. Blue colored thermometers show genes that were down-regulated in cases versus controls. The details of symbols used in these figures are: https://portal.genego.com/legends/MetaCoreQuickReferenceGuide.pdf.
Figure 5
Figure 5
Validation of the transcriptome data. A Human Ubiquitination Pathway RT2 Profiler PCR Array kit (Qiagen, LLC-USA, Germantown, MD, United States) was used to measure the expression of genes involved in the ubiquitination process (A) Heat map shows a graphical and color-coded representation of fold regulation (Log2) comparison of significant DEGs using the RT-qPCR array versus data generated from the whole blood transcriptome analysis. The Y-axis shows the gene names. The X-axis shows the assay type. The darkest purple represents the lowest fold change, and the brightest yellow represents the highest fold change in children with SMA relative to non-SMA. (B) Correlation scatter plot of the significantly expressed ubiquitination process genes in the RT-qPCR analysis (Y-axis) versus the transcriptome data (X-axis). There was a strong positive correlation of the DEGs in SMA cases (r=0.834, p<0.001).

References

    1. WHO. World malaria report 2022. . (World Health Organization, 2022).
    1. WHO. World malaria report 2021. Report No. 9240040498, (2021).
    1. Amek N. O. et al. Childhood cause-specific mortality in rural Western Kenya: application of the InterVA-4 model. Glob Health Action 7, 25581, doi:10.3402/gha.v7.25581 (2014). - DOI - PMC - PubMed
    1. Amek N. O. et al. Infant and child mortality in relation to malaria transmission in KEMRI/CDC HDSS, Western Kenya: validation of verbal autopsy. Malar J 17, 37, doi:10.1186/s12936-018-2184-x (2018). - DOI - PMC - PubMed
    1. Akech S. et al. The Clinical Profile of Severe Pediatric Malaria in an Area Targeted for Routine RTS,S/AS01 Malaria Vaccination in Western Kenya. Clin Infect Dis 71, 372–380, doi:10.1093/cid/ciz844 (2020). - DOI - PMC - PubMed

Publication types

LinkOut - more resources