[Preprint]. 2023 Jul 14:2023.07.14.548620.
doi: 10.1101/2023.07.14.548620.

Mechanism of target site selection by type V-K CRISPR-associated transposases

Affiliations

Mechanism of target site selection by type V-K CRISPR-associated transposases

Jerrin Thomas George et al. bioRxiv. .

Update in

Abstract

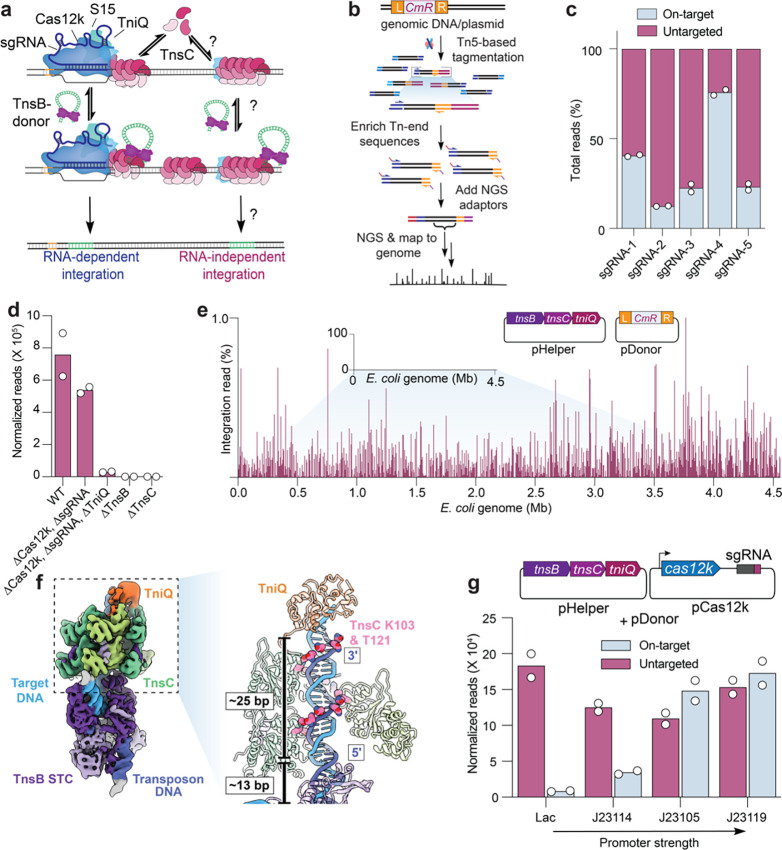
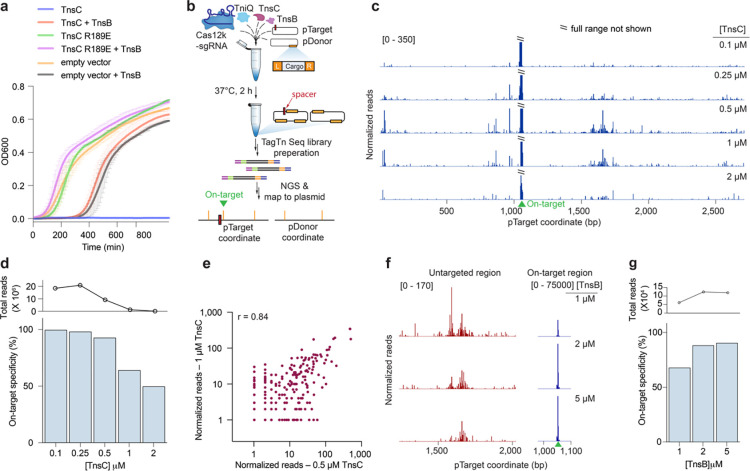
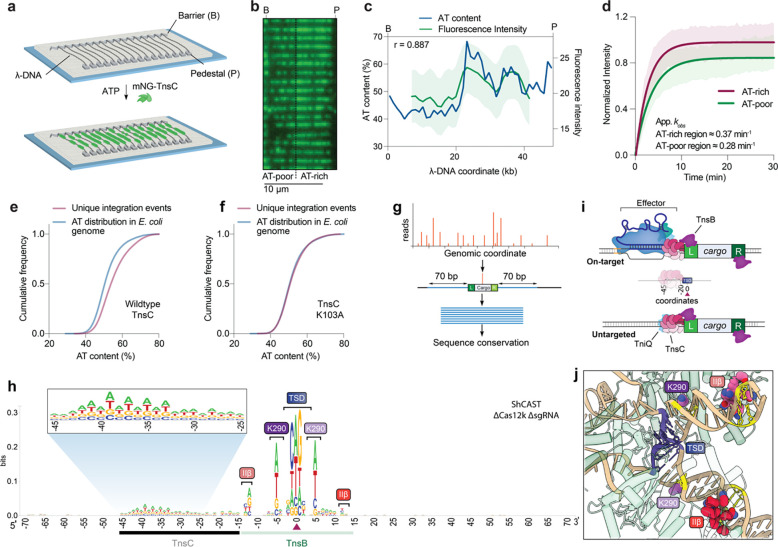
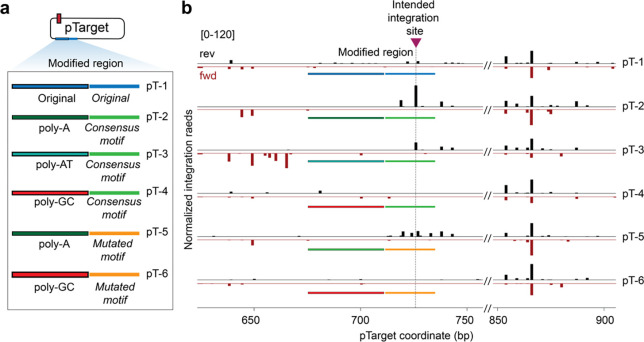
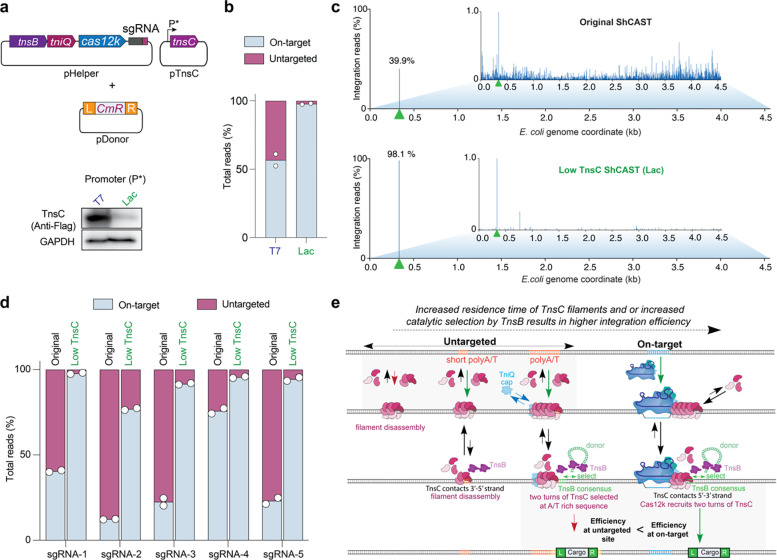
Unlike canonical CRISPR-Cas systems that rely on RNA-guided nucleases for target cleavage, CRISPR-associated transposases (CASTs) repurpose nuclease-deficient CRISPR effectors to facilitate RNA-guided transposition of large genetic payloads. Type V-K CASTs offer several potential upsides for genome engineering, due to their compact size, easy programmability, and unidirectional integration. However, these systems are substantially less accurate than type I-F CASTs, and the molecular basis for this difference has remained elusive. Here we reveal that type V-K CASTs undergo two distinct mobilization pathways with remarkably different specificities: RNA-dependent and RNA-independent transposition. Whereas RNA-dependent transposition relies on Cas12k for accurate target selection, RNA-independent integration events are untargeted and primarily driven by the local availability of TnsC filaments. The cryo-EM structure of the untargeted complex reveals a TnsB-TnsC-TniQ transpososome that encompasses two turns of a TnsC filament and otherwise resembles major architectural aspects of the Cas12k-containing transpososome. Using single-molecule experiments and genome-wide meta-analyses, we found that AT-rich sites are preferred substrates for untargeted transposition and that the TnsB transposase also imparts local specificity, which collectively determine the precise insertion site. Knowledge of these motifs allowed us to direct untargeted transposition events to specific hotspot regions of a plasmid. Finally, by exploiting TnsB's preference for on-target integration and modulating the availability of TnsC, we suppressed RNA-independent transposition events and increased type V-K CAST specificity up to 98.1%, without compromising the efficiency of on-target integration. Collectively, our results reveal the importance of dissecting target site selection mechanisms and highlight new opportunities to leverage CAST systems for accurate, kilobase-scale genome engineering applications.


Conflict of interest statement

COMPETING INTERESTS Columbia University has filed a patent application related to this work for which J.T.G. and S.H.S. are inventors. S.H.S. is a co-founder and scientific advisor to Dahlia Biosciences, a scientific advisor to CrisprBits and Prime Medicine, and an equity holder in Dahlia Biosciences and CrisprBits. The remaining authors declare no competing interests.

Figures

Fig. 1 |
Fig. 1 |. Type V-K CASTs direct frequent Cas12k- and RNA-independent transposition events.
a, Schematic of type V-K CAST transposition occurring at on-target sites (RNA-dependent) and untargeted sites (RNA-independent). b, Experimental pipeline used for tagmentation-based transposon insertion sequencing (TagTn-seq) for in vitro and genomic samples. c, Fraction of total genome-mapping integration reads detected at on-target and untargeted sites for the wildtype pHelper expression plasmid across multiple guides (sgRNA-1 to sgRNA-5). d, Total genome-mapping reads detected for WT pHelper or pHelper with the indicated deletions, normalized and scaled (Methods). e, Zoomed-in view of integration reads comprising 1% or less of E. coli genome-mapping reads, in an experiment performed without the Cas12k and guide RNA. f, Cryo-EM reconstruction of the untargeted transpososome reveals the assembly of TniQ (orange), TnsC (green), and TnsB (purple) in a strand-transfer complex (STC). The target DNA and transposon DNA are represented in light blue and dark blue, respectively. For visualization, a composite map was generated using two local-resolution filtered reconstructions from the focused refinements (Methods). Zoomed-in and cutaway view showing TnsC forming a helical assembly on the target DNA, positioning residues K103 and T121 (pink) adjacent to one strand of the target DNA (dark blue). 5’ and 3’ ends of the TnsC-interacting DNA strand are indicated. Two turns of TnsC and TnsB footprint on DNA until TSD cover approximately 25 and 13 base pairs (bp), respectively. Only selected TnsC monomers are represented in the cutaway for clarity. g, Cas12k and the sgRNA were cloned onto a separate vector, and the promoter driving Cas12k expression was varied. Reads detected at on-target and untargeted sites during transposition assays were normalized and scaled (Methods). For c, d, e, and g, the mean is shown from n = 2 independent biological replicates.
Fig. 2 |
Fig. 2 |. Biochemical reconstitution of transposition reveals distinct efficiencies at on-target and untargeted sites.
a, Growth curves upon induction of WT or mutant TnsC, with or without TnsB. The data shown are mean ± s.d for n = 2 independent biological replicates, inoculated from individual colonies. b, Assay schematic for probing in vitro plasmid-to-plasmid transposition events using recombinantly expressed CAST components. c, In vitro integration reads mapping to pTarget, from experiments in which TnsC was titrated from 0.1 – 2 μM. Data were normalized and scaled to highlight untargeted integration events, relative to on-target insertions (Methods). d, On-target specificity from biochemical transposition assays at varying TnsC concentrations, calculated as the fraction of on-target reads divided by total plasmid-mapping reads (bottom). Total integration activity also decreased as a function of TnsC concentration, as seen by the normalized plasmid-mapping reads (top). e, Scatter plot showing reproducibility between untargeted integration reads observed in vitro at two high TnsC concentrations; each data point represents transposition events mapping to a single-bp position within pTarget. The Pearson linear correlation coefficient is shown (two tailed P <0.0001); on-target events were masked (Methods). f, Normalized integration reads detected at a representative untargeted site (left) and at the on-target site (right), with 1 μM TnsC and the indicated TnsB concentration. Note the differing y-axis ranges. g, On-target specificity from biochemical transposition assays at 1 μM TnsC and the indicated TnsB concentration, shown as in d.
Fig. 3 |
Fig. 3 |. RNA-independent integration events occur at preferred sequence motifs.
a, Schematic for single-molecule DNA curtains assay to visualize TnsC binding. λ phage DNA substrates are double-tethered between chrome pedestals and visualized used TIRF microscopy. b, mNG-labeled TnsC preferentially binds AT-rich sequences on the λ-DNA substrate near the 3’ (pedestal) end (Supplementary Movie 1). c, Correlation between AT content and mNG-TnsC fluorescence intensity visualized along the length of λ DNA. The Pearson linear correlation coefficient is shown (two-tailed P < 0.0001); data shown represent the mean ± s.d for n = 66 molecules. d, Binding kinetics for mNG-TnsC at AT-rich and AT-poor regions of the λ-DNA substrate. Apparent kobs at AT-rich sites ≈ 0.37 min−1, 95% C.I. [0.35, 0.39] and at AT-poor sites ≈ 0.28 min−1, 95% C.I. [0.27, 0.30]. The data shown represent mean ± s.d for n = 87 molecules. e, Cumulative frequency distributions for the AT content within a 100-bp window flanking integration events, using ShCAST with WT TnsC and sgRNA-1 (n = 5,505 unique integration events), compared to random sampling of the E. coli genome (n = 50,000 counts; Methods). The distributions were significantly different, based on results of a Mann-Whitny U test (P = 1.48 × 10−135). f, Cumulative frequency distribution comparison as in panel e, but with a K103A TnsC mutant (n = 1,932 unique integration events), which revealed a loss of AT bias (P = 0.1349). g, Meta-analysis of untargeted transposition specificity was performed by extracting sequences from a 140-bp window flanking the integration site and generating a consensus logo. h, WebLogo from a meta-analysis of untargeted genomic transposition (n = 5,855 unique integration events) with a modified pHelper lacking Cas12k and sgRNA. The site of integration is noted with a maroon triangle. An AT-rich sequence spanning ~25 bp likely reflects the footprint of two turns of a TnsC filament (black), whereas motifs within/near the target-site duplication (TSD) represent TnsB-specific sequence motifs (green). Specific TnsB residues/domains contacting the indicated nucleotides are shown. The zoomed-in inset highlights periodicity in the sequence bound by TnsC. i, Schematic showing the relative spacing of sequence features bound by Cas12k, TnsC, and TnsB in both on-target (RNA-dependent) and untargeted (RNA-independent) DNA transposition. In both cases, the TnsC footprint covers ~25-bp of DNA and directs polarized, unidirectional integration downstream in a L-R orientation. j, Zoom-in view of the ShCAST transpososome structure, highlighting sequence-specific contacts between TnsB and the target DNA that were observed in the WebLogo in h. PDB ID: 8EA323.
Fig. 4 |
Fig. 4 |. Artificial induction of semi-targeted RNA-independent transposition at preferred motifs.
a, A region on pTarget exhibiting low integration activity (original, blue) was substituted with rationally engineered sequences (colored) based on TnsC and TnsB binding preferences, generating the indicated pTarget variants (pT-1-6). b, After performing biochemical transposition assays with the indicated pTarget substrates, integration reads were normalized and mapped to either the forward strand (fwd, red) or reverse strand (rev, black). The intended ‘untargeted’ integration site based on optimized poly-A and TnsB consensus motifs is marked with a maroon triangle and dotted line; the representative region at right (850–900 bp) is shown to highlight consistency in integration events observed elsewhere on pTarget.
Fig. 5 |
Fig. 5 |. The fidelity of RNA-guided DNA integration is controlled by TnsC concentration.
a, Schematic of alternative ShCAST expression strategy, in which TnsC was encoded on a separate plasmid (pTnsC) driven by a Lac or T7 promoter. Distinct cellular expression levels were confirmed by Western blot against a 3xFLAG epitope tag fused to TnsC (bottom). b, Fraction of total genome-mapping integration reads detected at on-target and untargeted sites upon TnsC expression with a Lac or T7 promoter. c, Genome-wide view of E. coli genome-mapping reads for the original/WT ShCAST system as compared to a modified ShCAST system with low TnsC expression; the zoomed-in view visualizes reads comprising 1% or less of genome-mapping reads. The target site is marked with a green triangle. d, Fraction of total genome-mapping integration reads detected at on-target and untargeted sites, with the original ShCAST system or modified ShCAST system with low TnsC expression. Data for five sgRNAs are shown. For b and d, the mean is shown from n = 2 independent biological replicates. e, Model for target-site selection and transpososome assembly during on-target, RNA-dependent transposition (right) or untargeted, RNA-independent transposition (left) by type V-K CAST systems. Within the untargeted pathway, TnsC preferentially forms filaments at A/T-rich regions and is capped by TniQ, leading to the downstream site being selected by TnsB for integration. Cas12k-bound targets may better nucleate TnsC filament formation, and we hypothesize that TnsC filaments loaded at Cas12k-bound targets serve as better substrates for DNA integration, compared to untargeted sites. Importantly, all structures of TnsC filaments representing untargeted sites–, including the ‘BCQ’ transpososome, reveals K103 residues of the TnsC monomers forming the filament proximal to TnsB, contacting DNA with opposite strand polarity compared to on-target structures,. This could be decisive for the distinct efficiencies observed at these sites.

References

    1. Craig N. L. Target site selection in transposition. Annu Rev Biochem 66, 437–474 (1997). - PubMed
    1. Siguier P., Gourbeyre E. & Chandler M. Bacterial insertion sequences: their genomic impact and diversity. FEMS Microbiol Rev 38, 865–891 (2014). - PMC - PubMed
    1. Siguier P., Gourbeyre E., Varani A., Ton-Hoang B. & Chandler M. Everyman’s guide to bacterial insertion sequences. Microbiol Spectr 3, MDNA3-0030-2014 (2015). - PubMed
    1. Arias-Palomo E. & Berger J. M. An atypical AAA+ ATPase assembly controls efficient transposition through dna remodeling and transposase recruitment. Cell 162, 860–871 (2015). - PMC - PubMed
    1. Mizuno N. et al. MuB is an AAA+ ATPase that forms helical filaments to control target selection for DNA transposition. Proc Natl Acad Sci USA 110, E2441–E2450 (2013). - PMC - PubMed

Publication types