[Preprint]. 2023 Jul 15:2023.07.13.548950.
doi: 10.1101/2023.07.13.548950.

SURROGATE SELECTION OVERSAMPLES EXPANDED T CELL CLONOTYPES

Affiliations

SURROGATE SELECTION OVERSAMPLES EXPANDED T CELL CLONOTYPES

Peng Yu et al. bioRxiv. .

Update in

Abstract

Inference from immunological data on cells in the adaptive immune system may benefit from modeling specifications that describe variation in the sizes of various clonal sub-populations. We develop one such specification in order to quantify the effects of surrogate selection assays, which we confirm may lead to an enrichment for amplified, potentially disease-relevant T cell clones. Our specification couples within-clonotype birth-death processes with an exchangeable model across clonotypes. Beyond enrichment questions about the surrogate selection design, our framework enables a study of sampling properties of elementary sample diversity statistics; it also points to new statistics that may usefully measure the burden of somatic genomic alterations associated with clonal expansion. We examine statistical properties of immunological samples governed by the coupled model specification, and we illustrate calculations in surrogate selection studies of melanoma and in single-cell genomic studies of T cell repertoires.

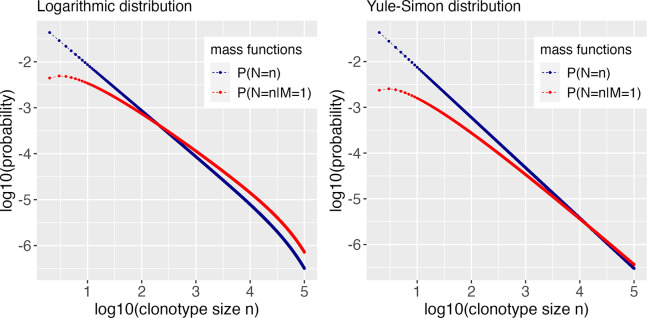
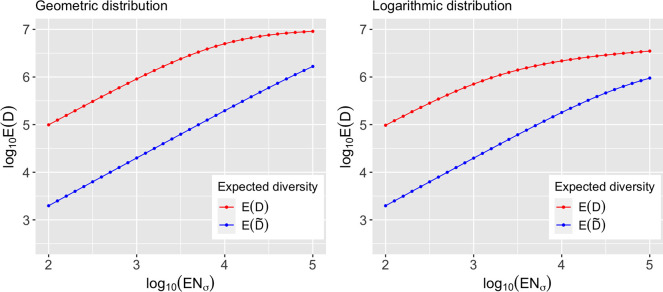
Keywords: Bayes’s rule; Yule-Simon law; clonal expansion; diversity statistic; enrichment; exchangeable birth-death processes; experimental design; single cell sequencing; size bias; somatic mutation.


Figures

Fig 1.
Fig 1.
Binary tree formed by a developing clonotype, showing examples of cell division, cell death and mutation, and noting the number d of cell divisions experienced by each extant cell at time tobs. Green circles (extant cells 5 and 6) denote mutant T cells. Empty circles (1, 2, 3, 4 and 7) denote wild type T cells. Green lines denote evolution of mutant cells. Short vertical lines denote cell death.
Fig 2.
Fig 2.
Proliferation effect: Shown are violin plots of the division number Dσ for cells in randomly developed binary trees, having various sizes, n, at observation time. We used R packages ape, to simulate Yule trees, and adephylo, to count divisions (Paradis and Schliep, 2019; Jombart, Balloux and Dray, 2010). Each plot summarizes 100,000 simulated Dσ values. Empirical medians (white) and asymptotic means 2log(n) (grey) are shown.
Fig 3.
Fig 3.
PNσtobs=nMσ=1 (red) when the marginal distribution (blue) is a Geometric distribution with parameter e-λtobs=10-4 and the mutation frequency θ=10-6. The crossover point ncross is 5624 cells.
Fig 4.
Fig 4.
PNσtobs=nMσ=1 (red) when the marginal clonotype size distribution (blue) is a Logarithmic distribution (left) or a Yule-Simon distribution (right), with parameters p=1-10-5 for Logarithmic distribution and ρ=0.1 for Yule-Simon distribution. Mutation frequency θ=10-6 in both cases. The crossover point ncross equals to 326 cells under Logarithmic distribution, and ncross=14270 under Yule-Simon distribution.
Fig 5.
Fig 5.
Simulated repertoire of cel=1000 cells comprising clo=100 non-empty clonotypes (encasing circles). The 287 mutant cells are orange/rust, and the remaining 713 wild-type cells are grey, giving a realized mutant frequency 0.287. As predicted mathematically, the larger clonotypes have an over-representation of mutant cells. Sampling uniformly among clonotypes, the average extant clonotype size is 10.0 cells; given the sampled clonotype contains a mutant cell, the average clonotype size is 16.0 cells. On the other hand, sampling uniformly among cells, the average clonotype size of the sampled cell (i.e., with size bias) is 23.0 cells. The average clonotype size when sampling mutant cells, however, is even larger, at 27.7 cells. This synthetic data was simulated from a Bose-Einstein clone-size model and a Luria-Delbrück mutation model, with mutation frequency θ=0.05.
Fig 6.
Fig 6.
Comparison of expected diversity scores between sampling from whole repertoire or just the mutant fraction, under various Geometric (left) and Logarithmic (right) distributions. The range of Geometric parameter γ0 and logarithmic parameter p is determined to match a clonotype of approximately 102 to 105 cells, in expectation. Other parameters are fixed as sampling fraction ϵ=10-4, overall number of clonotypes clo=107 and mutation probability in each division θ=10-6. Expected diversity is always lower in the mutant fraction, in line with Proposition 4
Fig 7.
Fig 7.
Association of average somatic burden with clonotype size, in the PBMC3 repertoire. There are 5659 singleton clonotypes, 278 duplexes, and a total of 22 clonotypes with sizes greater than 2 . The largest clonotype contains 41 cells. Clonotypes of size 3 to 20 cells are combined together as a single class considering the small sample size. Pointwise 95% confidence intervals are computed from a quasi-Poisson generalized linear model.

References

    1. Albertini R. J. (2001). HPRT mutations in humans: biomarkers for mechanistic studies. Mutation Research/Reviews in Mutation Research 489 1–16. - PubMed
    1. Albertini R. J., Castle K. L. and Borcherding W. R. (1982). T-cell cloning to detect the mutant 6-thioguanine-resistant lymphocytes present in human peripheral blood. Proceedings of the National Academy of Sciences 79 6617–6621. - PMC - PubMed
    1. Albertini R. J., Nicklas J. A., O’Neill J. P. and Robison S. H. (1990). In vivo somatic mutations in humans: measurement and analysis. Annual review of genetics 24 305–326. - PubMed
    1. Aldous D. (1996). Probability Distributions on Cladograms. In Random Discrete Structures 1–18. Springer.
    1. Angerer W. P. (2001). An explicit representation of the Luria-Delbrück distribution. Journal of mathematical biology 42 145–174. - PubMed

Publication types