[Preprint]. 2023 Jul 19:2023.04.25.537883.
doi: 10.1101/2023.04.25.537883.

Spatial distribution of hand-grasp motor task activity in spinal cord functional magnetic resonance imaging

Affiliations

Spatial distribution of hand-grasp motor task activity in spinal cord functional magnetic resonance imaging

Kimberly J Hemmerling et al. bioRxiv. .

Update in

Abstract

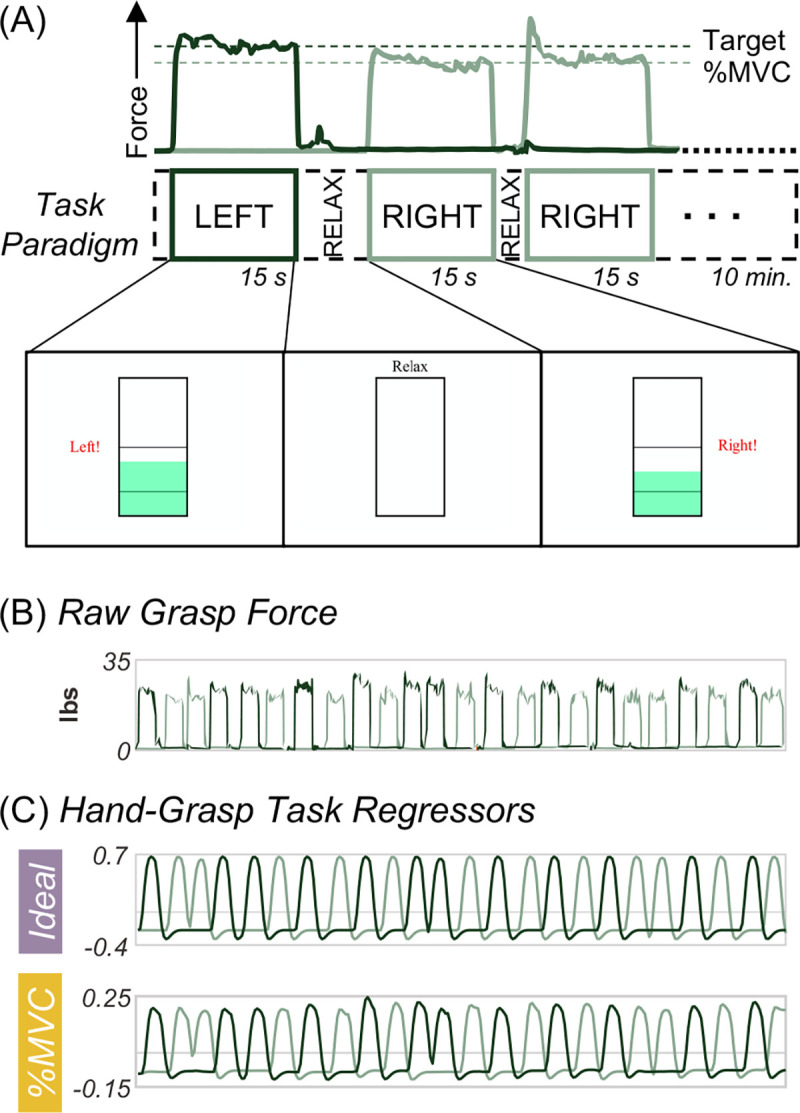
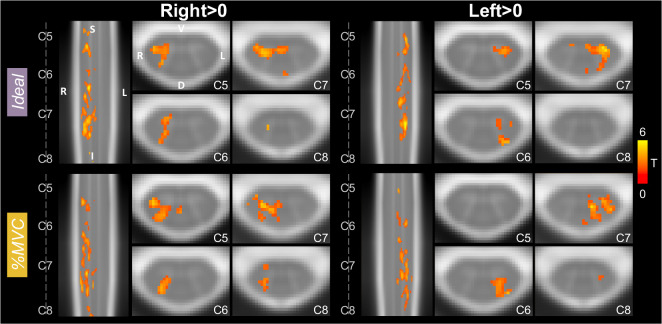
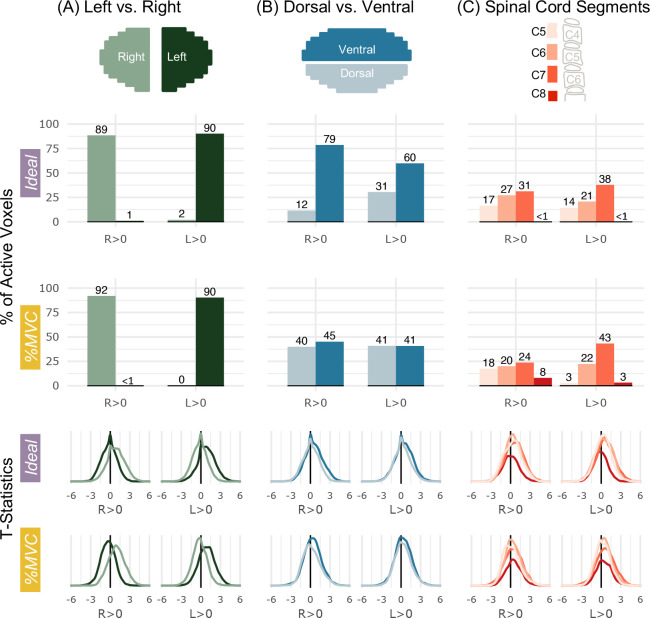
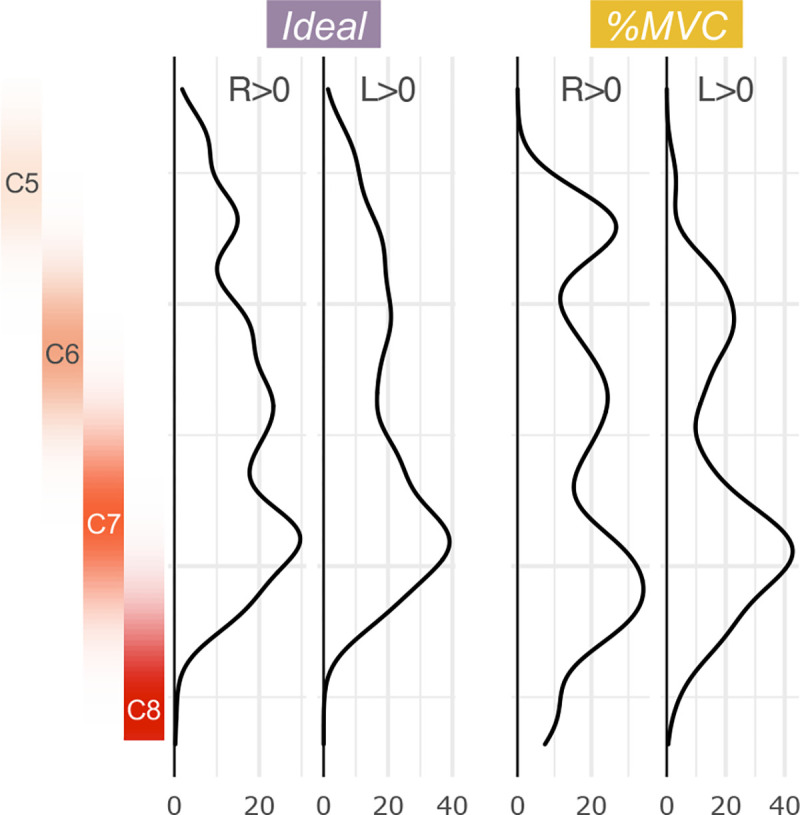
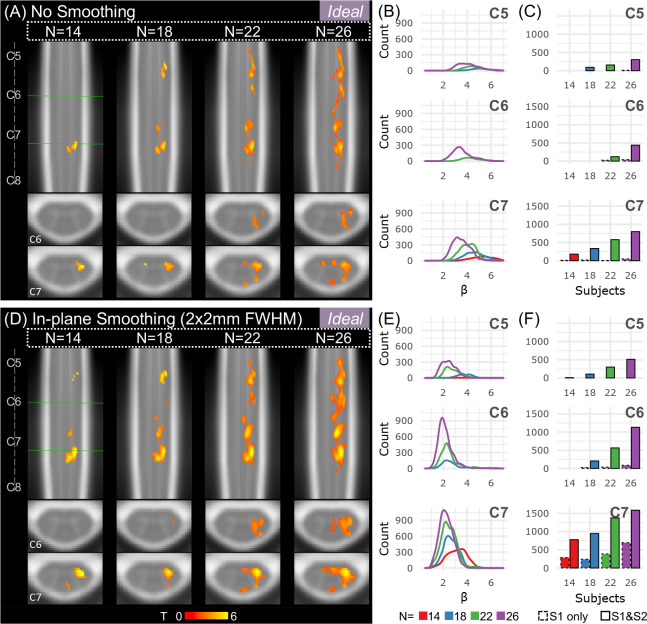
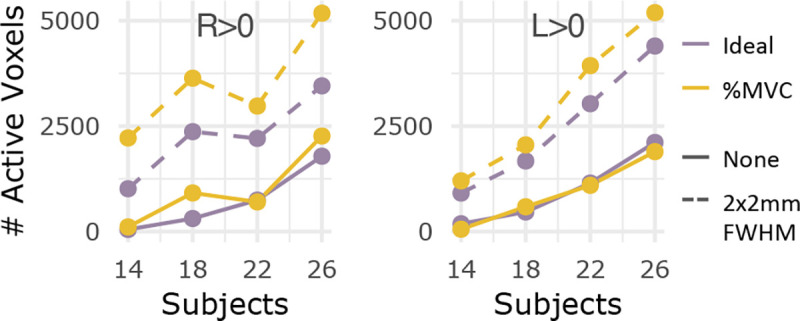
Upper extremity motor paradigms during spinal cord functional magnetic resonance imaging (fMRI) can provide insight into the functional organization of the cord. Hand-grasping is an important daily function with clinical significance, but previous studies of similar squeezing movements have not reported consistent areas of activity and are limited by sample size and simplistic analysis methods. Here, we study spinal cord fMRI activation using a unimanual isometric hand-grasping task that is calibrated to participant maximum voluntary contraction (MVC). Two task modeling methods were considered: (1) a task regressor derived from an idealized block design (Ideal) and (2) a task regressor based on the recorded force trace normalized to individual MVC (%MVC). Across these two methods, group motor activity was highly lateralized to the hemicord ipsilateral to the side of the task. Activation spanned C5-C8 and was primarily localized to the C7 spinal cord segment. Specific differences in spatial distribution are also observed, such as an increase in C8 and dorsal cord activity when using the %MVC regressor. Furthermore, we explored the impact of data quantity and spatial smoothing on sensitivity to hand-grasp motor task activation. This analysis shows a large increase in number of active voxels associated with the number of fMRI runs, sample size, and spatial smoothing, demonstrating the impact of experimental design choices on motor activation.


Figures

Figure 1.
Figure 1.. Hand-grasping motor task and task regressors for fMRI modeling.
(A) First three trials of task paradigm including the grasp force recording to a target %MVC and a representation of the real-time visual feedback (i.e., moving green bar) as the participant is grasping during functional scans. (B) The unprocessed grasp force that is used for visual feedback and is recorded. (C) The two hand-grasp task regressors: Ideal and %MVC. The Ideal regressor was modeled as a binary block design task, convolved with the canonical HRF, and demeaned. The %MVC regressor is the grasp force recording normalized to participant MVC, convolved with the canonical HRF, and demeaned. All panels are from the same example participant.
Figure 2.
Figure 2.. Spinal cord hand-grasp group-level activation maps.
Activation maps for each model (Ideal, %MVC) for the Right Grasp>0 and Left Grasp>0 contrasts. Significant t-statistics are shown (p<0.05, FWE-corrected). One representative sagittal slice and 4 axial slices within each spinal cord segment are shown. Probabilistic spinal cord segments are indicated. Note, images are in radiological view.
Figure 3.
Figure 3.. Group average tSNR map after denoising.
The tSNR after modeling with the Ideal regressor was calculated for each subject and scan, warped to PAM50 template space, and averaged voxelwise across all subjects and scan sessions. The same representative sagittal and axial slices as Fig. 2 are shown. The average gray matter tSNR across spinal cord segments is C5: 20.14, C6: 20.18, C7: 20.07, and C8: 17.80. The average white matter tSNR across spinal cord segments is C5: 18.30, C6: 18.65, C7: 18.64, and C8: 16.92. See Fig. 4C for a depiction of the spinal cord segment masks tSNR was calculated within. Only one map is shown because there is no visually discernable difference between the tSNR maps after denoising using the Ideal or %MVC model.
Figure 4.
Figure 4.. Spatial distribution of significantly active voxels in spinal cord ROIs for Ideal and %MVC models for grasping with the right and left hands.
Schematic representations of the ROI masks are shown in the top row. (A) The percent of total active voxels and distribution of t-statistics in the left and right hemicords. The left and right hemicord masks have a 3-voxel midline between the masks. (B) The percent of total active voxels and distribution of t-statistics in the ventral and dorsal hemicords. (C) The percent of total active voxels and distribution of t-statistics that are in spinal cord segments C5-C8. Probabilistic spinal cord segments were thresholded and binarized to create segment masks. Note, active voxels are tallied within these probabilistic masks so there are many voxels not counted as they fall between these segment ROIs. The C8 segment is only partial because it is at the boundary of the field of view. Percentages do not add up to 100 because some active voxels may not fall outside of the ROI mask bounds.
Figure 5.
Figure 5.. Rostrocaudal distribution of hand-grasp motor activation for the Ideal and %MVC models.
The number of active voxels in each axial slice of the group-level activation maps is represented by a density plot for the right and left grasping tasks. Probabilistic spinal cord segments are shown to the left. The activation peak is in the C7 spinal cord segment; however, substantial activation is observed throughout the cord.
Figure 6.
Figure 6.. Effects of sample size and spatial smoothing on activation mapping and parameter estimates for the Ideal model, L>0.
(A) Spinal cord activation map for each sample size: N=14, 18, 22, and 26 participants (S1 & S2). Significant t-statistics are shown (p<0.05, FWE-corrected). (B) Density plot distribution of significant parameter estimates for each probabilistic spinal cord segment: C5, C6, and C7 (S1 & S2). (C) Number of active voxels in each cord segment for incremental sample sizes using only 1 run (S1 only, 10 min) or 2 runs (S1 & S2, 20 min) for each probabilistic spinal cord segment: C5, C6, and C7. Significant voxels in the C8 segment were very few so are not shown. (D-F) Same as A-C for data that were smoothed in-plane within a spinal cord mask using a 2×2mm2 FWHM Gaussian smoothing kernel.
Figure 7.
Figure 7.. Number of active voxels across sample sizes, with and without smoothing for S1 & S2.
The number of significantly active voxels are plotted for sample sizes N=14, 18, 22, and 26 using both fMRI runs (S1 & S2) without smoothing (solid line) and with smoothing (dashed line). Color indicates which task regressor was used for modeling (Ideal, %MVC). The R>0 and L>0 contrasts are shown here.

References

    1. Yoshizawa T., Nose T., Moore G. J., & Sillerud L. O. (1996). Functional magnetic resonance imaging of motor activation in the human cervical spinal cord. NeuroImage, 4(3 Pt 1), 174–182. 10.1006/nimg.1996.0068 - DOI - PubMed
    1. Ogawa S., Lee T. M., Nayak A. S., & Glynn P. (1990). Oxygenation-sensitive contrast in magnetic resonance image of rodent brain at high magnetic fields. Magnetic resonance in medicine, 14(1), 68–78. 10.1002/mrm.1910140108 - DOI - PubMed
    1. Landelle C., Lungu O., Vahdat S., Kavounoudias A., Marchand-Pauvert V., De Leener B., & Doyon J. (2021). Investigating the human spinal sensorimotor pathways through functional magnetic resonance imaging. NeuroImage, 245, 118684. 10.1016/j.neuroimage.2021.118684 - DOI - PubMed
    1. Powers J. M., Ioachim G., & Stroman P. W. (2018). Ten Key Insights into the Use of Spinal Cord fMRI. Brain sciences, 8(9), 173. 10.3390/brainsci8090173 - DOI - PMC - PubMed
    1. Raj D., Anderson A. W., & Gore J. C. (2001). Respiratory effects in human functional magnetic resonance imaging due to bulk susceptibility changes. Physics in medicine and biology, 46(12), 3331–3340. 10.1088/0031-9155/46/12/318 - DOI - PubMed

Publication types