[Preprint]. 2023 Jul 19:2023.07.18.549527.
doi: 10.1101/2023.07.18.549527.

A modular chemigenetic calcium indicator enables in vivo functional imaging with near-infrared light

Affiliations

A modular chemigenetic calcium indicator enables in vivo functional imaging with near-infrared light

Helen Farrants et al. bioRxiv. .

Update in

  • A modular chemigenetic calcium indicator for multiplexed in vivo functional imaging.
    Farrants H, Shuai Y, Lemon WC, Monroy Hernandez C, Zhang D, Yang S, Patel R, Qiao G, Frei MS, Plutkis SE, Grimm JB, Hanson TL, Tomaska F, Turner GC, Stringer C, Keller PJ, Beyene AG, Chen Y, Liang Y, Lavis LD, Schreiter ER. Farrants H, et al. Nat Methods. 2024 Oct;21(10):1916-1925. doi: 10.1038/s41592-024-02411-6. Epub 2024 Sep 20. Nat Methods. 2024. PMID: 39304767 Free PMC article.

Abstract

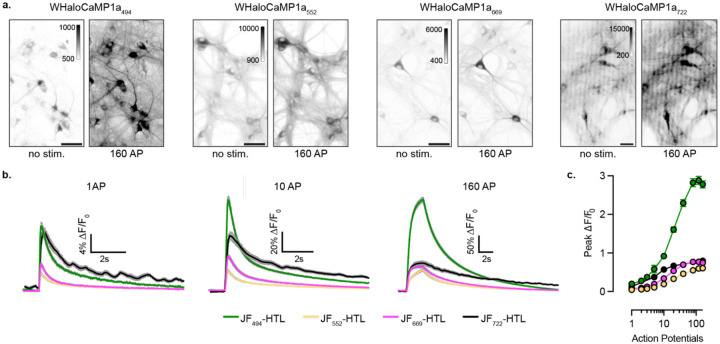
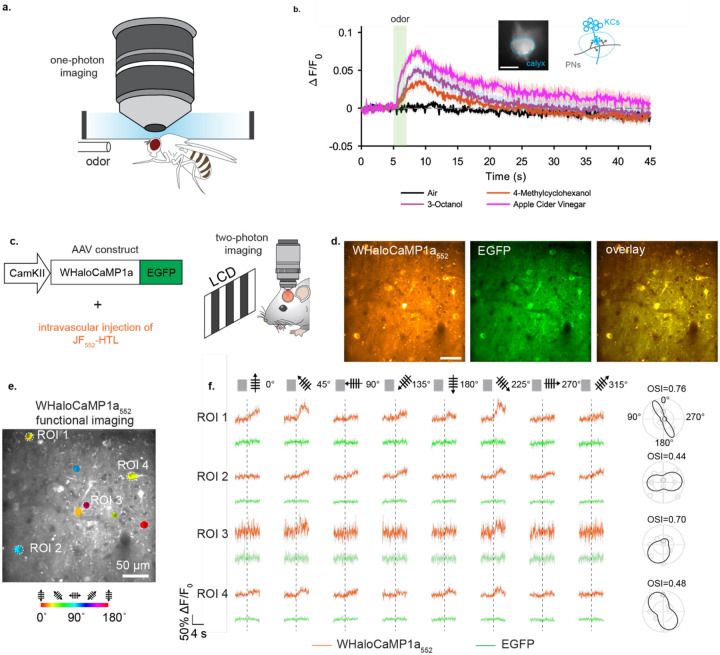
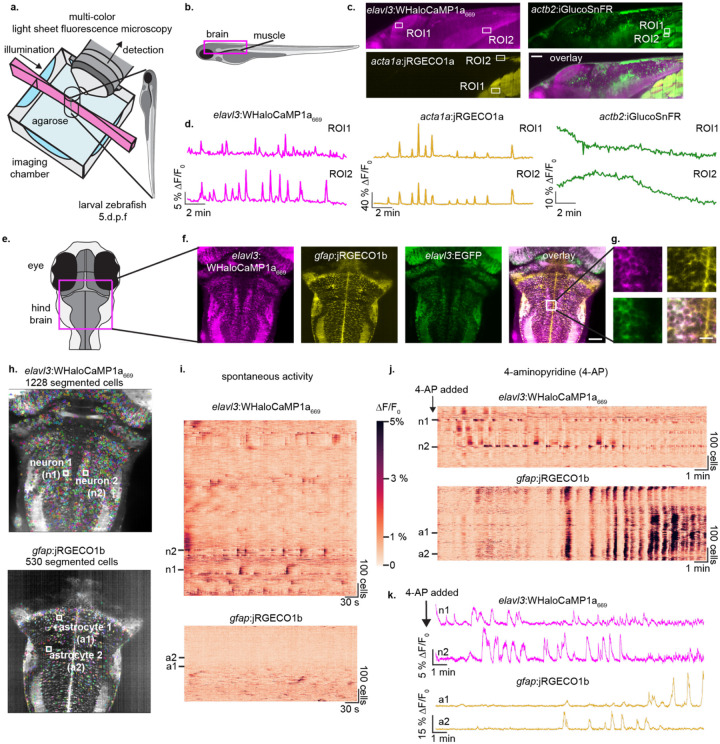
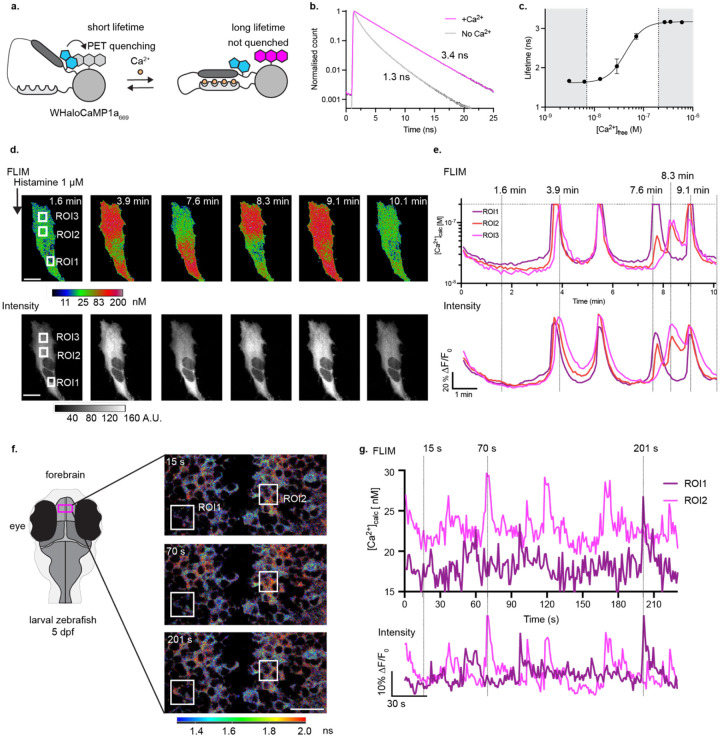
Genetically encoded fluorescent calcium indicators have revolutionized neuroscience and other biological fields by allowing cellular-resolution recording of physiology during behavior. However, we currently lack bright, genetically targetable indicators in the near infrared that can be used in animals. Here, we describe WHaloCaMP, a modular chemigenetic calcium indicator built from bright dye-ligands and protein sensor domains that can be genetically targeted to specific cell populations. Fluorescence change in WHaloCaMP results from reversible quenching of the bound dye via a strategically placed tryptophan. WHaloCaMP is compatible with rhodamine dye-ligands that fluoresce from green to near-infrared, including several dye-ligands that efficiently label the central nervous system in animals. When bound to a near-infrared dye-ligand, WHaloCaMP1a is more than twice as bright as jGCaMP8s, and shows a 7× increase in fluorescence intensity and a 2.1 ns increase in fluorescence lifetime upon calcium binding. We use WHaloCaMP1a with near-infrared fluorescence emission to image Ca2+ responses in flies and mice, to perform three-color multiplexed functional imaging of hundreds of neurons and astrocytes in zebrafish larvae, and to quantitate calcium concentration using fluorescence lifetime imaging microscopy (FLIM).


Conflict of interest statement

Competing interests H. F. and E. R. S. have filed patent applications on tryptophan-containing chemigenetic fluorescent indicators. L. D. L. and J. B. G have filed patents and patent applications on fluorinated and azetidine-containing rhodamines.

Figures

Figure 1.
Figure 1.. Engineering chemigenetic calcium indicators with tryptophan quenching
a, Chemical structure of JF669-HaloTag ligand (HTL). b, Crystal structure of HaloTag7 bound to JF669-HaloTag ligand (HaloTag669) (PDBID 8SW8). The position of G171, which was mutated to a tryptophan to quench dye fluorescence emission, and R179, where calcium sensitive protein domains were inserted, are highlighted as spheres. c, Normalized absorption (solid lines) and fluorescence emission (dashed lines) spectra of JF669-HaloTag ligand bound to HaloTag7 or HaloTag7 G171W mutant. d, Schematic representation of WHaloCaMP, showing domain arrangement, covalent binding of the dye-ligand, and the quenching tryptophan. e, Primary structure of WHaloCaMP1a (top) and ΔF/F0 of variants (bottom) from a bacterial lysate screen to select WHaloCaMP1a. f, Normalized absorption (solid lines) and fluorescence emission (dashed lines) spectra of JF669-HaloTag ligand bound to purified WHaloCaMP1a in the presence (magenta) and absence (black) of calcium. g, Chemical structures of dye-ligands used here with WHaloCaMP1a (left), and normalized Ca2+ titrations of WHaloCaMP1a bound to these dye-ligands (right).
Figure 2.
Figure 2.. Characterization of WHaloCaMP1a in neuronal cultures
a, Representative images of cultured rat hippocampal neurons expressing WHaloCaMP1a labeled with dye-ligands unstimulated or stimulated with 160 induced action potentials (APs) at 80 Hz Scale bars, 50 μm. b, ΔF/F0 response of WHaloCaMP1a expressed in cultured rat hippocampal neurons and labeled with the indicated dye-ligands to trains of APs at 80 Hz. Solid line (mean) and grey outline (s.e.) for n = 130–165 neurons for JF494-HTL, JF552-HTL, JF669-HTL and n = 20 for JF722-HTL. c, Peak ΔF/F0 as a function of the number of APs at 80 Hz. Data are presented as mean and s.e. for n = 130–165 neurons for JF494-HTL, JF552-HTL, JF669-HTL and n = 20 for JF722-HTL.
Figure 3.
Figure 3.. WHaloCaMP1a reports on neuronal activity in flies and mice
a, One-photon imaging set-up of head-fixed flies expressing WHaloCaMP1a labeled with dye-ligands. b, Fluorescence responses from WHaloCaMP1a669 in head-fixed flies presented with different odors. WHaloCaMP1a was expressed in mushroom body Kenyon cells (KCs). Images were acquired from the calyx, where KCs receive dendritic inputs from the olfactory projection neurons (PNs) (insets). Green shading indicates odor presentation for 2 s. Data were from 6 flies, and odors were presented three times for each fly. The thick line and shaded areas indicate means and s.e.m. across odor trials. Scale bar, 50 μm. c, AAV construct for transducing neurons in mouse V1 and the schematic of the experimental setup for two-photon functional imaging of WHaloCaMP1a in the visual cortex of mice. JF552-HTL was intravascularly injected one day before examining orientation selectivity of V1 neurons in the anesthetized mouse exposed to moving grafting visual stimuli of different orientations and directions. d, Representative images of a field-of-view in mouse V1 showing neurons expressing WHaloCaMP1a552 or EGFP. Scale bar, 50 μm. e, Functional imaging of V1 neurons shows the orientations selectivity map. Scale bar, 50 μm. f, Functional imaging of Ca2+ (WHaloCaMP1a552 channel) or control (EGFP channel) traces (ROI1–4) in response to drifting gratings in directions show above the traces. Orientation selectivity index (OSI) of cells is shown in the right panel. Imaging rate was 15 Hz. Representative imaging session from three imaging sessions shown.
Figure 4.
Figure 4.. Three color multiplexed functional imaging in zebrafish larvae
a, Light sheet imaging set-up for multiplexed imaging. b, Schematic of side-view zebrafish larvae highlighting field of view for three color multiplexed functional imaging of glucose and Ca2+ in muscles and neurons. c, Representative images of WHaloCaMP1a expressed in neurons via the elavl3 promoter, iGlucoSnFR expressed from the actb2 ubiquitous promotor and jRGECO1a expressed in muscle via the acta1a promotor. Scale bar, 50 μm. d, Fluorescence ΔF/F0 traces of WHaloCaMP1a669, jRGECO1a and iGlucoSnFR in ROIs outlined in b. Representative experiment from 3 zebrafish larvae imaged. e, Schematic of the zebrafish larvae’s head indicating the field-of-view for light sheet imaging of neuronal and astrocyte activity. f, representative images of the expression patterns of WHaloCaMP1a669-EGFP expressed under the elavl3 promoter, jRGECO1b expressed under the gfap promotor. Scale bar, 50 μm. g, Zoomed in images showing single cell resolution of fluorescent signals in the hind brain. Scale bar, 20 μm. h, Images of suite2p and Cellpose segmented cells from simultaneous functional imaging of WHaloCaMP1a669 and jRGECO1b. i, Rastermaps of activity from 1228 segmented neurons (top) and 530 astrocytes (bottom) during spontaneous brain activity. Two neurons (n1 and n2) indicate the hind brain oscillator. Two astrocytes (a1 and a1) are also indicated. j, 4-Aminopyridine (4-AP) was added to the imaging chamber of the zebrafish larva imaged in i, and functional imaging was performed. Concatenation of three imaging blocks of 6.2 minutes each. k, Fluorescence ΔF/F0 traces of n1 and n2 (top) and a1 and a2 (bottom) after addition of 4-AP.
Figure 5.
Figure 5.. Quantitative Ca2+ measurements by florescence lifetime imaging microscopy (FLIM) using WHaloCaMP1a
a, Schematic of WHaloCaMP1a bound to a dye-ligand used as a FLIM probe. Tryptophan quenching modulates the fluorescence lifetime. b, Normalized fluorescence lifetime of WHaloCaMP1a669 in the presence or absence of Ca2+, fit to a three-component fluorescence decay. c, Calibration curve of averaged fluorescence lifetime of WHaloCaMP1a669 vs. [Ca2+]. The white box indicates the range where WHaloCaMP1a669 can be used to make quantitative measurements of [Ca2+]. Performed with purified protein. Mean of three replicates and s.d. plotted. d, Pseudocolored concentration (top) and intensity images (bottom) of WHaloCaMP1a669 in HeLa cells after histamine addition. Scale bar, 20 μm. Color bar indicates [Ca2+], calculated from a calibration curve of fluorescence lifetime. e, Quantitative [Ca2+] calculated from a FLIM calibration curve (top), and fluorescence traces ΔF/F0 calculated from the intensity channel (bottom) in the histamine stimulated HeLa cells in the ROIs highlighted in d. Calibrated WHaloCaMP1a669 can only be used to measure [Ca2+] up to 200 nM, indicated by a dashed horizontal line. Dashed lines vertical indicated time points in the time series at which images in d are shown. f, FLIM of WHaloCaMP1a669 in live zebrafish larvae showing spontaneous neuronal activity in the forebrain. Schematic indicating field of view during imaging (left). Overlaid images of FLIM and intensity using the Leica LASX software, with color bar indicating the fluorescence lifetime. Scale bar, 20 μm. g, [Ca2+] calculated from a FLIM calibration curve (top), and fluorescence traces ΔF/F0 calculated from the intensity channel (bottom) over time for two neurons in the forebrain of zebrafish larvae from the ROIs indicated in f. Dashed lines indicated time points of images in f. Representative images from three imaging sessions.

References

    1. Kim T.H. & Schnitzer M.J. Fluorescence imaging of large-scale neural ensemble dynamics. Cell 185, 9–41 (2022). - PMC - PubMed
    1. O’Banion C.P. & Yasuda R. Fluorescent sensors for neuronal signaling. Current Opinion in Neurobiology 63, 31–41 (2020). - PubMed
    1. Sabatini B.L. & Tian L. Imaging neurotransmitter and neuromodulator dynamics in vivo with genetically encoded indicators. Neuron 108, 17–32 (2020). - PubMed
    1. Liu P., Mu X., Zhang X.-D. & Ming D. The near-infrared-II fluorophores and advanced microscopy technologies development and application in bioimaging. Bioconjugate Chemistry 31, 260–275 (2020). - PubMed
    1. Farrants H. & Tebo A.G. Fluorescent chemigenetic actuators and indicators for use in living animals. Current Opinion in Pharmacology 62, 159–167 (2022). - PubMed

Publication types