[Preprint]. 2024 Apr 29:2023.07.13.548699.
doi: 10.1101/2023.07.13.548699.

Bidirectional Regulation of Motor Circuits Using Magnetogenetic Gene Therapy Short: Magnetogenetic Regulation of Motor Circuits

Affiliations

Bidirectional Regulation of Motor Circuits Using Magnetogenetic Gene Therapy Short: Magnetogenetic Regulation of Motor Circuits

Santiago R Unda et al. bioRxiv. .

Update in

  • Bidirectional regulation of motor circuits using magnetogenetic gene therapy.
    Unda SR, Pomeranz LE, Marongiu R, Yu X, Kelly L, Hassanzadeh G, Molina H, Vaisey G, Wang P, Dyke JP, Fung EK, Grosenick L, Zirkel R, Antoniazzi AM, Norman S, Liston CM, Schaffer C, Nishimura N, Stanley SA, Friedman JM, Kaplitt MG. Unda SR, et al. Sci Adv. 2024 Oct 11;10(41):eadp9150. doi: 10.1126/sciadv.adp9150. Epub 2024 Oct 9. Sci Adv. 2024. PMID: 39383230 Free PMC article.

Abstract

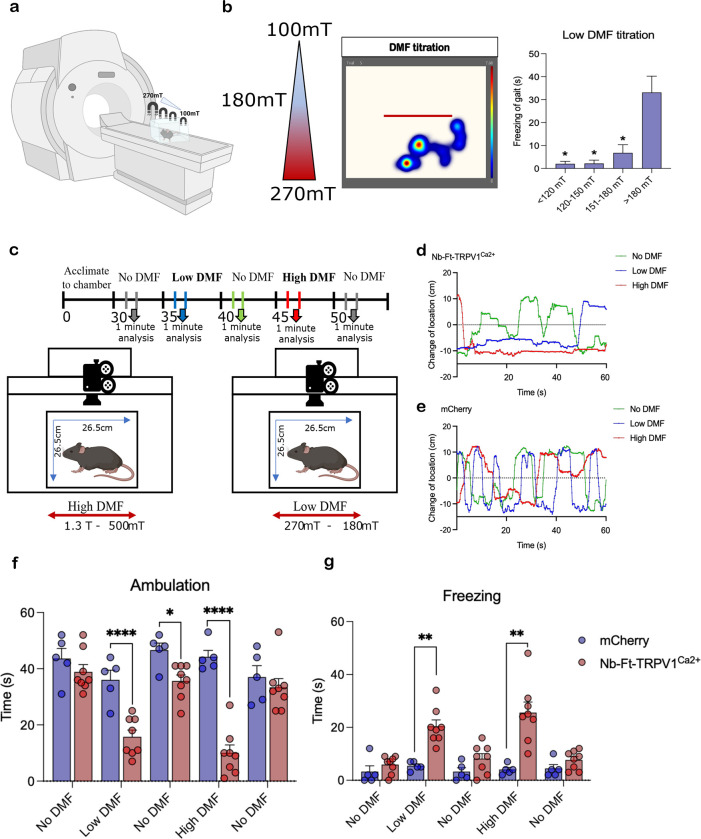
Here we report a novel suite of magnetogenetic tools, based on a single anti-ferritin nanobody-TRPV1 receptor fusion protein, which regulated neuronal activity when exposed to magnetic fields. AAV-mediated delivery of a floxed nanobody-TRPV1 into the striatum of adenosine 2a receptor-cre driver mice resulted in motor freezing when placed in an MRI or adjacent to a transcranial magnetic stimulation (TMS) device. Functional imaging and fiber photometry both confirmed activation of the target region in response to the magnetic fields. Expression of the same construct in the striatum of wild-type mice along with a second injection of an AAVretro expressing cre into the globus pallidus led to similar circuit specificity and motor responses. Finally, a mutation was generated to gate chloride and inhibit neuronal activity. Expression of this variant in subthalamic nucleus in PitX2-cre parkinsonian mice resulted in reduced local c-fos expression and motor rotational behavior. These data demonstrate that magnetogenetic constructs can bidirectionally regulate activity of specific neuronal circuits non-invasively in-vivo using clinically available devices.


Conflict of interest statement

Competing interest The authors declare no competing interests.

Figures

Fig. 1.
Fig. 1.. Generation and validation of ferritin binding nanobodies for magnet stimulation.
Serial dilutions of nanobodies or BSA (100ul) were incubated on plates coated with human spleen ferritin (1ug/ml) and binding quantified by ELISA after incubation with anti-HA-HRP antibody. A. Quantification of anti-ferritin nanobodies from CDR3 groups 6 and 26 binding to human spleen ferritin. B. Oscillating magnetic field treatment (465kHz, 30mT) significantly increases calcium-dependent SEAP release from 293T cells transfected with Nb-GFP-TRPV1Ca2+, Nb-Ft-2-TRPV1Ca2+ and Nb-Ft-14-TRPV1Ca2+ and GFP-mFerritin. Data analyzed by two-tailed, unpaired t-test with Welch’s correction. Nb-GFP-TRPV1Ca2+, basal vs. RF * p = 0.04, n = 8 & 8; Nb-Ft-2-TRPV1Ca2+, basal vs. RF * p = 0.02, n = 7 & 8; Nb-Ft-14-TRPV1Ca2+, basal vs. RF * p = 0.04, n = 7 & 8. C. Normalized Fluo-4 fluorescence (ΔF/F0) in Neuro2A cells expressing Nb-Ft-2-TRPV1Ca2+ with (786 cells) or without (1659 cells) magnet treatment. Data were analyzed by two-way ANOVA with Tukey’s multiple comparison test, **** p < 0.0001. D. Cumulative change in ΔF/F0 of Neuro2A cells expressing Nb-Ft-2-TRPV1Ca2+ with (786 cells) or without (1659 cells) magnet treatment. Data were analyzed by Mann Whitney U test **** p < 0.0001. E. Changes in RCaMP fluorescence normalized to baseline fluorescence (ΔF/F0) with magnet treatment of HEK-293T cells expressing RCaMP alone (54 cells), TRPV1Ca2+ (107 cells) or Nb-Ft-2-TRPV1Ca2+ (101 cells). Error bars represent mean +/−SEM. F. Cumulative change in ΔF/F0 with magnet treatment of HEK-293T cells expressing RCaMP alone (54 cells), TRPV1Ca2+ (107 cells) or Nb-Ft-2-TRPV1Ca2+ (101 cells). AUC was calculated for the period of magnet exposure between 48–180 seconds (after focus adjustment) and analyzed by ordinary one-way ANOVA with Tukey’s multiple comparison test, **** p < 0.0001. Data are shown as mean ± SD.
Fig. 2.
Fig. 2.. Selective viral-mediated expression of Nb-Ft-TRVP1Ca2+ in striatal iSPNs elicit parkinsonian motor behavior.
A. Schema of the double-floxed Cre-dependent AAV vector expressing the Nb-Ft-TRVP1Ca2+ or mCherry under the control of the JET promoter, and immunostaining for HA in Adora-2A (A2a)-Cre mice demonstrates selective expression of the AAV- Nb-Ft-TRVP1Ca2+ in dorsal striatum. B. Selective transduction of D2-type iSPN with RNA in-situ hybridization (ISH). Co-localization of D2-type (green) iSPN with mCherry (red). C. Protocol and Schema for direct magnetic field (DMF) neural activation to assess motor behavior. D. Example of altered motor activity during bilateral striatal pre-DMF (green), DMF (red) and post-DMF (blue) stimulation; individual lines represent the path of a single mouse. Effect of DMF stimulation on E. Ambulation bout duration, and F. Freezing of gait in mCherry (blue bars/dots, n=10) and Nb-Ft-TRVP1Ca2+ (red bars/dots, n=10) mice. Error bars show SEM. ** represents p value < 0.01, **** represents p value <0.0001 with two-tailed, unpaired t-test with Welch’s correction .
Fig. 3.
Fig. 3.. Nb-Ft-TRPV1Ca2+ in D2 iSPNs stimulated with high DMF and low DMF treatment produce freezing of gait.
A. Schema for low direct magnetic field (DMF) titration. B. Magnetic field strength and individual activity heatmap example of motor activity during bilateral striatal Low DMF titration in Nb-Ft-TRPV1Ca2+ expressing mice. Freezing of gait in different magnetic field gradients in the Low DMF titration ranges (blue bars, n=5) in Nb-Ft-TRPV1Ca2+ expressing mice. C. Protocol and schema for High DMF and Low DMF stimulation in A2a-Cre mice injected with the double-floxed Cre-dependent AAV vector expressing the Nb-Ft-TRPV1Ca2+ or mCherry under the control of the JET promoter. Representative tracking data of change of location in D. Nb-Ft-TRPV1Ca2+ and E. mCherry A2a-Cre mice during High DMF (red line), Low DMF (blue line), and No DMF (green line) treatment. Effect of High DMF and Low DMF stimulation on F. Ambulation and G. Freezing of gait in Nb-Ft-TRPV1Ca2+ (red dot/bars, n= 8) and mCherry (blue dots/bars, n=5). Error bars show SEM. * represents p value < 0.05, ** represents p value < 0.01, **** represents p value < 0.0001 with two-tailed, unpaired t-test with Welch’s correction .
Fig. 4.
Fig. 4.. Nb-Ft-TRPV1Ca2+ increases c-fos expression and cerebral metabolism upon DMF treatment.
A. Immunostaining for c-fos (cyan) and HA or RFP (red) of dorsal striatum of A2a-Cre mice euthanized 1 hour following 15 minutes of DMF exposure. B. Percentage (%) of c-fos positive (+) neurons over total number of iSPNs expressing HA or RFP (n=5 mice per group/3 sections per mice). C. Correlation between c-fos expression and freezing of gait during DMF exposure (n=5 mice per group). D. Protocol and schema for 18-FDG micro-PET/CT scans procedure and analysis with representative micro-PET/CT imaging of A2a-Cre mouse brains expressing the Nb-Ft-TRPV1Ca2+ or the mCherry control virus following DMF exposure. 18-FDG uptake in dorsal striatum calculated as the percentage of injected dose/weight (%ID/g), E. DMF over baseline ratio. F. DMF over baseline normalized to cerebellum, in mCherry (blue bars/dots, n=8) and Nb-Ft-TRPV1Ca2+ (red bars/dots, n=8) mice. G. Correlation between DMF over baseline 18-FDG uptake ratio and freezing of gait during DMF exposure (n=10). Error bars show SEM. * represents p value < 0.05, ** represents p value < 0.01, *** represents p value < 0.001 with two-tailed, unpaired t-test with Welch’s correction. Anti-HA staining to detect Nb-Ft-TRVP1Ca2+ expression, anti-RFP staining to detect mCherry expression.
Fig. 5.
Fig. 5.. Nb-Ft-TRPV1Ca2+ increases calcium transients in dorsal striatum.
A. Schema of the double-floxed Cre-dependent AAV vector expressing the Nb-Ft-TRPV1Ca2+ or mCherry under the control of the JET promoter (red) combined with double floxed Cre-dependent AAV vector expressing GCaMP6s under the control of the Syn promoter (green). Behavioral methodology to assess calcium transients during pre-DMF (green), DMF (red), and post-DMF (blue) treatment. B. Activity trace example of altered motor activity during bilateral striatal pre-DMF (green), DMF (red), and post-DMF (blue) stimulation in an Nb-Ft-TRPV1Ca2+ mouse with heatmap of GCaMP fluorescence aligned to pre-DMF (left), DMF (middle), and post-DMF (right) of the same animal shown in activity trace example expressing the Nb-Ft-TRPV1Ca2+ vector. C. Mean fluorescence aligned to pre-DMF, DMF, and post-DMF in Nb-Ft-TRPV1Ca2+ group (n=3). D. Activity trace example of altered motor activity during bilateral striatal pre-DMF (green), DMF (red), and post-DMF (blue) stimulation in an mCherry mouse with heatmap of GCaMP fluorescence aligned to pre-DMF (left), DMF (middle), and post-DMF (right) for the same animal shown in activity trace example expressing the mCherry vector. E. Mean fluorescence aligned to pre-DMF, DMF, and post-DMF in the mCherry group (n=4) F. Freezing of gait (FOG), G. Average delta (Δ) F/F (%) during pre-DMF, DMF, and post-DMF stimulation. H. Correlation between ΔF/F (%) calcium transients and FOG during DMF treatment. Error bars show SEM. * represents p value < 0.05 with two-tailed, unpaired t-test with Welch’s correction.
Fig. 6.
Fig. 6.. Transcranial magnetic stimulation (TMS) treatment increases Nb-Ft-TRPV1Ca2+ mediated motor freezing and calcium transients in dorsal striatum.
A. Schema of the TMS set up and A2a-Cre mice with bilateral injection of the double-floxed Cre-dependent AAV vector expressing the Nb-Ft-TRPV1Ca2+ or mCherry under the control of the JET promoter (red) combined with double floxed Cre-dependent AAV vector expressing GCaMP6s under the control of the Syn promoter (green) in dorsal striatum. B. Activity trace example of altered motor activity during baseline (left) and TMS (right) treatment in an mCherry mouse (blue), and Nb-Ft-TRPV1Ca2+ mouse (red). Distance ambulated during baseline (left) and TMS (right) treatment in the C. mCherry group (blue), and D. Nb-Ft-TRPV1Ca2+ group (red). (n=4–5; data presented as the mean ± SEM in grey.). E. Average distance during baseline and TMS treatment in mCherry (blue) and Nb-Ft-TRPV1Ca2+ groups. F. Mean fluorescence during baseline in Nb-Ft-TRPV1Ca2+ (red) and mCherry (blue) mice (n=3; data presented as the mean ± SEM). G. Mean fluorescence during 20 seconds of TMS triggers every 2 seconds in Nb-Ft-TRPV1Ca2+ (red) and mCherry (blue) mice (n=3–4; data presented as the mean ± SEM). H. Grouped bar graph of Nb-Ft-TRPV1Ca2+ (red) and mCherry (blue) mice during baseline, and 20 seconds of TMS triggers every 2 seconds (n=3–4). Error bars show SEM. ** represents p value < 0.01, *** represents p value < 0.001 with two-tailed, unpaired (or paired when baseline vs TMS comparison were done) t-test with Welch’s correction.
Fig. 7.
Fig. 7.. Selective viral-mediated expression of Nb-Ft-TRPV1Ca2+ in the striatopallidal pathway elicit parkinsonian motor behavior in wild type mice.
A. Schema of the double-floxed Cre-dependent AAV vector expressing the Nb-Ft-TRPV1Ca2+ or mCherry under the control of the JET promoter in striatal iSPN projecting to the Gp achieved by Gp injection of a retrograde AAV2 vector carrying Cre-GFP, and immunostaining for GFP (green), HA (red) in wt mice demonstrates selective expression of the AAV- Nb-Ft-TRPV1Ca2+ in dorsal striatum iSPN projecting to the Gpe, white arrows show colocalization of GFP with HA. B. Example of altered motor activity during bilateral striatopallidal pre-DMF (green), DMF (red) and post-DMF (blue) stimulation, lines represent the mouse’s path. Effect of DMF stimulation on C. Ambulation bout duration, and D. Freezing of gait in mCherry (blue bars/dots, n=8) and Nb-Ft-TRPV1Ca2+ (red bars/dots, n=8) mice. E. Immunostaining for c-fos (cyan) and HA (Nb-Ft-TRVP1Ca2+; red) or RFP (mCherry; red) of dorsal striatum of wt mice euthanized 1 hour following 15 minutes of DMF exposure. White arrows show co-localization. F. Percentage (%) of c-fos positive (+) neurons over total number of iSPNs expressing HA or RFP (n=3 mice per group/3 sections per mice). G. Schema of the double-floxed Cre-dependent AAV vector expressing the Nb-Ft-TRPV1Ca2+ or TRPV1Ca2+ under the control of the JET promoter in striatal iSPNs projecting to the Gp achieved by Gp injection of a retrograde AAV2 vector carrying Cre-GFP. Effect of DMF stimulation on H. Ambulation bout duration, and I. Freezing of gait in TRPV1Ca2+ (blue bars/dots, n=5) and Nb-Ft-TRPV1Ca2+ (red bars/dots, n=7) mice. Error bars show SEM. ** represents p value < 0.01, *** represents p value < 0.001 with two-tailed, unpaired t-test with Welch’s correction .
Fig. 8.
Fig. 8.. Mutant Nb-Ft-TRPV1Cl− inhibits neuronal activity of subthalamic nucleus projection neurons and rescues motor impairment in parkinsonian mice.
A. Schema of inhibition system with mutant Nb-Ft-TRPV1Cl− membrane channel. B. Normalized change in MQAE fluorescence Intensity (ΔF/F0) of Neuro2A cells expressing mCherry, TRPV1Ca2+ or Nb-Ft-TRPV1Cl− with low AMF application in vitro. C. AUC analysis of chloride imaging for Nb-Ft-TRPV1Cl− channel. D. Protocol and schema for generation of parkinsonian PitX-2-Cre mice with unilateral injection of 6 hydroxydopamine (6-OHDA) in the medial forebrain bundle (MFB), followed by randomization based contralateral rotations induced by i.p. administration of apomorphine (0.25mg/kg) and ipsilateral intracranial injection of the double-floxed Cre-dependent AAV vector expressing the mutant Nb-Ft-TRPV1Cl− under the control of the JET promoter in the subthalamic nucleus (STN). Representative immunostaining of the selective expression of Nb-Ft-TRPV1Cl− (red) in STN neurons expressing Cre recombinase (Green). E. Percentage of change from pre-DMF treatment in contralateral rotations induced with apomorphine (0.25mg/kg, i.p.) in parkinsonian PitX-2-Cre mice expressing the Nb-Ft-TRPV1Cl− or the mCherry control viruses in the STN during DMF, and post-DMF. F. Immunostaining for c-fos (cyan) and HA or mCherry (red) of STN of PiX-2-Cre mice euthanized 1 hour following 15 minutes of DMF exposure with apomorphine induced rotations (0.25mg/kg).G. Number of transduced neurons per area in STN between mCherry and Nb-Ft-TRPV1Ca2+ groups. H. Percentage (%) of c-fos positive (+) neurons over total number of STN neurons expressing HA or RFP (n=4 mice per group/3 sections per mice). Error bars show SEM. * represents p value < 0.05, ** represents p value < 0.01 with two-tailed, unpaired t-test with Welch’s correction. Anti-HA staining to detect Nb-Ft-TRVP1Ca2+ expression, anti-RFP staining to detect mCherry expression.

Similar articles

References

    1. Krauss J. K. et al., Technology of deep brain stimulation: current status and future directions. Nat Rev Neurol 17, 75–87 (2021). - PMC - PubMed
    1. Benabid A. L., Chabardes S., Mitrofanis J., Pollak P., Deep brain stimulation of the subthalamic nucleus for the treatment of Parkinson’s disease. Lancet Neurol 8, 67–81 (2009). - PubMed
    1. Boyden E. S., Zhang F., Bamberg E., Nagel G., Deisseroth K., Millisecond-timescale, genetically targeted optical control of neural activity. Nat Neurosci 8, 1263–1268 (2005). - PubMed
    1. Deisseroth K., Optogenetics. Nat Methods 8, 26–29 (2011). - PMC - PubMed
    1. Munshi R. et al., Magnetothermal genetic deep brain stimulation of motor behaviors in awake, freely moving mice. Elife 6, (2017). - PMC - PubMed

Publication types