[Preprint]. 2023 Jul 18:2023.07.12.548746.
doi: 10.1101/2023.07.12.548746.

Gene expression variation underlying tissue-specific responses to copper stress in Drosophila melanogaster

Affiliations

Gene expression variation underlying tissue-specific responses to copper stress in Drosophila melanogaster

Elizabeth R Everman et al. bioRxiv. .

Update in

Abstract

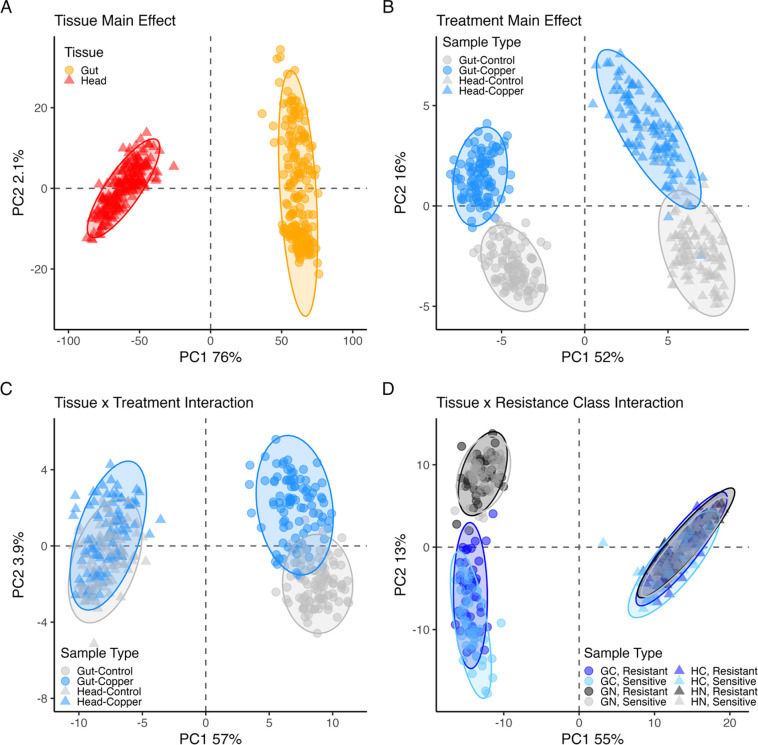
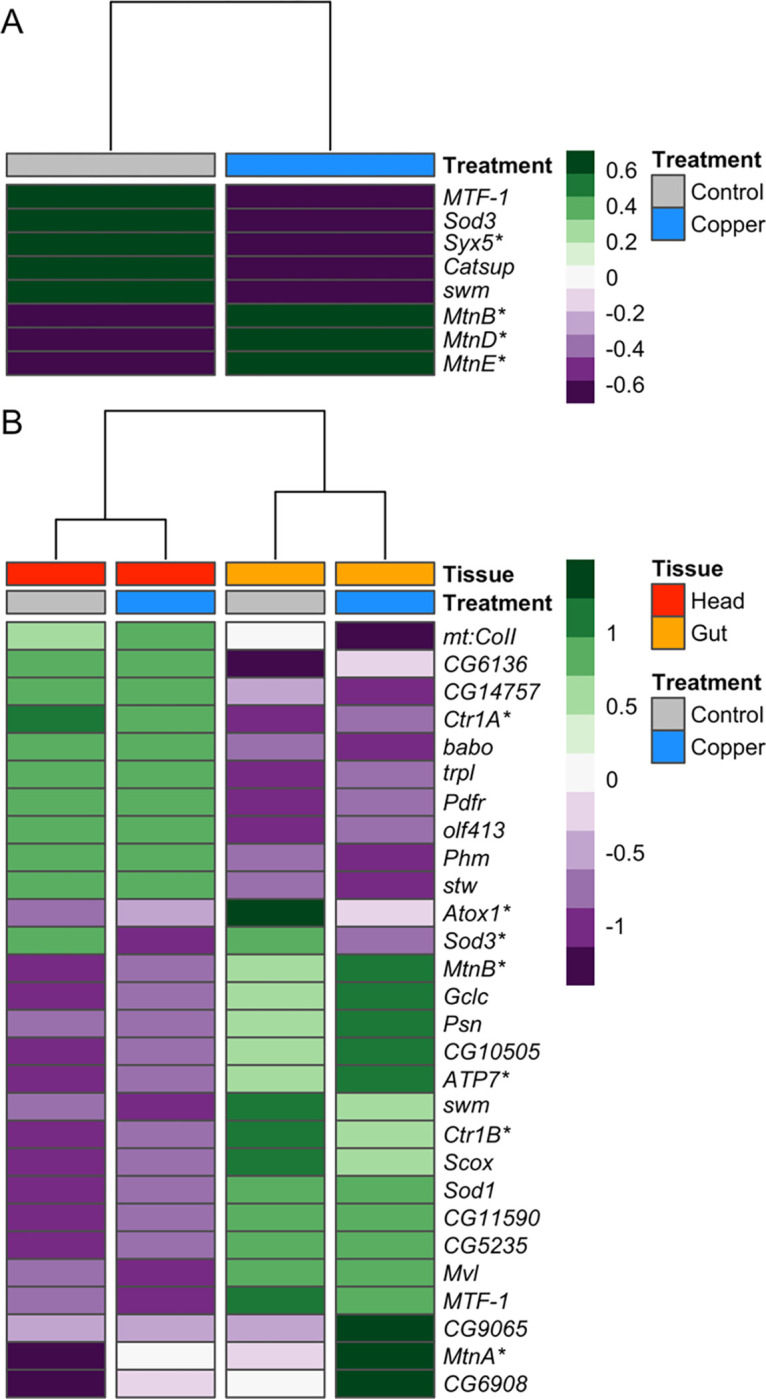
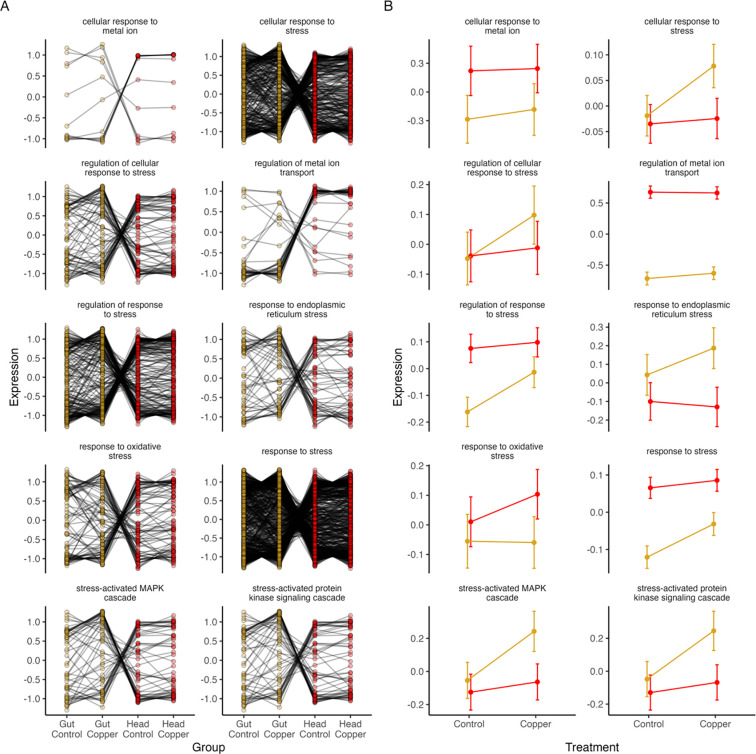
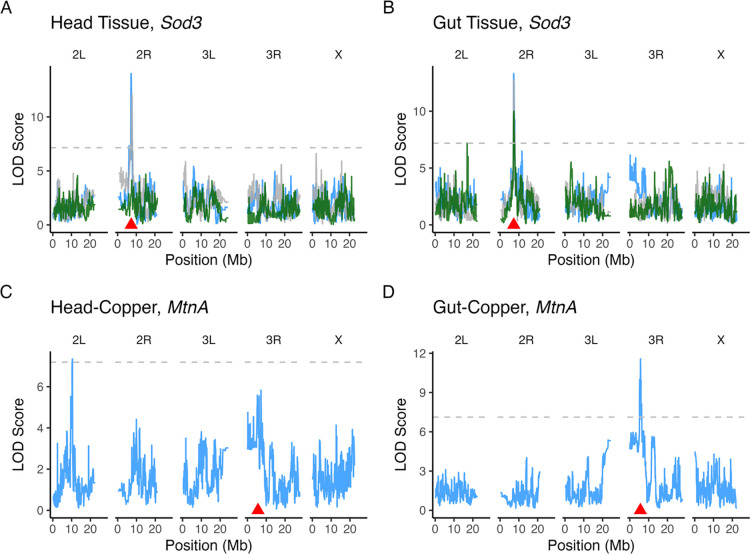
Copper is one of a handful of biologically necessary heavy metals that is also a common environmental pollutant. Under normal conditions, copper ions are required for many key physiological processes. However, in excess, copper quickly results in cell and tissue damage that can range in severity from temporary injury to permanent neurological damage. Because of its biological relevance, and because many conserved copper-responsive genes also respond to other non-essential heavy metal pollutants, copper resistance in Drosophila melanogaster is a useful model system with which to investigate the genetic control of the response to heavy metal stress. Because heavy metal toxicity has the potential to differently impact specific tissues, we genetically characterized the control of the gene expression response to copper stress in a tissue-specific manner in this study. We assessed the copper stress response in head and gut tissue of 96 inbred strains from the Drosophila Synthetic Population Resource (DSPR) using a combination of differential expression analysis and expression quantitative trait locus (eQTL) mapping. Differential expression analysis revealed clear patterns of tissue-specific expression, primarily driven by a more pronounced gene expression response in gut tissue. eQTL mapping of gene expression under control and copper conditions as well as for the change in gene expression following copper exposure (copper response eQTL) revealed hundreds of genes with tissue-specific local cis-eQTL and many distant trans-eQTL. eQTL associated with MtnA, Mdr49, Mdr50, and Sod3 exhibited genotype by environment effects on gene expression under copper stress, illuminating several tissue- and treatment-specific patterns of gene expression control. Together, our data build a nuanced description of the roles and interactions between allelic and expression variation in copper-responsive genes, provide valuable insight into the genomic architecture of susceptibility to metal toxicity, and highlight many candidate genes for future functional characterization.

Keywords: DSPR; eQTL mapping; gene expression; heavy metals.


Conflict of interest statement

Conflict of Interest The authors declare no conflicts of interest.

Figures

Figure 1.
Figure 1.
Gene expression varied between tissues and treatments. Here we employ PCA to depict variation in gene expression in the top differentially-expressed genes with FDR < 0.05 and log fold change > 1 for four significant model terms. Each PCA was carried out with a different set of genes: A. 5031 genes, B. 59 genes, C. 113 genes, D. 341 genes. The effect of tissue on gene expression is shown in (A) but is also evident in all other plots. B. Gene expression shifted in both head and gut tissue in response to copper exposure. C. Gene expression shifted in response to copper treatment in both head and gut tissue. Shifts were typically in the same direction in both tissues with a slightly higher magnitude response observed for genes in gut tissue relative to head, leading to the interaction. D. Tissue and resistance class interacted to influence gene expression, although the effect of resistance class was slight. The significant interaction was driven by a larger magnitude difference in expression between sensitive and resistant strains in the gut tissue in response to copper. In all plots, triangle symbols indicate head samples, circles indicate gut samples. Log2, quantile-normalized gene expression data were corrected for the effect of sequencing pool prior to clustering analysis.
Figure 2.
Figure 2.
Treatment and the interaction between treatment and tissue influenced expression of several genes previously shown to be involved in detoxification, homeostasis, or binding of copper and other heavy metals. A. Heatmap of genes differentially expressed due to treatment that have been previously associated with copper ion response. B. Heatmap of genes differentially expressed due to the interaction between tissue and treatment. In both heatmaps, tissue and treatment groups are indicated at the top of the heatmaps, and gene expression is presented as average normalized expression for strains belonging to the two resistance classes. Asterisks beside gene names highlight genes discussed in text.
Figure 3.
Figure 3.
778 genes with a significant tissue by treatment interaction effect could be classified by their involvement in stress response pathways. A. At the gene level, mean expression across DSPR strains under copper and control conditions in gut and head tissue demonstrated many distinct tissue and treatment specific patterns of expression response to copper. B. When expression was summarized at the level of GO category, we found that most genes that are involved in cellular response to stress, regulation of stress response, response to endoplasmic reticulum stress, and involvement in stress-activated MAPK and protein kinase signaling had a more pronounced response in gut tissue compared to head tissue. Conversely, genes involved in the response to oxidative stress had a more consistently pronounced response in head tissue compared to gut tissue. Data shown are mean expression response for all genes in each treatment and tissue combination +/− SE. In both plots, gold indicates gut samples; red indicates head samples.
Figure 4.
Figure 4.
Many genes (53.7%) were associated with eQTL in multiple datasets, but these eQTL were often localized to distinct intervals. A. and B. Expression of the gene Sod3 was associated with cis eQTL in all datasets except Head-Response. C. and D. The gene MtnA was associated with a trans eQTL on chromosome arm 2L in the Head-Copper dataset (C) and was associated with a cis eQTL in the Gut-Control dataset (D). In all plots, the dashed horizontal line indicates the significance threshold based on permutation and the red triangle point indicates the position of the gene. LOD curves are colored based on treatment: gray = Control, blue = Copper, green = Response.
Figure 5.
Figure 5.
eQTL shared between control and copper conditions are influenced by regulatory variants in a consistent manner across treatments. A. and D. Genes previously linked to copper response, toxicity response, and oxidative stress (metal response genes) shifted in expression level in response to copper treatment in head (A) and gut (D) tissue. B. and E. Founder haplotype estimated effects for shared eQTL were similar under copper and control conditions for both metal response (blue) and non-metal response genes (grey) in head (B) and gut (E) tissues. C. and F. Percent variance explained by shared eQTL estimated in control and copper conditions was positively correlated but indicated larger effects on expression under copper conditions (C, Head Tissue: F3,1496 = 529, r2 = 51%, P < 0.0001; F, Gut Tissue: F3,1258 = 312.2, r2 = 43%, P < 0.0001). We found an interaction between percent variance estimates under control and copper conditions for metal response vs non-metal response gene in gut tissue, suggesting that the additive shift in effect size was greater for metal response gene expression variation under copper conditions. In both C and F the dashed line indicates the 1:1 slope to illustrate the reduced slopes of the regressions. Solid lines indicate the best fit using glm estimation and shading indicates the 95% confidence interval of the regression.
Figure 6.
Figure 6.
Enrichment of GO categories for Response eQTL genes by tissue (head tissue = 197 genes; gut tissue = 316) and for the set of eQTL genes that were shared between tissues (Shared-Response, 19 genes).
Figure 7.
Figure 7.
We detected enrichment for trans eQTL in all datasets and tissues. Several hotspots (primarily near centromere regions) were detected in multiple tissues and datasets. The majority of trans eQTL hotspots were detected in Response datasets in both head and gut tissue.
Figure 8.
Figure 8.
Three genes had complete mediating effects on the composite eQTL peak for hotspot H11. A. Including Jon65Aiv (bottom purple line), Jon65Aiii, and yip7 (top purple lines) individually as covariates accounted for the composite QTL peak for H11 (black line). No other gene encompassed by the H11 composite peak had a strong mediating effect on the composite peak (green lines). B. Estimated founder haplotype effects at the composite QTL peak and at a cis eQTL associated with Jon65Aiv were significantly negatively correlated (Pearson r = −99%; p < 0.001). C. STRING analysis of the three candidate mediating genes and genes with a trans eQTL peak at the hotspot suggests that the candidate mediating genes are co-expressed with trans eQTL genes rather than having a regulatory role. Black edges indicate co-expression, green edges indicate similarity through textmining, light blue edges indicate protein homology, and dark blue edges indicate gene co-occurrence.
Figure 9.
Figure 9.
One gene had a partial mediating effect on the composite eQTL peak for hotspot G11. A. Including Jon74E (purple line) as a covariate in QTL analysis of the G11 composite variable accounted for the composite QTL peak for H11 (black line). No other gene encompassed by the G11 composite peak had a strong mediating effect on the composite peak (green lines). B. Estimated founder haplotype effects at the composite QTL peak and at a cis eQTL associated with Jon74E were significantly negatively correlated (Pearson r = −98%; p < 0.001). C. STRING analysis of the candidate mediating gene and genes with a trans eQTL peak at the hotspot did not provide any insight into the link between the candidate mediator and the genes with trans eQTL in the hotspot.

Similar articles

References

    1. Åkesson A., Bjellerup P., Lundh T., Lidfeldt J., Nerbrand C., et al., 2006. Cadmium-induced effects on bone in a population-based study of women. Environ. Health Perspect. 114: 830–834. 10.1289/ehp.8763 - DOI - PMC - PubMed
    1. Albert F. W., Bloom J. S., Siegel J., Day L., and Kruglyak L., 2018. Genetics of trans-regulatory variation in gene expression. eLife 7: e35471. 10.7554/eLife.35471 - DOI - PMC - PubMed
    1. Alsheikh A. J., Wollenhaupt S., King E. A., Reeb J., Ghosh S., et al., 2022. The landscape of GWAS validation; systematic review identifying 309 validated non-coding variants across 130 human diseases. BMC Med. Genomics 15: 74. 10.1186/s12920-022-01216-w - DOI - PMC - PubMed
    1. Arvanitis M., Tayeb K., Strober B. J., and Battle A., 2022. Redefining tissue specificity of genetic regulation of gene expression in the presence of allelic heterogeneity. Am. J. Hum. - PMC - PubMed
    1. Genet. 109: 223–239. 10.1016/j.ajhg.2022.01.002 - DOI

Publication types