[Preprint]. 2023 Jul 19:2023.07.19.549370.
doi: 10.1101/2023.07.19.549370.

Human Cytomegalovirus in breast milk is associated with milk composition, the infant gut microbiome, and infant growth

Affiliations

Human Cytomegalovirus in breast milk is associated with milk composition, the infant gut microbiome, and infant growth

Kelsey E Johnson et al. bioRxiv. .

Update in

Abstract

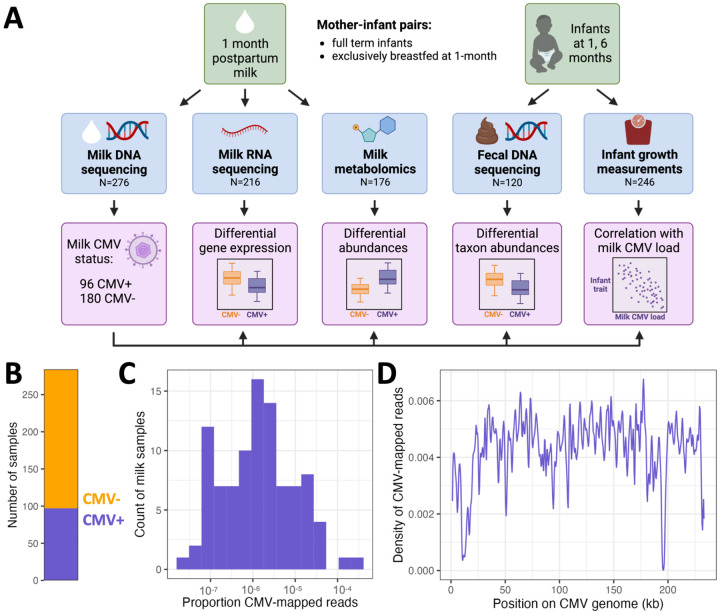
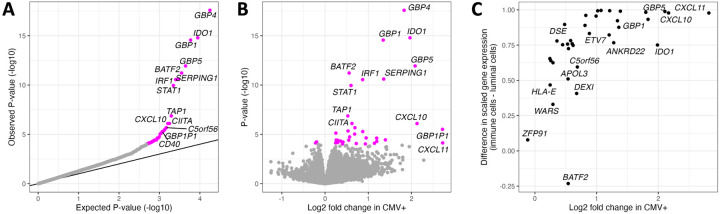
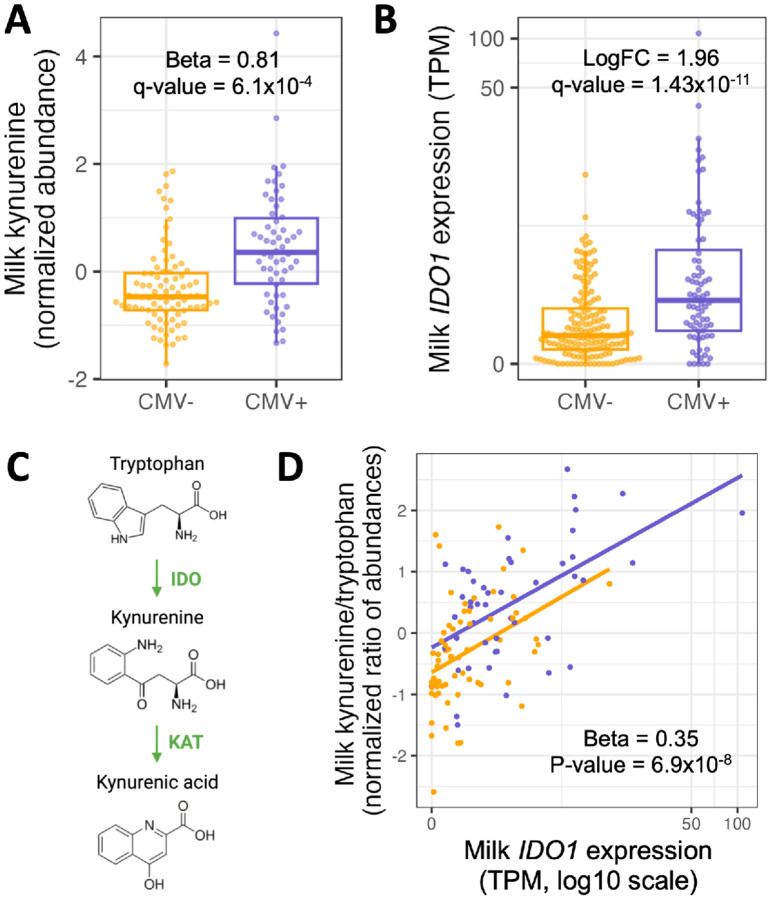
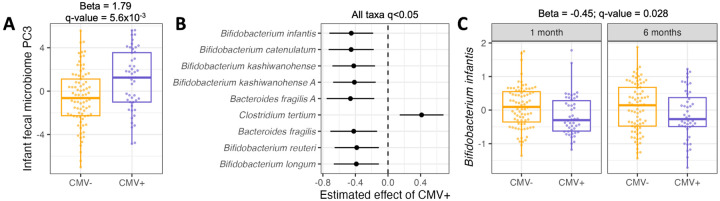
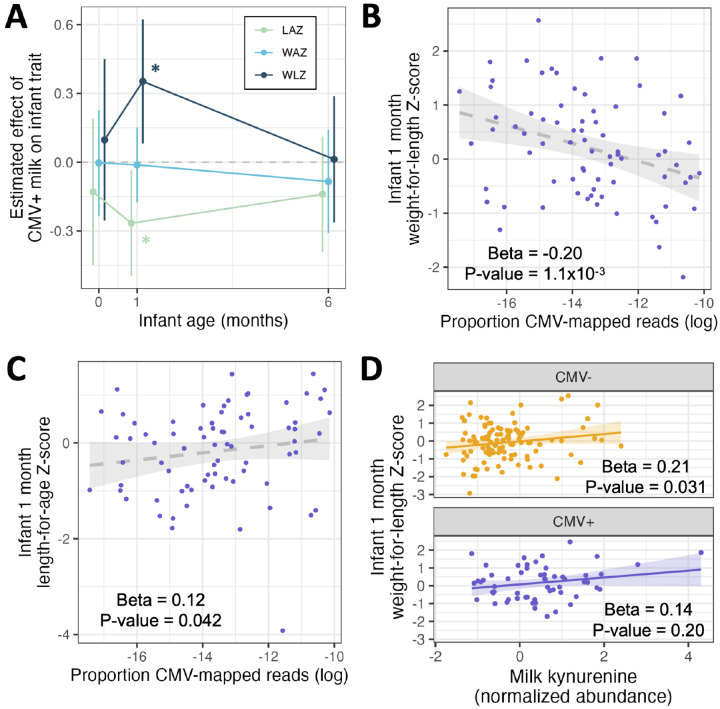
Human cytomegalovirus (CMV) is a highly prevalent herpesvirus that is often transmitted to the neonate via breast milk. Postnatal CMV transmission can have negative health consequences for preterm and immunocompromised infants, but any effects on healthy term infants are thought to be benign. Furthermore, the impact of CMV on the composition of the hundreds of bioactive factors in human milk has not been tested. Here, we utilize a cohort of exclusively breastfeeding full term mother-infant pairs to test for differences in the milk transcriptome and metabolome associated with CMV, and the impact of CMV in breast milk on the infant gut microbiome and infant growth. We find upregulation of the indoleamine 2,3- dioxygenase (IDO) tryptophan-to-kynurenine metabolic pathway in CMV+ milk samples, and that CMV+ milk is associated with decreased Bifidobacterium in the infant gut. Our data indicate a complex relationship between milk CMV, milk kynurenine, and infant growth; with kynurenine positively correlated, and CMV viral load negatively correlated, with infant weight-for-length at 1 month of age. These results suggest CMV transmission, CMV-related changes in milk composition, or both may be modulators of full term infant development.


Conflict of interest statement

Declaration of interests The authors declare no competing interests.

Figures

Figure 1.
Figure 1.
(A) Study overview. (B) Count of milk samples identified as CMV+ (N=97, purple) or CMV− (N=187, orange). (C) The distribution of CMV-mapped DNA reads, as a proportion of all DNA reads, across milk samples that had at least one read mapped to the CMV genome. (D) Density of CMV-aligned reads across the CMV genome from all CMV+ milk samples. The density refers to the fraction of all CMV-mapped reads aligned to a particular region of the CMV genome. The density dips close to zero at repetitive regions in the CMV genome.
Figure 2.
Figure 2.
Differential gene expression analysis comparing CMV− to CMV+ milk samples. (A) QQ-plot from the results of differential gene expression analysis. The x-axis plots the expected P-value for the number of genes tested following a uniform distribution of P-values from 0 to 1, and the y-axis plots the observed P-values. Genes whose P-value was below the false discovery rate threshold of 5% are colored in magenta. (B) Volcano plot comparing estimated effect sizes of CMV+ on milk gene expression (x-axis) with each gene’s P-value (y-axis). Genes whose P-value was below the false discovery rate threshold of 5% are colored in magenta. (C) Comparison of log fold change in CMV+ samples from our bulk RNA-seq data (x-axis) vs. gene expression in a publicly available human milk single cell RNA-seq dataset (y-axis). Gene expression from milk single cells is plotted as the difference between scaled gene expression in immune cells and mammary luminal cells, to display that genes more highly expressed in our CMV+ milk samples tended to be more highly expressed in the immune cells in milk.
Figure 3.
Figure 3.
(A) Kynurenine abundances in CMV− (orange) vs. CMV+ (purple) milk samples. Each dot represents a milk sample. Plotted kynurenine levels (y-axis) are residuals after correcting for covariates included in the differential abundance analysis (see Methods). (B) IDO1 expression in CMV− (orange) vs. CMV+ (purple) milk samples. Each dot represents a milk sample. LogFC: log fold-change between CMV+ and CMV− samples. (C) IDO1 encodes the enzyme indoleamine 2,3-dioxygenase (IDO), which performs the rate-limiting step converting tryptophan to kynurenine. Kynurenic acid is metabolized from kynurenine by the KAT enzyme. (D) Correlation between IDO1 expression (x-axis) and the ratio of kynurenine and tryptophan abundances (y-axis) in milk samples, stratified by CMV status. Each dot represents a milk sample.
Figure 4.
Figure 4.
(A) Comparison of PC3 values for infant fecal samples fed CMV− (orange) vs. CMV+ (purple) breastmilk. Principal component analysis was performed on the taxon abundance table for infant fecal samples at 1 month of age. Each dot represents an infant fecal sample. Plotted PC3 levels are residuals after correcting for covariates included in the association analysis with milk CMV status (see Methods). (B) Estimated effect of CMV+ milk on normalized microbial taxa abundances in the infant gut, including samples from 1 and 6 months of age. All taxa listed had a P-value below a false discovery rate of 5%. Taxa are arranged from smallest (top) to largest (bottom) P-value. (C) The distribution of Bifidobacterium infantis abundances in the infant fecal microbiome, for infants fed CMV− (orange) or CMV+ (purple) milk, at 1 and 6 months of age. Plotted B. infantis levels are residuals after correcting for covariates included in the association analysis with milk CMV status (see Methods). In (B) and (C), taxon relative abundances were centered log ratio transformed and scaled to mean 0, standard deviation 1 before association analysis.
Figure 5.
Figure 5.
Results of multivariate regressions of infant anthropometric measurements vs. milk CMV status, proportion CMV-mapped reads in milk, or milk kynurenine. All regression models included the equivalent Z-score at birth as a covariate (except when the Z-score at birth was the response variable). (A) Estimated effect of CMV+ milk on infant growth metrics at birth, 1 month, and 6 months of age. Error bars represent 95% confidence intervals. *P<0.05; LAZ: length-for-age Z-score; WAZ: weight-for-age Z-score; WLZ: weight-for-length Z-score. (B) Within infants fed CMV+ milk, there was a negative correlation between the proportion of CMV-mapped reads and infant WLZ at 1 month of age. (C) Within infants fed CMV+ milk, there was a positive correlation between the proportion of CMV-mapped reads and infant WLZ at 1 month of age. (D) There was a positive correlation between the abundance of kynurenine in milk and infant WLZ at 1 month, when tested for infants fed CMV+ (orange, top) or CMV− (purple, bottom) milk separately. All plotted infant growth metrics in panels B-D are residuals after correcting for covariates included in the association analyses with milk CMV status (see Methods).

References

    1. Zuhair M. et al. Estimation of the worldwide seroprevalence of cytomegalovirus: A systematic review and meta-analysis. Rev. Med. Virol. 29, e2034 (2019). - PubMed
    1. Sinzger C. et al. Fibroblasts, epithelial cells, endothelial cells and smooth muscle cells are major targets of human cytomegalovirus infection in lung and gastrointestinal tissues. J. Gen. Virol. 76 (Pt 4), 741–750 (1995). - PubMed
    1. Hamprecht K. & Goelz R. Postnatal Cytomegalovirus Infection Through Human Milk in Preterm Infants: Transmission, Clinical Presentation, and Prevention. Clin. Perinatol. 44, 121–130 (2017). - PubMed
    1. Hamprecht K., Witzel S., Maschmann J., Speer C. P. & Jahn G. Transmission of Cytomegalovirus Infection Through Breast Milk in Term and Pretern Infants. in Short and Long Term Effects of Breast Feeding on Child Health (eds. Koletzko B., Michaelsen K. F. & Hernell O.) 231–239 (Springer US, 2002).
    1. Lazar K., Rabe T., Goelz R. & Hamprecht K. Human Cytomegalovirus Reactivation During Lactation: Impact of Antibody Kinetics and Neutralization in Blood and Breast Milk. Nutrients 12, (2020). - PMC - PubMed

Publication types