[Preprint]. 2023 Jul 18:rs.3.rs-3161761.
doi: 10.21203/rs.3.rs-3161761/v1.

Inflammation induced by tumor-associated nerves promotes resistance to anti-PD-1 therapy in cancer patients and is targetable by interleukin-6 blockade

Affiliations

Inflammation induced by tumor-associated nerves promotes resistance to anti-PD-1 therapy in cancer patients and is targetable by interleukin-6 blockade

Erez N Baruch et al. Res Sq. .

Update in

  • Cancer-induced nerve injury promotes resistance to anti-PD-1 therapy.
    Baruch EN, Gleber-Netto FO, Nagarajan P, Rao X, Akhter S, Eichwald T, Xie T, Balood M, Adewale A, Naara S, Sathishkumar HN, Islam S, McCarthy W, Mattson BJ, Ferrarotto R, Wong MK, Davies MA, Jindal S, Basu S, Roversi K, Nikpoor AR, Ahmadi M, Ahmadi A, Harwood C, Leigh I, Gong D, Tallón de Lara P, Tao DL, Davidson TM, Ajami NJ, Futreal A, Rai K, Kochat V, Castillo M, Gunaratne P, Goepfert RP, Hernandez SD, Khushalani NI, Wang J, Watowich SS, Calin GA, Migden MR, Yuan M, Liu N, Ye Y, Hwang WL, Vermeer PD, D'Silva NJ, Bunimovich YL, Yaniv D, Burks JK, Gomez J, Dougherty PM, Tsai KY, Allison JP, Sharma P, Wargo JA, Myers JN, Talbot S, Gross ND, Amit M. Baruch EN, et al. Nature. 2025 Oct;646(8084):462-473. doi: 10.1038/s41586-025-09370-8. Epub 2025 Aug 20. Nature. 2025. PMID: 40836096 Free PMC article.

Abstract

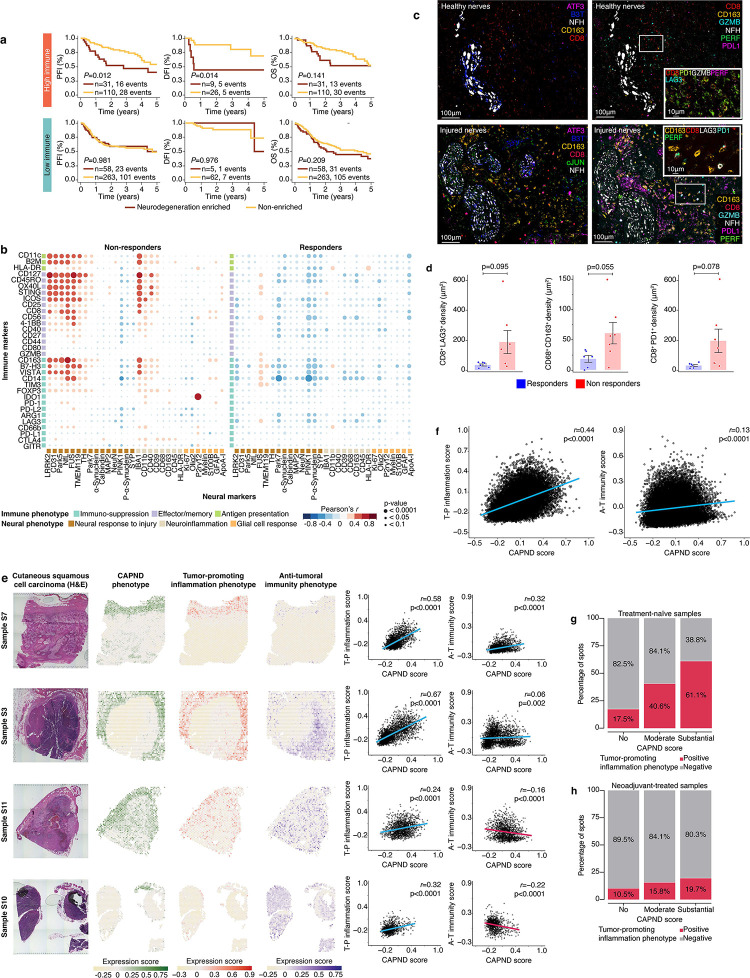
While the nervous system has reciprocal interactions with both cancer and the immune system, little is known about the potential role of tumor associated nerves (TANs) in modulating anti-tumoral immunity. Moreover, while peri-neural invasion is a well establish poor prognostic factor across cancer types, the mechanisms driving this clinical effect remain unknown. Here, we provide clinical and mechniastic association between TANs damage and resistance to anti-PD-1 therapy. Using electron microscopy, electrical conduction studies, and tumor samples of cutaneous squamous cell carcinoma (cSCC) patients, we showed that cancer cells can destroy myelin sheath and induce TANs degeneration. Multi-omics and spatial analyses of tumor samples from cSCC patients who underwent neoadjuvant anti-PD-1 therapy demonstrated that anti-PD-1 non-responders had higher rates of peri-neural invasion, TANs damage and degeneration compared to responders, both at baseline and following neoadjuvant treatment. Tumors from non-responders were also characterized by a sustained signaling of interferon type I (IFN-I) - known to both propagate nerve degeneration and to dampen anti-tumoral immunity. Peri-neural niches of non-responders were characterized by higher immune activity compared to responders, including immune-suppressive activity of M2 macrophages, and T regulatory cells. This tumor promoting inflammation expanded to the rest of the tumor microenvironment in non-responders. Anti-PD-1 efficacy was dampened by inducing nerve damage prior to treatment administration in a murine model. In contrast, anti-PD-1 efficacy was enhanced by denervation and by interleukin-6 blockade. These findings suggested a potential novel anti-PD-1 resistance drived by TANs damage and inflammation. This resistance mechanism is targetable and may have therapeutic implications in other neurotropic cancers with poor response to anti-PD-1 therapy such as pancreatic, prostate, and breast cancers.


Conflict of interest statement

Conflict of interests Kenneth Tsai serves as a consultant to NFlection Therapeutics, Sun Pharma, DXB Biosciences. Renata Ferrarotto reports Consulting or Advisory Role: Regeneron, Sanofi, Elevar Therapeutics, Remix, Eisai, Bioatlas, Coherus in the past 24 months and research Funds (Inst): Prelude, Ayala, Merck, Pfizer, Rakuten, EMD Serono, ISA, Viracta, and Gilead in the past 24 months. Neil Gross reports consulting for Intuitive Surgical, Sanofi-Genzyme, Regeneron, DragonFly Therapeutics, Merck and PDS Biotechnology. Michael A Davies has been a consultant to Roche/Genentech, Array, Pfizer, Novartis, BMS, GSK, Sanofi-Aventis, Vaccinex, Apexigen, Eisai, Iovance, Merck, and ABM Therapeutics, and he has been the PI of research grants to MD Anderson by Roche/Genentech, GSK, Sanofi-Aventis, Merck, Myriad, Oncothyreon, Pfizer, ABM Therapeutics, and LEAD Pharma. Jennifer Wargo is an inventor on a US patent application (PCT/US17/53.717) submitted by the University of Texas MD Anderson Cancer Center which covers methods to enhance immune checkpoint blockade responses by modulating the microbiome, reports compensation for speaker’s bureau and honoraria from Imedex, Dava Oncology, Omniprex, Illumina, Gilead, PeerView, Physician Education Resource, MedImmune, Exelixis and Bristol Myers Squibb, and has served as a consultant/advisory board member for Roche/Genentech, Novartis, AstraZeneca, GlaxoSmithKline, Bristol Myers Squibb, Micronoma, OSE therapeutics, Merck, and Everimmune. Dr. Wargo receives stock options from Micronoma and OSE therapeutics.

Figures

Figure 1.
Figure 1.. Nerve damage is associated with resistance to anti-PD-1 therapy.
(a) Overview of the study workflow. Tumor samples from two anti-PD-1 neoadjuvant clinical trials for cutaneous squamous cell carcinoma (cSCC, NCT03565783 and NCT04154943) were used for molecular analysis. Findings were validated using in vivo and intro models. (b) Clinical characteristics of the patients from our clinical trial cohorts. R, Responders to anti-PD-1 treatment, NR, non-responders; Tumor (T), Nodal (N), and Metastases (M) status were determined based on the AJCC 8th edition. (c) Peri-neural invasion rates in the clinical trial tumor samples according to response status (d) Representative images demonstrating expression of neural injury markers ATF3 and cJUN in tumor-associated nerves (TANs), with their distribution among neural (GFAP) and Schwan (GFAP+) components (e) Histograms of mean ± SEM ATF3 and cJUN expression levels according to response status. (f) Gene Set Enrichment Analysis (GSEA) of genes assocated with TANs proximity to cancer cells; negative Normalized Enrichment Score (NES) was −1.94. (g) Denervation (nerve elimination) mouse experiment design; biweekly anti-mouse PD-1 treatment was administered 7 days after tumor implantation. (h) Tumor growth plot (day 30) of the devenervation mouse experiment; please refer to Supplementary Figure 2 for the tumor volume bar plot. (i) Nerve injury (axotomy) experiment design; biweekly anti-mouse PD-1 treatment was administered 7 days after tumor implantation. (j) Tumor growth plot (day 39) of the axonotomy mouse experiment; Please refer to Supplementary Figure 2 for the tumor volume bar plot.
Figure 2.
Figure 2.. Cancer cells induce nerve demyelination and degeneration
(a) Scanning electron microscopy (EM) images showing a naïve dorsal root ganglia (DRG) neuron (left, inset, x50,000) with normal myelin sheath, compared to a DRG neuron that was co-culture with squamous cell carcinoma cells (SCC, round cells, right image) for 5 days; The co-cultured neuron is invaded by the SCC cells and the myelin sheath has been degraded to circular and fibrillar fragments (right, inset, x50,000). (b) Transmission EM images – low-power field images are shown in the top row and high-power field images in the bottom row. In the first column, naïve neurons demonstrate compact myelin lamella; in the second column, DRG neurons which were co-cultures with SCC cells for 5 days demonstrated disintegration of the myelin sheath; The third and fourth columns show the same pseudocolored images with the myelin and Schwann cells in yellow and green, respectively. Arrowheads label mitochondria; note the dense abnormal mitochondria on the right, which together with dmyelination indicate axonal degeneration. (c) EM images demonstrating invasion of cancer cells (red) to the nerve inner layers (nerve filaments - purpule; first column – scanning EM, second and third columns – transmission EM). (d-e) Multielectrode array recordings of normal skin (control) and cutaneous SCC showing similar baseline and reversion electrical activity with blunted evoked response in tumor specimens – electrical conduction plot in (d) showed a single cancer-normal skin match, while the bar plots at (e) showed the mean ± SEM values of the entire group (n = 5–7 per group). (f) immunofluorescence (IF) stains of tumor samples from an indepdented cutaneous SCC patient cohort (n = 86; see main text for further details). B3T, beta-3-tubulin, a general nerve marker; cJUN and ATF3, markers of nerve damage; dMBP, degraded myelin base protein, and GALC, galactosylceramidase, are both markers of demyelination. (g) Pearson’s correlation plot between markers of nerve damage and de-myelination, based on the IF stains described above. (h) Transcriptional differences in DRG neuron that were co-cultured with IC8 SCC cells (DRG-IC8) compared to DRG neurons alone; data presented in a heatmap structured by unsupervised hierarchical clustering analysis (HCA); the enriched pathways are based on Ingenuity Pathway Analysis (IPA) and their respective z-scores and p-values (Fisher’s Exact test) are shown in the adjacent chart, together with the differentiatly expressed genes (DEG) of the depicted pathways (highlighted in brown). All experiments were done in biological triplicates. (i) The heatmap shows the protein expression of neurodegeneration-associated markers enriched within intra-tumoral neural niches of non-responders patients compared with responders. Protein expression was measured by digital spatial profiling (DSP) and transformed into z-scores for representation. (j) Heatmap showing transcriptional differences between responders (R) and non-responders (NR) in neoadjuvant-treated tumor samples and the corresponding enriched pathways. See Extended figure 1 for number of samples in each analysis.
Figure 3.
Figure 3.. Cancer associated peripheral nerve degeneration (CAPND) induces tumor promoting inflammation
(a) Kaplan-Meier analyses showing progression-free interval (PFI), disease-free interval (DFI), and overall survival (OS) plots for a head and neck mucosal squamous cell carcinoma (SCC) patient cohort from the TCGA database. Analysis was stratified according to the intra-tumoral immune activity score. The patients were further stratified according to their CAPND enrichment score (see Supplementary Figure 6) – CAPND high (red) and CAPND low (yellow) patients. Log-rank test, see text for adjusted p values. (b) Bubble heatmap based on digital spatial profiling (DSP) protein matrix. The heatmap shows Pearson’s correlation coefficients between immune and neural proteins expressed specifically in the peri-neural niche of of neoadjuvant-treated tumor samples of the clinical trial cohort. (c) Multiplex-immunofluorescence (IF) stains of healthy (NFH+B3T+ATF3, top panels) and damages (ATF3+cJUN+, bottom panels) tumor-associated nerves (TANs). The area around the nerves (i.e., peri-neural niche) was stained for CD163 (tumor associated macropahges), CD8 (effector T-cells), LAG3 and PD1 (immune checkpoints), and Gramzyme B and perforin (cytotoxic proteins). (d) Bar plots representing IF-based cell density according to clinical response to anti-PD-1 therapy. (e-g) Spatial transcriptomic analysis of tumor samples fron an independent treatment naïve cutaneous SCC patient cohort (see main text for full details). This analysis assessed the co-localization of three phenotypes: CAPND, tumor-promoting inflammation, and anti-tumoral immunity (55μm resolution per spot). The signature scores (normalized and zero-centered) obtained for each spot were overlaid on their respective tissue region, showing the proportional content and spatial distribution and overlap of the different phenotypes. The correlation between CAPND, the tumor-promoting(T-P) inflammation, and the anti-tumoral (A-T) immunity phenotypes per sample is shown on the right (f) Similar correlation plots to those of (e), this time showing the overall correlation across the entire 11 patient cohort. (g) Stacked bar plots representing sequenced tissue spots grouped according to their CAPND phenotype score – Substantial (defined as fold change >2 with FDR < 0.01), Moderate (defined as fold change 0–2, FDR <0.01), and no (fold change <0). The red bars represent the ratio of spots with positive tumor promoting inflammation phenotype scores (defined as fold change >2 with FDR < 0.01) out of all of the assessed spots, for each CAPND group. This bar plot is demonstrating a higher ratio of CAPND and inflammation co-localizion among areas of high substantial CAPND scores. (h) Similar stacked bar plot and spatial analysis conducted on netoadjuvant-treated samples from our clinical trial cohort (n = 16).
Figure 4.
Figure 4.. Cancer associated peripheral nerve degeneration (CAPND) induces sustained pro-inflammatory signaling which functionally impairs anti-tumoral immune activity
(a) Immunohistochemically (IHC) based cell count of CD8+ cells in the clinical trial cohort, according to the clinical response status to anti-PD-1 therapy; R, responders; NR, non-responders; Pre – baseline tumor samples; Post, neoadjuvant-treated samples. (b) Similar IHC-based cell count of (i) PD-1+, (ii) PD-L1+ immune cells, and PD-L1+ tumor cells. (c) Gene Ontology (GO) enrichment analyses of bulk tumor RNA sequencing (clinical trial cohort) demonstrating the different immune landscape in neoadjuvant-treated tumor sample of responders (red) and non-responders (blue) (d) Voronoi treemaps based on Reactome gene pathway analysis of bulk tumor RNA sequencing (clinical trial cohort), providing an overview of the pathways that were enriched among responders and non-responders; The colors represent the parent pathways (legend) associated with each enriched term. (e) Nanostring nCounter PanCancer analysis of the clinical trial tumor samples showing T regulatory cells (Tregs) and Tumor Growth Factor (TGF)-ß1 expression based on response at base line and on treatment. (f) Nanostring nCounter PanCancer pathway enrichment analysis of neoadjuvant-treated samples according to response status. The presented pathways were considered significantly enriched at FDR < 0.2. NES, Normalized Enrichment Scores. Baseline sample analysis was not done due to a small avaialbe samples size (baseline non-responder n=1). (g) De-myelination and inflmmatory signal blockade mouse experiment design; a de-myelinating agent (ethidium bromide; EtBr has no short term mutagenic effects) was injected to the periphery of cutaneous squamous cell carcinoma (SCC) tumors. The mice were then treated with IgG control, anti-PD-1 monotherapy, or combination of anti-PD-1 with either IFN-I receptor or interleukin(IL)-6 blockade. IFN-I and IL-6 were selected as targets based on the described above gene pathway analysis. (h) Tumor growth and tumor viability plots of the different groups in the in demyelinated mouse experiment (p values represent ANOVA, and post hoc Fishers Least Significant Difference tests).

References

    1. Sun L. et al. Clinical efficacy and safety of anti-PD-1/PD-L1 inhibitors for the treatment of advanced or metastatic cancer: a systematic review and meta-analysis. Scientific reports 10, 2083, doi: 10.1038/s41598-020-58674-4 (2020). - DOI - PMC - PubMed
    1. Antonia S. J. et al. Four-year survival with nivolumab in patients with previously treated advanced non-small-cell lung cancer: a pooled analysis. Lancet Oncol 20, 1395–1408, doi: 10.1016/s1470-2045(19)30407-3 (2019). - DOI - PMC - PubMed
    1. Hamid O. et al. Five-year survival outcomes for patients with advanced melanoma treated with pembrolizumab in KEYNOTE-001. Ann Oncol 30, 582–588, doi: 10.1093/annonc/mdz011 (2019). - DOI - PMC - PubMed
    1. Robert C. et al. Pembrolizumab versus Ipilimumab in Advanced Melanoma. New England Journal of Medicine 372, 2521–2532, doi: 10.1056/NEJMoa1503093 (2015). - DOI - PubMed
    1. Seiwert T. Y. et al. Safety and clinical activity of pembrolizumab for treatment of recurrent or metastatic squamous cell carcinoma of the head and neck (KEYNOTE-012): an open-label, multicentre, phase 1b trial. Lancet Oncol 17, 956–965, doi: 10.1016/s1470-2045(16)30066-3 (2016). - DOI - PubMed

Publication types

LinkOut - more resources