[Preprint]. 2023 Nov 20:2023.04.07.536067.
doi: 10.1101/2023.04.07.536067.

Perceptual Transitions between Object Rigidity & Non-rigidity: Competition and cooperation between motion-energy, feature-tracking and shape-based priors

Affiliations

Perceptual Transitions between Object Rigidity & Non-rigidity: Competition and cooperation between motion-energy, feature-tracking and shape-based priors

Akihito Maruya et al. bioRxiv. .

Update in

Abstract

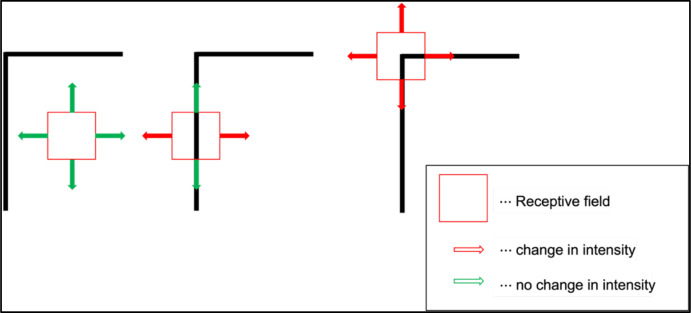
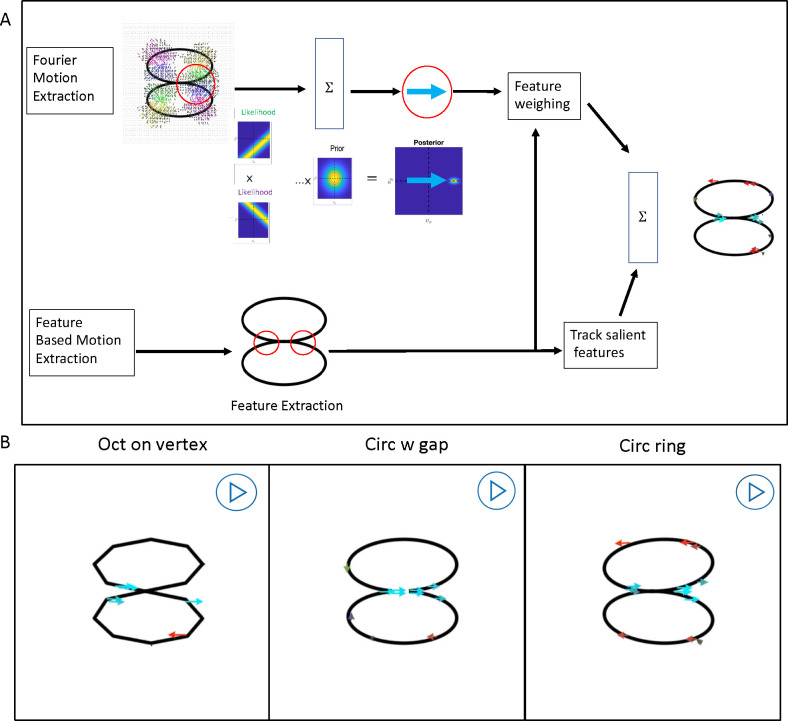
Why do moving objects appear rigid when projected retinal images are deformed non-rigidly? We used rotating rigid objects that can appear rigid or non-rigid to test whether shape features contribute to rigidity perception. When two circular rings were rigidly linked at an angle and jointly rotated at moderate speeds, observers reported that the rings wobbled and were not linked rigidly but rigid rotation was reported at slow speeds. When gaps, paint or vertices were added, the rings appeared rigidly rotating even at moderate speeds. At high speeds, all configurations appeared non-rigid. Salient features thus contribute to rigidity at slow and moderate speeds, but not at high speeds. Simulated responses of arrays of motion-energy cells showed that motion flow vectors are predominantly orthogonal to the contours of the rings, not parallel to the rotation direction. A convolutional neural network trained to distinguish flow patterns for wobbling versus rotation, gave a high probability of wobbling for the motion-energy flows. However, the CNN gave high probabilities of rotation for motion flows generated by tracking features with arrays of MT pattern-motion cells and corner detectors. In addition, circular rings can appear to spin and roll despite the absence of any sensory evidence, and this illusion is prevented by vertices, gaps, and painted segments, showing the effects of rotational symmetry and shape. Combining CNN outputs that give greater weight to motion energy at fast speeds and to feature tracking at slow, with the shape-based priors for wobbling and rolling, explained rigid and nonrigid percepts across shapes and speeds (R2=0.95). The results demonstrate how cooperation and competition between different neuronal classes leads to specific states of visual perception and to transitions between the states.


Conflict of interest statement

The authors declare no competing interests.

Figures

Figure A1.
Figure A1.. Feature selection.
The change in the image intensity across different regions. The red square shows a receptive field at a flat region (left), at an edge (middle), and at a corner (right). For the flat region, a small change in the receptive field location doesn’t change the image intensity (shown in green arrows). At the edge, moving along the edge direction doesn’t change the overall image intensity, but except for that direction, the image intensity shifts especially along the direction perpendicular to the edge. At the corner, the overall image intensity changes in every direction.
Figure 1.
Figure 1.. Rotating ring illusion.
(A) A Styrofoam ring is seen at an angle to another ring as wobbling or rolling over the bottom ring despite physical implausibility. (B) At a slower speed, the rings are seen to rotate together revealing that they are glued together, and that the non-rigid rolling was an illusion. B differs from A only in turntable rpm. (C) Two rings rotate together with a fixed connection at the red segment. (D) Two rings wobble against each other shown by the connection shifting to other colors. (E) & (F) are the same as C & D except that the colored segments are black. Both pairs generate identical sequence of retinal images so that wobbling and rigid rotation are indistinguishable. To see the videos in the pdf file, we suggest downloading the file and opening it in Adobe Reader.
Figure 2.
Figure 2.. Effect of shape on the rotating-ring illusion.
Pairs of rings with different shapes rotated around a vertical axis. When the speed is slow (1 deg/sec), all three shapes are seen as rotating. At medium speed (10 deg/sec), the circular rings seem to be wobbling against each other, but the other two shapes seem rigid. At fast speeds (30 deg/sec), nonrigid percepts dominate irrespective of shape features.
Figure 3.
Figure 3.. Shapes showing the effects of features on object rigidity.
Rows give the names of the shapes. Columns give the three speeds.
Figure 4.
Figure 4.. Non-rigid percepts.
Average proportions of reports of non-rigidity for each of 10 observers for each shape at three speeds (0.6, 6.0 & 60.0 dps) for diameters of 3 dva (A) and 6 dva (B). Different colored circles indicate different observers and the average of all the observers is shown by the black cross. (C) Histograms of non-rigid percepts averaged over the 10 observers. The error bar indicates 95% confidence interval after 1000 bootstrap resamples. (D) Average proportion of non-rigid percepts for the rotating and wobbling circular rings for 10 observers and 3 speeds. Similarity is shown by closeness to the unit diagonal and R2 = 0.97. (E) Average proportion of non-rigid percepts for 0° elevation versus 15° elevation. Proportions are similar R2=0.90, but slightly higher for the 15° elevation.
Figure 5.
Figure 5.. Motion-energy mechanism:
(A) Schematic diagram of a motion energy unit: Moving stimulus is convolved with two filters that are odd and even symmetric spatially and temporally oriented filters, then the outputs are squared and summed to create a phase-independent motion energy response. (B) Motion energy units used in the model. At each spatial location there were 16 preferred directions, 5 spatial frequencies, and 5 temporal frequencies. (C) An array of 51,984,000 motion energy units uniformly covering the whole stimulus were applied to the change at each pair of 199 frames. At each location, the preferred velocity of the highest responding motion energy unit from the array was selected as the population response. Motion vectors from physically rotating (D) and wobbling (E) ring pairs are predominantly orthogonal to contours instead of in the rotation direction. (F) The difference between the two vector fields is negligible. Since the flows for physically rotating and wobbling circular rings are almost identical, other factors must govern the perceptual shift from wobbling to rotation at slower speeds.
Figure 6.
Figure 6.. Convolutional Neural Network for classifying patterns of motion vectors as rotating or wobbling.
(A) Two examples of the 9000 vector fields from random dot moving stimuli that were used to train and validate the CNN, (Left) the rotating vector field and (Right) the wobbling vector field. The 9000 vector fields were randomly divided into 6300 training and 2700 validation fields. (B) The network consists of two convolutional layers followed by two fully connected layers. The output layer gives a confidence level between rotation and wobbling on a 0.0 –1.0 scale.
Figure 7.
Figure 7.. Convolutional Neural Network Output.
(A) Proportion of non-rigid percepts for CNN output from motion energy units for each shape. Symbol shape and color indicate ring-pair shape. For all ring shapes, the proportion of non-rigid classifications was 0.996. (B) Average CNN output based on the feature tracking vector fields being the inputs for different stimulus shapes, shows higher probability of rigid percepts.
Figure 8.
Figure 8.. Feature tracking mechanism.
(A): Two feature tracking streams simulating MT pattern-direction-selective (top) and feature-extraction based motion (bottom). Top: the inputs are the vectors attained from the motion energy units and each motion energy vector creates a likelihood function that is perpendicular to the vector. Likelihood functions are combined with the slowest motion prior by Bayes’ rule. The output vector at each location is selected by the maximum posteriori. Bottom: salient features (corners) are extracted, and a velocity of the feature is computed by picking up the highest correlated location in the succeeding image. The outputs from two streams are combined. (B): The preferred velocity of the most responsive unit at each location is shown by a colored vector using the same key as Figure 6. Stimulus name is indicated on the bottom of each section. Most of the motion vectors point right or left, corresponding to the direction of rotation.
Figure 9.
Figure 9.. Combining motion-energy and feature tracking outputs.
A: Estimated optimal weights of inputs from the motion energy mechanism (red) and the feature tracking mechanism (yellow) as a function of rotation speed overall shapes. B: CNN rigidity classifications as a function of rotation speed. The trained CNN output from the linear combination of two vector fields, the likelihood, is denoted by the green bar and the blue bar indicates the average of the 10 observers response. C: the proportion of non-rigid percept from the likelihood function of the CNN as a function of the speed of the stimulus for different shapes. Different colors show different speeds of stimulus (blue: 0.6 deg/sec, orange: 6.0 deg/sec, and green: 60.0 deg/sec). D: the likelihood of non-rigidity output plotted against average of observers’ reports. At the fast speed, the model predicts similar probability of non-rigidity for shapes where the observers’ percepts vary. Thus, the model doesn’t capture the important properties of observer’s percepts as a function of the shape of the object.
Figure 10.
Figure 10.. Rolling illusion:
(A) shows a 2D circle on a line, translating from left to right. Our percept of the translating circle, however, is rolling clockwise. To perceive the rolling based on the sensory information, local motion units that direct tangential to the contour (B) are required. (C) and (D) show local motion selective units from motion energy (left) and feature tracking (right). In both cases, the vectors are inconsistent with the required vectors. (E): Average proportion of rolling percepts (8 observers). The color of the bar shows the different speed of stimulus (blue: 0.6 deg/sec, orange: 6.0 deg/sec, and green: 60.0 deg/sec). The shape of the stimulus is indicated on the x-axis. The proportion of rolling percepts increased with speed and decreased when features were added to the rings. (F): Rolling illusion and rotational symmetry. The non-rigidity (rolling) percepts increases with the order of rotational symmetry from left to right. (G): The relationship between rolling illusion and the strength of feature. As the number of corners increase from left to right, it gets harder to extract the corners and accordingly, the percept of rolling increases. (H): Model prediction with rotational symmetry and average strength of features versus average proportion of rolling percepts for slow (left), moderate (middle), and fast (right) speeds (R2=0.90,0.94, and 0.79).
Figure 11.
Figure 11.. Final model:
(A): the proportion of non-rigid percept classifications as a function of the speed of the stimulus and different shape from the final model combining shape-based rolling and wobbling priors with the CNN likelihoods. Different colors show different speeds of the stimulus (blue: 0.6 deg/sec, orange: 6.0 deg/sec, and green: 60.0 deg/sec). (B): the posterior output plotted against the observer’s percepts. The model explains the observer’s percepts R2:0.95.

References

    1. Abadi M., Agarwal A., Barham P., Brevdo E., Chen Z., Citro C., … & Zheng X. (2016). Tensorflow: Large-scale machine learning on heterogeneous distributed systems. arXiv preprint arXiv:1603.04467.
    1. Adelson E. H., & Bergen J. R. (1985). Spatiotemporal energy models for the perception of motion. Journal of the Optical Society of America A, 2(2), 284–299. - PubMed
    1. Adelson E. H., & Movshon J. A. (1982). Phenomenal coherence of moving visual patterns. Nature, 300(5892), 523–525. - PubMed
    1. Aggarwal J. K., Cai Q., Liao W., & Sabata B. (1998). Nonrigid motion analysis: Articulated and elastic motion. Computer Vision and Image Understanding, 70(2), 142 156.
    1. Akhter I., Sheikh Y., Khan S., & Kanade T. (2010). Trajectory space: A dual representation for nonrigid structure from motion. IEEE Transactions on Pattern Analysis and Machine Intelligence, 33(7), 1442–1456. - PubMed

Publication types