[Preprint]. 2023 Jul 16:2023.07.14.23292650.
doi: 10.1101/2023.07.14.23292650.

Novel CSF tau biomarkers can be used for disease staging of sporadic Alzheimer's disease

Affiliations

Novel CSF tau biomarkers can be used for disease staging of sporadic Alzheimer's disease

Gemma Salvadó et al. medRxiv. .

Abstract

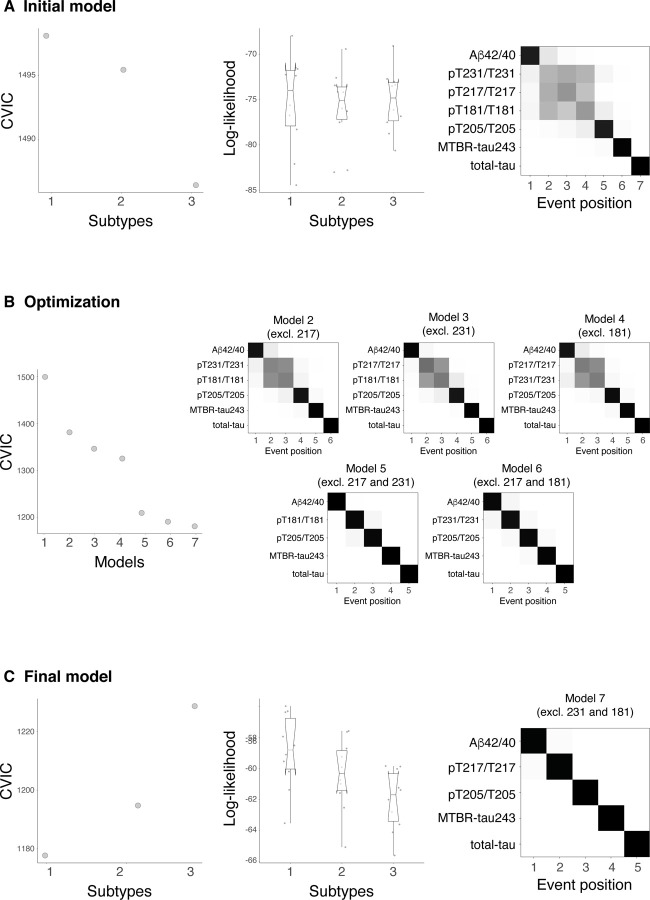
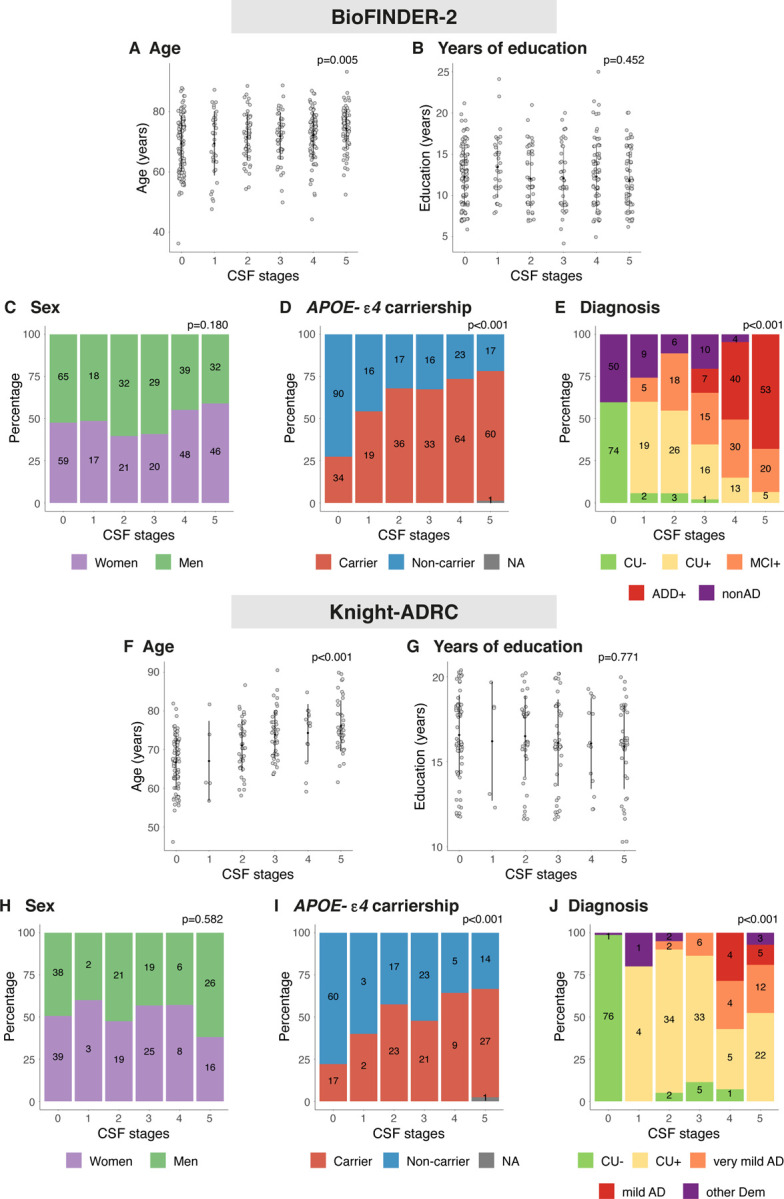
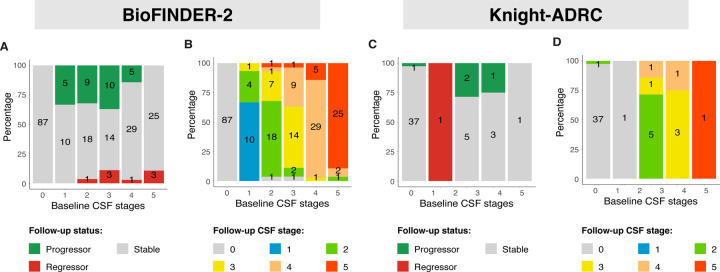
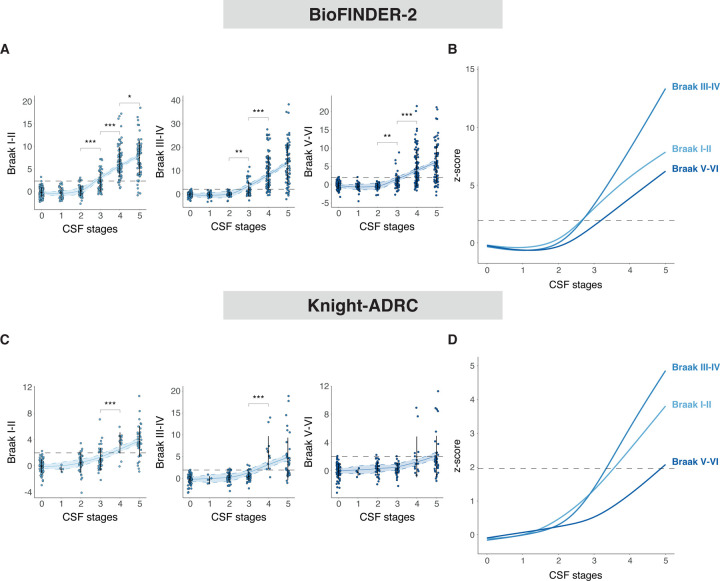
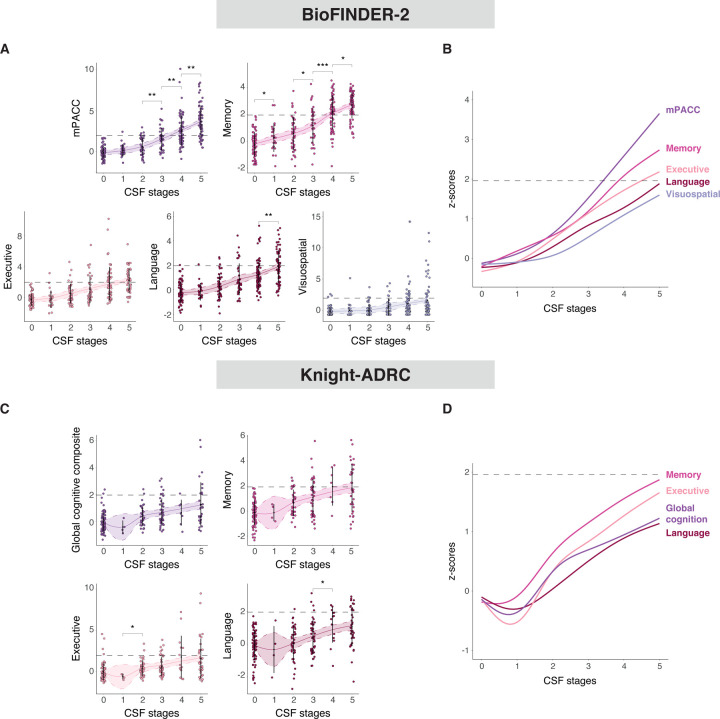
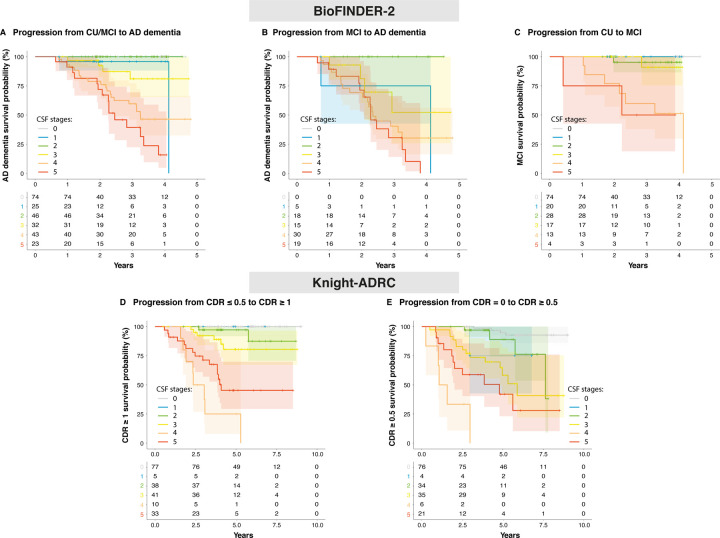
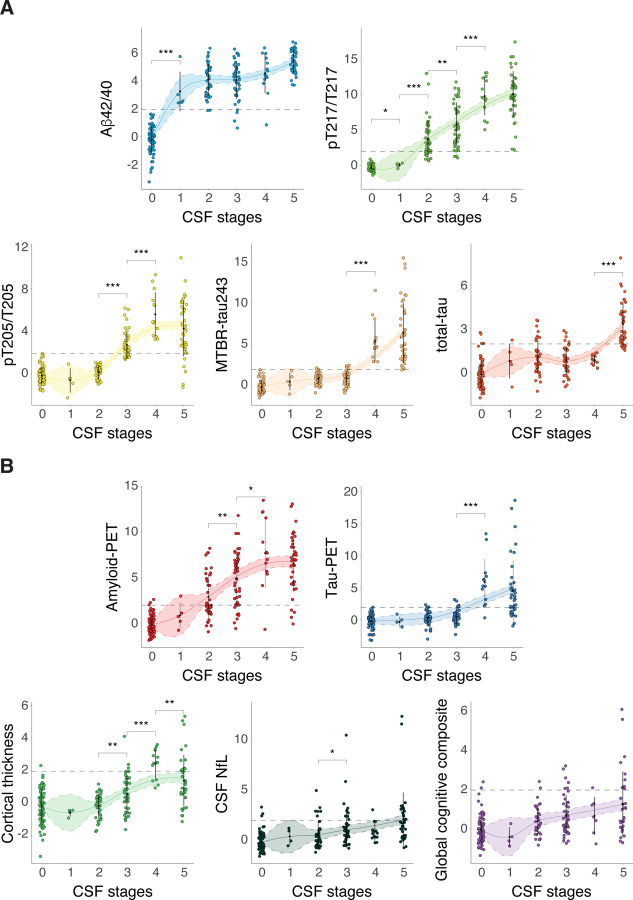
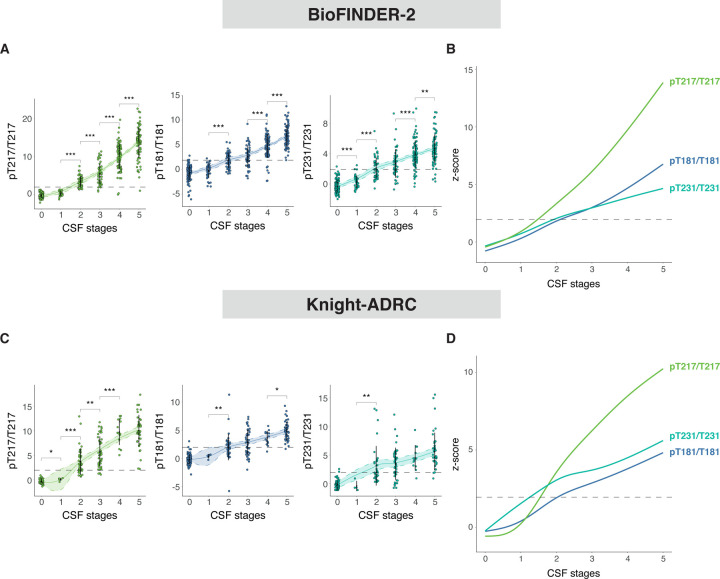
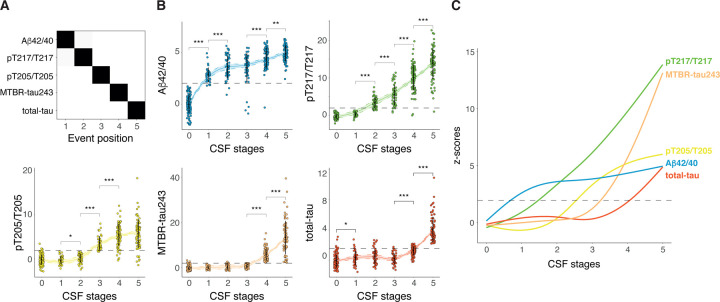
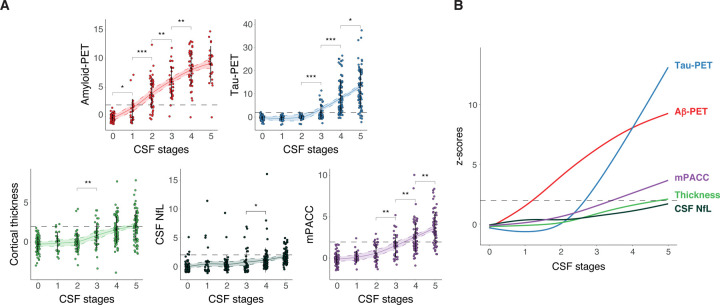
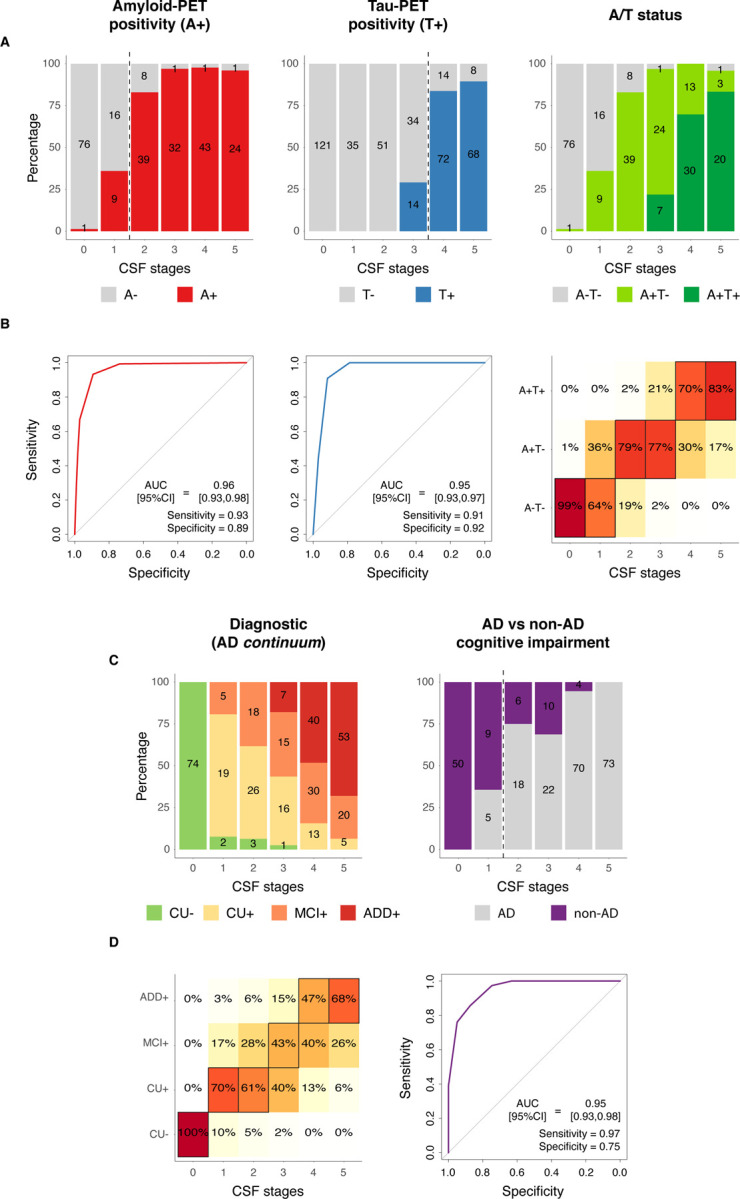
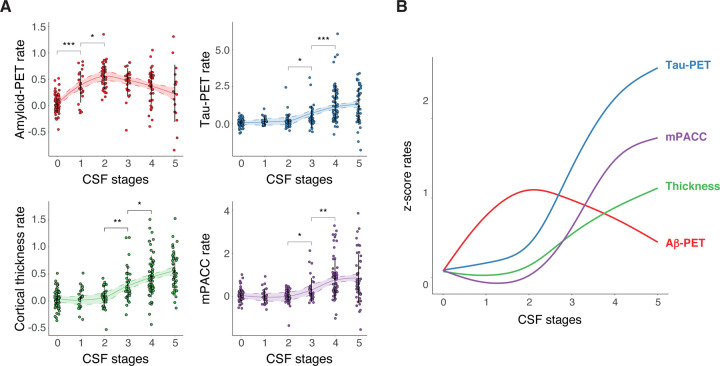
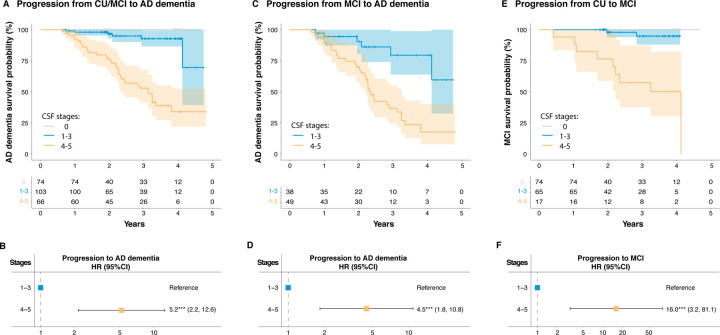
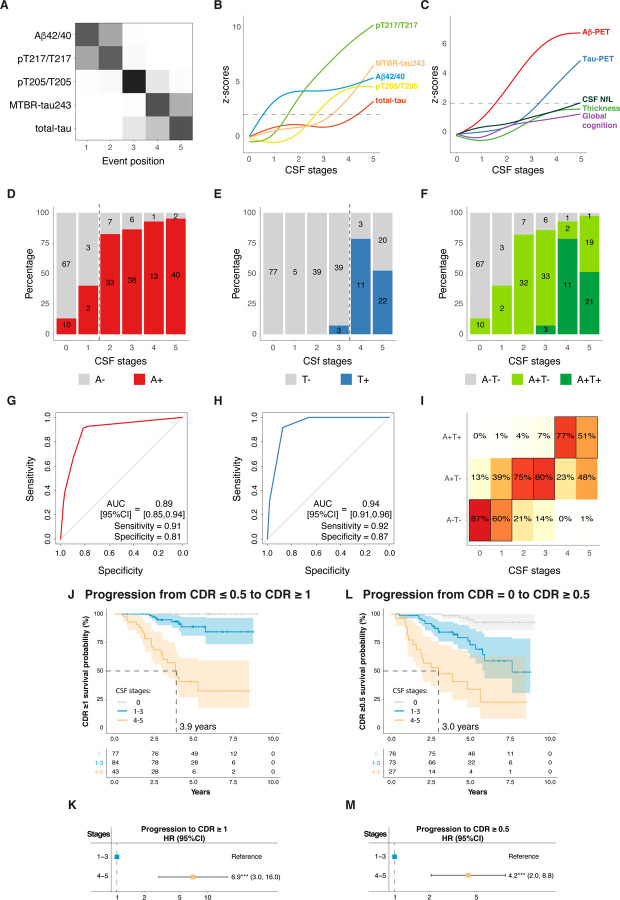
Biological staging of individuals with Alzheimer's disease (AD) may improve diagnostic and prognostic work-up of dementia in clinical practice and the design of clinical trials. Here, we created a staging model using the Subtype and Stage Inference (SuStaIn) algorithm by evaluating cerebrospinal fluid (CSF) amyloid-β (Aβ) and tau biomarkers in 426 participants from BioFINDER-2, that represent the entire spectrum of AD. The model composition and main analyses were replicated in 222 participants from the Knight ADRC cohort. SuStaIn revealed in the two cohorts that the data was best explained by a single biomarker sequence (one subtype), and that five CSF biomarkers (ordered: Aβ42/40, tau phosphorylation occupancies at the residues 217 and 205 [pT217/T217 and pT205/T205], microtubule-binding region of tau containing the residue 243 [MTBR-tau243], and total tau) were sufficient to create an accurate disease staging model. Increasing CSF stages (0-5) were associated with increased abnormality in other AD-related biomarkers, such as Aβ- and tau-PET, and aligned with different phases of longitudinal biomarker changes consistent with current models of AD progression. Higher CSF stages at baseline were associated with higher hazard ratio of clinical decline. Our findings indicate that a common pathophysiologic molecular pathway develops across all AD patients, and that a single CSF collection is sufficient to reliably indicate the presence of both AD pathologies and the degree and stage of disease progression.


Figures

Ext Data Fig 1:
Ext Data Fig 1:. Creation and optimization of the model
Initial model with all CSF biomarkers (Aβ42/40, pT217/T217, pT231/T231, pT181/T181, pT205/T205, MTBR-tau243 and total-tau) is shown in A. First two columns represent the statistics, CVIC and log-likelihood, of this model for one, two and three subtypes. Each dot in log-likelihood plot represents one of the ten cross-validation sets of data. Lower CVIC and higher log-likelihood values represent better performance of the model. Although higher number of subtypes had higher CVIC, the comparable log-likelihood across subtypes suggests that one subtype is complex enough to explain the variability observed in the data. Cross-validated confusion matrix of the one subtype model is shown in the last column. Here, biomarkers are sorted by the time they become abnormal based on the results of SuStaIn. Darkness represents the probability of that biomarker of becoming abnormal at that position, with black being 100%. Given that some biomarkers (pT217/T217, pT231/T231 and pT181/T181) show high overlap on the ordering, we optimized the model by removing these biomarkers systematically (B). All models without one or two of these biomarkers were tested (models 2 to 7). CVIC (left) and cross-validated confusion matrixes (right) for each of these models are shown in B, respectively. CVIC shows that the optimal model was that excluding both pT231/T231 and pT181/T181 (model 7, shown in C). Both CVIC and log-likelihood measures show that one subtype was the optimal model when using this set of biomarkers. Abbreviations: Aβ, amyloid-β; CVIC, cross-validation information criterion; MTBR, microtubule binding region; pT, phosphorylated tau; SuStaIn, subtype and stage inference.
Ext Data Fig 2:
Ext Data Fig 2:. Demographic, genetic and clinical characteristics by CSF stage
Depiction of basic characteristics of BioFINDER-2 (A-E) and Knight-ADRC (F-J) by CSF stage. Kruskal-Wallis or chi-square tests were used to investigate the association between each of these characteristics and CSF stages. P-values of these tests are shown at the top right of each subplot. Number of individuals in each category are shown inside the barplots. Abbreviations: AD, Alzheimer’s disease; ADD+, Alzheimer’s disease dementia amyloid positive; CU−, cognitively unimpaired amyloid negative; CU+, cognitively unimpaired amyloid positive; CSF, cerebrospinal fluid; MCI+, mild cognitive impairment amyloid positive; nonAD, non-Alzheimer’s related disease; other Dem, non-Alzheimer’s type dementia.
Ext Data Fig 3:
Ext Data Fig 3:. Model stability
Depiction of the evolution of CSF stages in BioFINDER-2 (n=220, A-B) and Knight-ADRC participants (n=51, C-D) with longitudinal CSF available. As longitudinal CSF Aβ42/40 levels were not available for any BioFINDER-2 participant, we imputed this data with their baseline levels. We show the number of progressors, regressors and stable participants in A and C, for each cohort respectively. In B and D, we further show the CSF stages at follow-up. For those Knight-ADRC with more than one longitudinal visit we took the one more distant from the baseline. Abbreviations: Aβ, amyloid-β; CSF, cerebrospinal fluid.
Ext Data Fig 4:
Ext Data Fig 4:. Tau-PET binding in different Braak regions by CSF stages
Depiction of tau-PET binding in different areas of tau deposition, by CSF stage in all BioFINDER-2 (A) and Knight-ADRC participants (B). These areas include regions of early (Braak I-II), intermediate (Braak II-IV) and late (Braak V-VI) tau deposition. Tau-PET levels are z-scored based on a group of CU− participants (BioFINDER-2: n=63 and Knight-ADRC: n=71) and all increases represent increase in abnormality. Significant differences in contiguous CSF stages are shown with asterisks. Horizontal line is drawn at z-score=1.96 which represents 95%CI of the reference group (CU−). Smoothed LOESS lines of all AD biomarkers are shown in B for comparison. CSF stage 0 represent being classified as normal by the model. *: p<0.05; **: p<0.01; ***: p<0.001. Abbreviations: Aβ, amyloid-β; AD, Alzheimer’s disease; CI, confidence interval; CU−, cognitively unimpaired amyloid negative; CSF, cerebrospinal fluid; LOESS, locally estimated scatterplot smoothing; PET, positron emission tomography; ROI, region of interest.
Ext Data Fig 5:
Ext Data Fig 5:. Cognitive composites by CSF stages
Depiction of different cognitive measures, by CSF stage in BioFINDER-2 (A) and Knight-ADRC participants (B). These measures include: mPACC (ADAS-delayed, animal fluency, MMSE and TMT-A), memory (ADAS-delayed and ADAS-immediate), executive function (TMT-A, TMT-B and symbols digit), language (animal fluency and BNT-15) and visuospatial (VOSP-cube and VOSP-incomplete) for BioFINDER-2. For Knight-ADRC we had a global cognitive composite (FCSRT, animals, TMT-A and TMT-B), an executive function composite (TMT-A and TMT-B), a memory (FCSRT) and language (animal fluency) tests. Cognitive scores are z-scored based on a group of CU− participants (BioFINDER-2: n=60 and Knight-ADRC: n=71) and all increases represent increase in abnormality. Significant differences in contiguous CSF stages are shown with asterisks. Horizontal line is drawn at z-score=1.96 which represents 95%CI of the reference group (CU−). Smoothed LOESS lines of all AD biomarkers are shown in B for comparison. We excluded non-AD dementia patients to avoid bias in these analyses. CSF stage 0 represents being classified as normal by the model. *: p<0.05; **: p<0.01; ***: p<0.001. Abbreviations: AD, Alzheimer’s disease; ADAS, Alzheimer’s disease assessment scale; BNT, Boston naming test; CI, confidence interval; CU−, cognitively unimpaired amyloid negative; CSF, cerebrospinal fluid; FCSRT, free and cued selective reminding test; LOESS, locally estimated scatterplot smoothing; MMSE, Mini-Mental state examination; mPACC, modified version of preclinical Alzheimer’s disease cognitive composite; TMT, trial making test; VOSP, visual object and space perception battery.
Ext Data Fig 6:
Ext Data Fig 6:. Individual CSF stages for predicting clinical progression
Kaplan-Meier curves for all individual CSF stages in BioFINDER-2 (A-C) and Knight-ADRC (D-E) participants. For BioFINDER-2, progression from CU or MCI at baseline to AD dementia is shown in A; progression from MCI at baseline to AD dementia is shown in B and; progression from CU at baseline to MCI is shown in C. For Knight-ADRC, progression from CDR=0 or CDR=0.5 at baseline to CDR≥1 is shown in D and; progression from CDR=0 at baseline to CDR≥0.5 is shown in E. Abbreviations: AD, Alzheimer’s disease; CDR, clinical dementia rating; CSF, cerebrospinal fluid; CU, cognitively unimpaired; MCI, mild cognitive impairment.
Ext Data Fig 7:
Ext Data Fig 7:. Individual biomarker levels by CSF stage in Knight-ADRC participants
Individual CSF biomarker levels, included in the model, by CSF stage participants are shown in A including all Knight-ADRC participants. Depiction of individual AD-biomarker levels, not used in the creation of the model, per CSF stage are shown in B. All biomarker levels are z-scored based on a group of CU− participants (n=71) and all increases represent increase in abnormality. Significant differences in contiguous CSF stages are shown with asterisks. Horizontal line is drawn at z-score=1.96 which represents 95%CI of the reference group (CU−). CSF stage 0 represent being classified as normal by the model. Black dots and vertical lines represent mean and SD per CSF stage. *: p<0.05; **: p<0.01; ***: p<0.001. Abbreviations: Aβ, amyloid-β; CI, confidence interval; CU−, cognitively unimpaired amyloid negative; CSF, cerebrospinal fluid; MMSE, Mini-Mental state examination; MTBR, microtubule binding region; NfL, neurofilament light; PET, positron emission tomography; pT, phosphorylated tau; SuStaIn, subtype and stage inference.
Ext Data Fig 8:
Ext Data Fig 8:. Excluded CSF biomarkers by CSF stage
Depiction of the CSF biomarkers excluded in the optimal model (pT231/T231 and pT181/T181) by CSF stage in BioFINDER-2 (A-B) and Knight-ADRC (C-D) participants. CSF pT217/T217 is also shown for comparison. CSF levels are z-scored based on a group of CU− participants (BioFINDER-2: n=63, Knight-ADRC: n=71) and all increases represent increase in abnormality. Significant differences in contiguous CSF stages are shown with asterisks. Horizontal line is drawn at z-score=1.96 which represents 95%CI of the reference group (CU−). Smoothed LOESS lines of all CSF biomarkers are shown in B (BioFIDNER-2) and D (Knight-ADRC) for comparison. CSF stage 0 represent being classified as normal by the model. Black dots and vertical lines represent mean and SD per CSF stage, respectively. *: p<0.05; **: p<0.01; ***: p<0.001. Abbreviations: Aβ, amyloid-β; CI, confidence interval; CU−, cognitively unimpaired amyloid negative; CSF, cerebrospinal fluid; LOESS, locally estimated scatterplot smoothing; MTBR, microtubule binding region; pT, phosphorylated tau; SuStaIn, subtype and stage inference.
Fig 1:
Fig 1:. CSF staging model
Description of the CSF staging model and the levels of the biomarkers included in the model by CSF stage. Cross-validated confusion matrix of the CSF biomarkers of the model is shown in A. Biomarkers are sorted by the time they become abnormal based on the results of SuStaIn. Darkness represents the probability of that biomarker of becoming abnormal at that position, with black being 100%. Only amyloid-positive participants are included in this analysis. Individual biomarker levels by CSF stage in all BioFINDER-2 participants are shown in B. CSF levels are z-scored based on a group of CU− participants (n=63) and all increases represent increase in abnormality. Significant differences in contiguous CSF stages are shown with asterisks. Horizontal line is drawn at z-score=1.96 which represents 95%CI of the reference group (CU−). Smoothed LOESS lines of all CSF biomarkers are shown in C for comparison. CSF stage 0 represent being classified as normal by the model. Black dots and vertical lines represent mean and SD by CSF stage, respectively. *: p<0.05; **: p<0.01; ***: p<0.001. Abbreviations: Aβ, amyloid-β; CI, confidence interval; CU−, cognitively unimpaired amyloid negative; CSF, cerebrospinal fluid; LOESS, locally estimated scatterplot smoothing; MTBR, microtubule binding region; pT, phosphorylated tau; SuStaIn, subtype and stage inference.
Fig 2:
Fig 2:. AD pathology, biomarkers and cognition by CSF stages
Depiction of individual biomarker levels, not used in the creation of the model, by CSF stage in BioFINDER-2 participants (A). These include biomarkers of amyloid (amyloid-PET) and tau (tau-PET in the meta-temporal ROI) pathologies, neurodegeneration (cortical thickness in the AD signature areas and CSF NfL) and cognition (mPACC). Biomarkers are z-scored based on a group of CU− participants (n=63) and all increases represent increase in abnormality. Significant differences in contiguous CSF stages are shown with asterisks. Horizontal line is drawn at z-score=1.96 which represents 95%CI of the reference group (CU−). Smoothed LOESS lines of all AD biomarkers are shown in B for comparison. All participants with available data were included in amyloid- and tau-PET analyses. For neurodegeneration (cortical thickness and NfL) and cognitive (mPACC) measures, we excluded non-AD dementia patients to avoid bias. Of note, only few AD dementia cases had amyloid-PET available due to study design. CSF stage 0 represent being classified as normal by the model. Black dots and vertical lines represent mean and SD per CSF stage, respectively. *: p<0.05; **: p<0.01; ***: p<0.001. Abbreviations: Aβ, amyloid-β; AD, Alzheimer’s disease; CI, confidence interval; CU−, cognitively unimpaired amyloid negative; CSF, cerebrospinal fluid; LOESS, locally estimated scatterplot smoothing; mPACC, modified preclinical Alzheimer’s cognitive composite; NfL, neurofilament light; PET, positron emission tomography; ROI, region of interest.
Fig 3:
Fig 3:. CSF stages for predicting A/T status and cognitive stages
CSF stages for predicting pathological status as measured with PET is shown in A-B, and for predicting cognitive stages and diagnostic groups in C-D. Barplots represent the number of participants in each category per CSF stage. Numbers of participants in each category per CSF stage are shown within the barplots (A and C). In B and D, ROC curves were used to assess the classification into dichotomic categories (Aβ-PET, tau-PET and AD vs non-AD cognitive impairment), whereas ordinal logistic regressions were used for ordinal categories (A/T status and diagnosis). Heatmaps represent the predicted percentage of participants in each outcome category (A/T or diagnosis) by CSF stage. The most probable (highest percentage) category by CSF stage is framed in black. For ROC analyses, AUCs, sensitivity and specificity measures from these analyses are shown in the plot. The optimal cut-off in each case is shown as a vertical dashed line in A or C. An A−T+ participant (n=1) was excluded from the A/T status analysis. Non-AD dementia cases were excluded from the cognitive stages analysis. And, only patients with objective impairment (MCI or dementia) were included in the analyses of AD vs. non-AD. Aβ- and tau-PET were assessed as positive based on previously validated cut-offs (Aβ: SUVR>1.03, tau: SUVR>1.36). Abbreviations: Aβ, amyloid-β; AD, Alzheimer’s disease; ADD+, Alzheimer’s disease dementia amyloid-positive; A−T−, amyloid-negative tau-negative; A−T+, amyloid-negative tau-positive; A+T−, amyloid-positive tau-negative; A+T+, amyloid-positive tau-positive; CSF, cerebrospinal fluid; CU−, cognitively unimpaired amyloid-negative; CU+, cognitively unimpaired amyloid-positive; MCI+, mild cognitive impairment amyloid-positive; PET, positron emission tomography; ROC, receiver operating characteristic; ROI, region of interest; SUVR, standardized uptake value ratio.
Fig 4:
Fig 4:. Longitudinal rate of change of AD biomarkers by CSF stages
Depiction of individual biomarker longitudinal rates of change by CSF stage in BioFINDER-2 participants (A). These include biomarkers of amyloid (amyloid-PET) and tau (tau-PET in the meta-temporal ROI) pathologies, neurodegeneration (cortical thickness in the AD signature) and cognition (mPACC). Biomarkers are z-scored based on a group of CU− participants (n=63) and all increases represent increase in abnormality. Rates of change were calculated with individual linear regression models. Significant differences in contiguous CSF stages are shown with asterisks. Smoothed LOESS lines of all AD biomarkers are shown in B for comparison. All participants were included in amyloid- and tau-PET analyses. For neurodegeneration (cortical thickness) and cognitive (MMSE) measures, we excluded non-AD dementia patients to avoid bias. CSF stage 0 represent being classified as normal by the model. Black dots and vertical lines represent mean and SD per CSF stage, respectively. *: p<0.05; **: p<0.01; ***: p<0.001. Abbreviations: Aβ, amyloid-β; AD, Alzheimer’s disease; CI, confidence interval; CU−, cognitively unimpaired amyloid negative; CSF, cerebrospinal fluid; LOESS, locally estimated scatterplot smoothing; mPAC, modified preclinical Alzheimer’s cognitive composite; PET, positron emission tomography; ROI, region of interest.
Fig 5:
Fig 5:. CSF stages for predicting clinical progression
Higher CSF stages groups (4–5) show higher HR of clinical progression compared to lower positive stages (reference: 1–3). Progression from CU or MCI at baseline to AD dementia is shown in A-B. Progression from MCI at baseline to AD dementia is shown in C-D. Progression from CU at baseline to MCI is shown in E-F. Kaplan-Meier curves, as well as the number of participants per group and timepoint are shown in A, C and E, respectively. Cox-proportional hazards models were used to calculate HR[95%CI] of higher CSF stages (4–5) compared to the reference (1–3, B, D and F). These analyses were adjusted for age, sex in all cases, and additionally for clinical status at baseline (CU or MCI) if appropriate. Abbreviations: AD, Alzheimer’s disease; CI, confidence interval; CSF, cerebrospinal fluid; HR, hazard ratios; MCI, mild cognitive impairment.
Fig 6:
Fig 6:. Replication of main analyses in Knight-ADRC participants
Description of the model is shown in A-B. Cross-validated confusion matrix of the CSF biomarkers of the model is shown in A. Biomarkers are sorted by the time they become abnormal based on the results of SuStaIn. Darkness represents the probability of that biomarker of becoming abnormal at that position, with black being 100%. Only amyloid-positive participants are included in this analysis. Description of the CSF levels of the biomarkers included in the model by CSF stage are shown in B for all Knight-ADRC participants. Depiction of individual biomarker levels, not used in the creation of the model, by CSF stage are shown in C. These include biomarkers of amyloid (amyloid-PET) and tau (tau-PET in the meta-temporal ROI) pathologies, neurodegeneration (cortical thickness in the AD signature areas and CSF NfL) and cognition (global cognitive composite). CSF and AD biomarker levels are z-scored based on a group of CU− participants (n=71) and all increases represent increase in abnormality. Horizontal line is drawn at z-score=1.96 which represents 95%CI of the reference group (CU−). CSF stage 0 represent being classified as normal by the model. Prediction of amyloid-PET (D-G), tau-PET (E-H) and A/T status (by PET, F-I) are shown next. Number of participants in each category are colored in D, E and F. Numbers of participants in each category per CSF stage are shown within the barplots. In G and H, ROC curves were used to determine the CSF stage to optimally classify participants into positive/negative in each case. AUCs, sensitivity and specificity measures from these analyses are shown in the plot. The optimal cut-off in each case is shown as a vertical dashed line in D and E, respectively. Ordinal logistic regression was used for assessing A/T status (I). The heatmap represent the predicted percentage of participants in each A/T group per CSF stage. The most probable (highest percentage) group per CSF stage is framed in black. Amyloid-PET was considered positive if Centiloids>20, tau-PET was considered positive if SUVR at meta-temporal ROI was higher than 1.32. An A−T+ participant (n=1) was excluded from the A/T status analysis. Higher CSF stages groups (4–5) show higher HR of clinical progression compared to lower stages (reference: 1–3, J-M). Progression from CDR=0 or CDR=0.5 at baseline to CDR≥1 is shown in J-K. Progression from CDR=0 at baseline to CDR≥0.5 is shown in L-M. Kaplan-Meier curves, as well as the number of participants per group and timepoint are shown in J and L. Cox-proportional hazards models were used to calculate HR[95%CI] of higher CSF stages (4–5) compared to the reference (1–3, K and M). These analyses were adjusted for age, sex in all cases, and additionally for clinical status at baseline (CDR=0 or CDR=1) if appropriate. Abbreviations: Aβ, amyloid-β; AD, Alzheimer’s disease; AUC, area under the curve; CDR, clinical dementia rating; CI, confidence interval; CU−, cognitively unimpaired amyloid negative; CSF, cerebrospinal fluid; HR, hazard ratio; LOESS, locally estimated scatterplot smoothing; MMSE, Mini-mental state examination; MTBR, microtubule binding region; NfL, neurofilament light; PET, positron emission tomography; ROC, receiver operating characteristic; SuStaIn, subtype and stage inference; SUVR, standardized uptake value ratio.

References

    1. GBD 2019 Dementia Forecasting Collaborators. Estimation of the global prevalence of dementia in 2019 and forecasted prevalence in 2050: an analysis for the Global Burden of Disease Study 2019. Lancet Public Health 7, e105–e125 (2022). - PMC - PubMed
    1. Scheltens P. et al. Alzheimer’s disease. Lancet 388, 505–17 (2016). - PubMed
    1. Villemagne V. L. et al. Amyloid-β deposition, neurodegeneration, and cognitive decline in sporadic Alzheimer’s disease: A prospective cohort study. Lancet Neurol 12, 357–367 (2013). - PubMed
    1. Hansson O. Biomarkers for neurodegenerative diseases. Nature Medicine vol. 27 954–963 Preprint at 10.1038/s41591-021-01382-x (2021). - DOI - PubMed
    1. Leuzy A. et al. Biomarker-Based Prediction of Longitudinal Tau Positron Emission Tomography in Alzheimer Disease. JAMA Neurol 79, 149 (2022). - PMC - PubMed

Publication types