[Preprint]. 2023 Jun 23:2023.06.22.546190.
doi: 10.1101/2023.06.22.546190.

Integrated genomic and functional analyses of human skin-associated Staphylococcus reveals extensive inter- and intra-species diversity

Affiliations

Integrated genomic and functional analyses of human skin-associated Staphylococcus reveals extensive inter- and intra-species diversity

Payal Joglekar et al. bioRxiv. .

Update in

Abstract

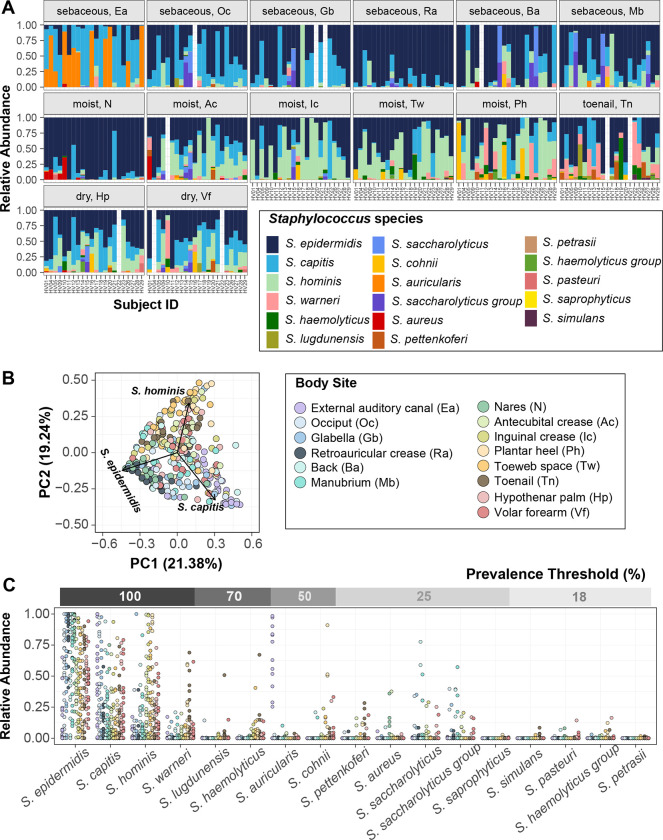
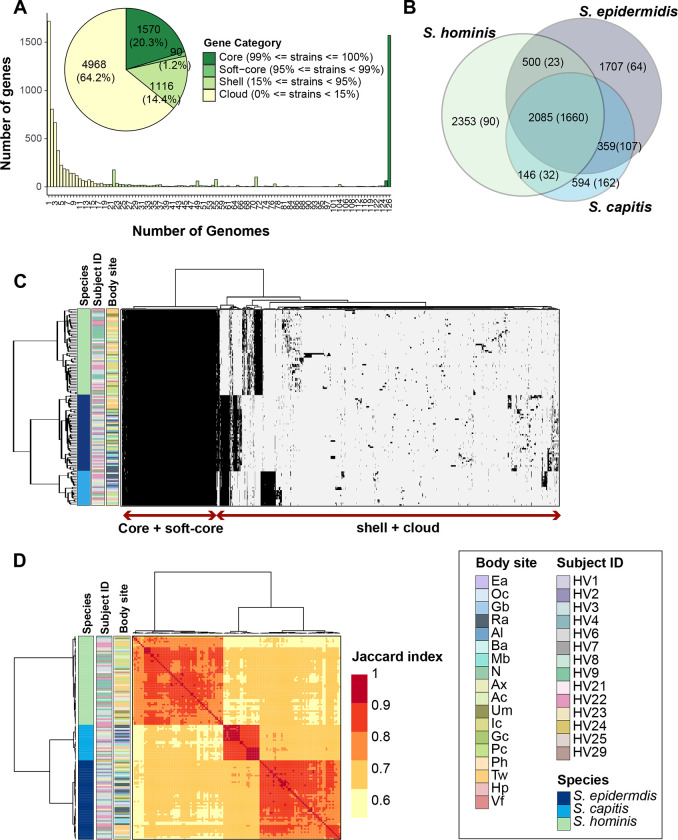
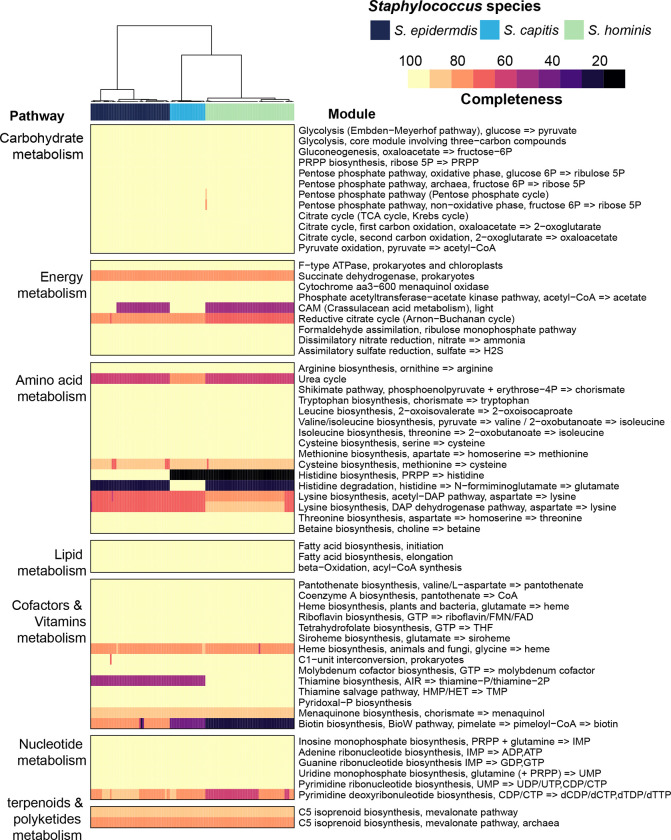
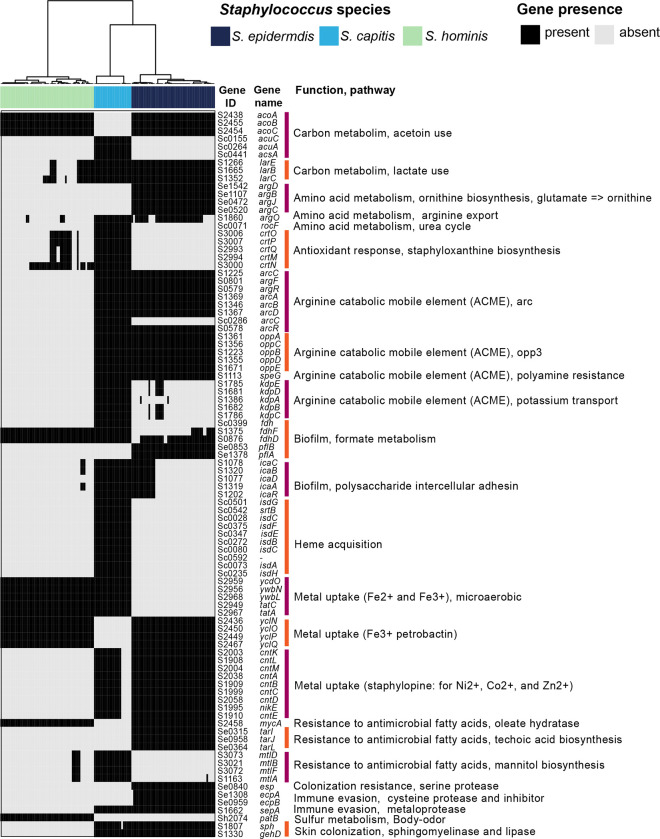
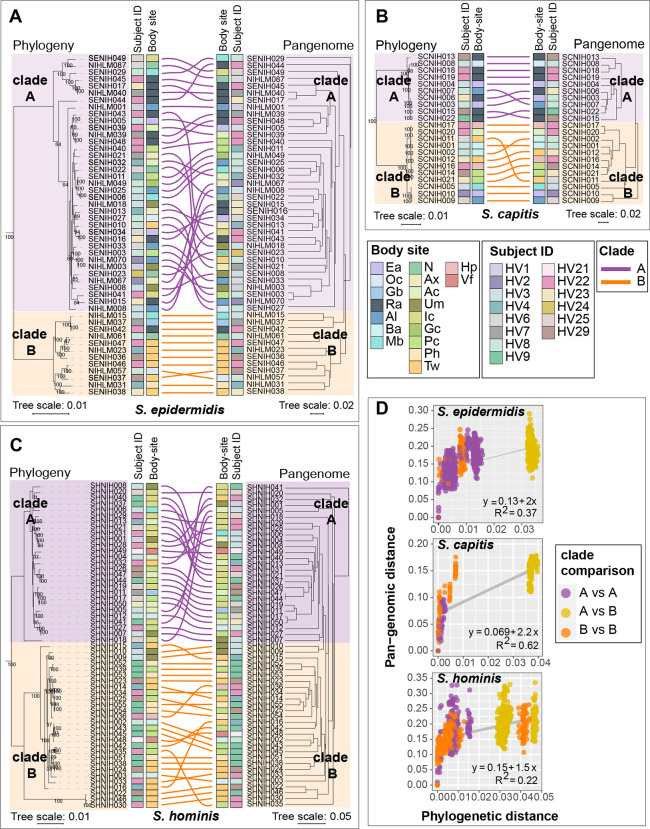
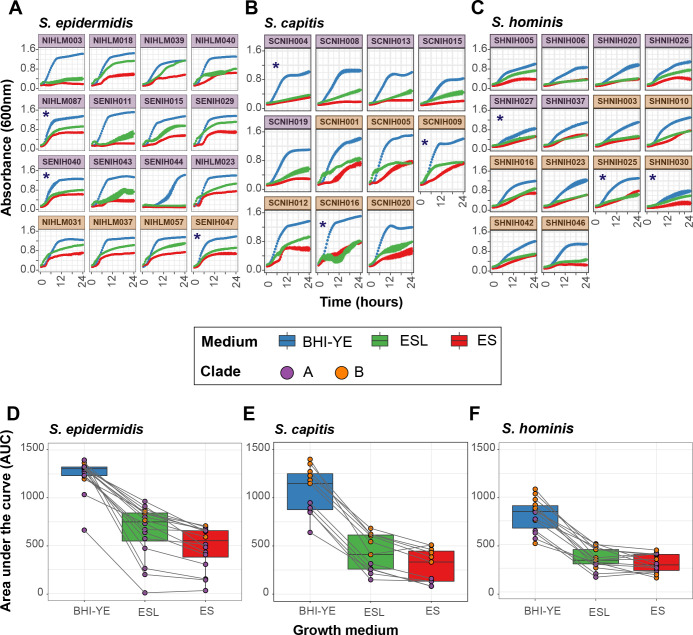
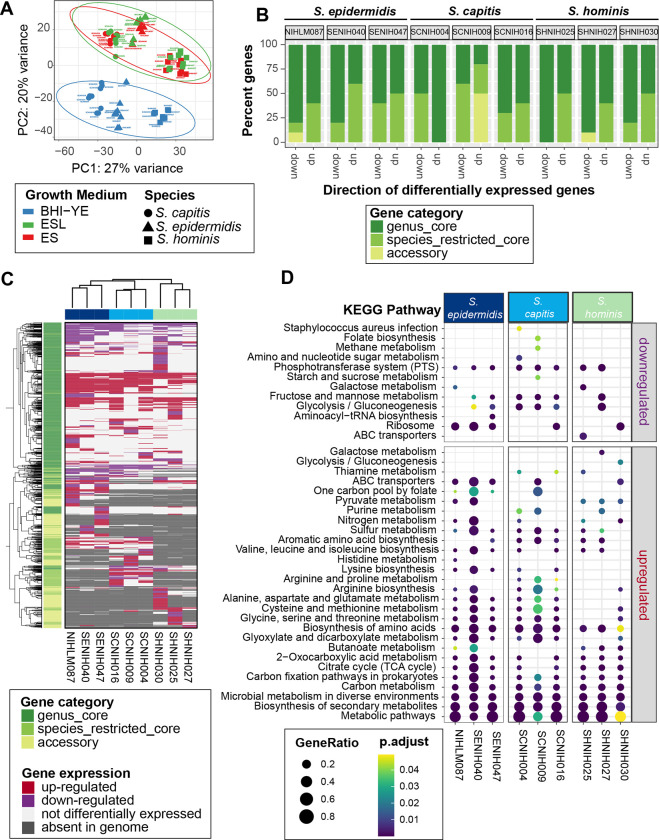
Human skin is stably colonized by a distinct microbiota that functions together with epidermal cells to maintain a protective physical barrier. Staphylococcus, a prominent genus of the skin microbiota, participates in colonization resistance, tissue repair, and host immune regulation in strain specific manners. To unlock the potential of engineering skin microbial communities, we aim to fully characterize the functional diversity of this genus within the context of the skin environment. We conducted metagenome and pan-genome analyses of isolates obtained from distinct body sites of healthy volunteers, providing a detailed biogeographic depiction of staphylococcal species that colonize our skin. S. epidermidis, S. capitis, and S. hominis were the most abundant species present in all volunteers and were detected at all body sites. Pan-genome analysis of these three species revealed that the genus-core was dominated by central metabolism genes. Species-specific core genes were enriched in host colonization functions. The majority (~68%) of genes were detected only in a fraction of isolate genomes, underscoring the immense strain-specific gene diversity. Conspecific genomes grouped into phylogenetic clades, exhibiting body site preference. Each clade was enriched for distinct gene-sets that are potentially involved in site tropism. Finally, we conducted gene expression studies of select isolates showing variable growth phenotypes in skin-like medium. In vitro expression revealed extensive intra- and inter-species gene expression variation, substantially expanding the functional diversification within each species. Our study provides an important resource for future ecological and translational studies to examine the role of shared and strain-specific staphylococcal genes within the skin environment.

Keywords: Staphylococcus capitis; Staphylococcus epidermidis; Staphylococcus hominis; gene expression; growth curve; metagenomics; pan-genomics; phylogenetics; skin microbiota; staphylococci.


Conflict of interest statement

DECLARATION OF INTERESTS The authors declare no competing interests.

Figures

Figure 1.
Figure 1.. Diversity of staphylococcal species present on healthy human skin
(A) Barplots display the relative abundance of staphylococcal species at 14 body sites. Each color represents a distinct species as shown in the legend. Each bar represents one Subject/Healthy Volunteer (HV). Empty bars represent missing data. (B) Beta diversity analysis of staphylococcal communities present at different body sites using principal-coordinate analysis (PCoA) plot based on Bray-Curtis dissimilarity (PERMANOVA; R2 = 0.26804, P value < 0.0001). First two coordinates are shown accounting for 40.62% of the total variance. Individual staphylococcal ASVs driving the largest separation of body sites (displayed as colored dots) are shown as black arrows and are labeled by the corresponding species. Note that the body site legend is shared between figures B and C. (C) Relative abundance and prevalence of staphylococcal species detected in our dataset. Each dot represents proportion of a staphylococcal species relative to all other staphylococcal species in a sample. Dots are colored by body sites as shown in the shared legend. Percent prevalence threshold for a species to be considered part of the core staphylococcal community is shown in the upper gray bar (see text for details). Refer to Fig. S1 for body site details.
Figure 2.
Figure 2.. Genus-level pan-genome summary to quantify gene sharing between species.
(A) Histogram of core, soft-core, shell, and cloud genes of the genus-pangenome. Pie chart shows the number of genes in each category as defined in the legend; percent of genes in each category are displayed in brackets. (B) Venn diagram displaying the distribution of 7744 genes between the three species. Number of total genes in each intersection are shown outside the bracket and core genes in each intersection (genes detected in ≥ 95% genomes present in the intersection set) are shown inside brackets. (C) Clustering of all 126 genomes using Euclidean distance and Ward hierarchical clustering based on the presence/absence patterns of 7744 genes detected in the pan-genome. Sidebars display species, volunteer, and body site of isolation for each genome. (D) Pairwise Jaccard index between genomes displaying the proportion of shared gene content. Note: Distance of 1.0 depicts complete gene overlap, with lower numbers representing lesser degree of gene sharing. Hierarchical clustering of genomes and the displayed sidebars are the same as that shown in figure C. Note that the legend is shared between figures C and D. Refer to Fig. S1 for body site details.
Figure 3.
Figure 3.. Core metabolic pathways present in staphylococcal genomes using KEGG module analysis.
Completeness of a pathway is expressed as a percentage from 0 to 100. Only pathways that showed ³ 75% module completeness in at least one genome are shown. Hierarchical clustering (Euclidean distance; Ward) of species is shown as a dendrogram. Details of modules can be found at: https://www.genome.jp/brite/ko00002
Figure 4.
Figure 4.. Species-restricted core genes relevant to skin colonization.
Presence/absence patterns of select genes/loci that encode a complete pathway (by themselves or along with genus-core genes) and have a known role in skin colonization are shown. Gene ID, gene names and function encoded by each gene is shown on the right. Hierarchical clustering (Euclidean distance; Ward) of species is shown as a dendrogram on top.
Figure 5.
Figure 5.. Relationship between phylogeny and pan-genome in conspecific staphylococcal genomes.
(A-C) Tanglegrams depicting the relationship between the phylogenetic tree based on core genes sequence alignment (left) and hierarchical clustering (binary distance; average linkage) of the pan-genome presence/absence matrix (right). Clades A and B for each species are shown in purple and orange color, respectively. Colored lines are used to connect the same isolate on two trees of the tanglegram. Healthy volunteer and body site of isolation for each isolate are displayed as colored strips within the tanglegram. (D) Correlation between phylogenetic distance and pan-genome distance for all pair-wise genome comparisons within a species. Each dot represents one pair-wise comparison. Dot colors represent the clades to which the genomes being compared belong, with yellow color dots representing clade A vs clade B comparison. Refer to Fig. S1 for body site details.
Figure 6:
Figure 6:. Kinetic growth analyses of select staphylococcal isolates in BHI-YE and artificial skin media, ES and ESL.
(A-C) Growth curves of select S. epidermidis, S. capitis, and S. hominis isolates grown independently in three culture media, as measured by absorbance at 600nm over 24 hours. Each growth curve is an average of four independent biological replicates; error bars for each curve are shown. Isolates marked with an asterisk (*) were selected for RNA-Seq analyses. Purple and orange color of facets indicates the phylogenetic clade to which each isolate belongs. Growth curve color represents the growth medium. (D-F) The area under the curve (AUC) was used to quantify the growth of each isolate shown in A-C. Boxplots depict combined AUC values for all isolates of a species in each growth medium, as depicted by the color of the boxplot. The center black line within each boxplot represents the median value, with edges showing the first and third quartiles. Individual AUC values are shown as dots colored by clade of the isolate. Note that the legend is shared between all figures.
Figure 7:
Figure 7:. RNA-Seq analysis of nine distinct staphylococcal isolates in BHI-YE and in artificial skin media, ES and ESL (N = 3 biological replicates).
(A) Principal-component analysis of variance stabilizing transformation-normalized reads from all RNA-seq samples and 1647 genus-core genes. Colors represent different growth media, and shapes represents staphylococcal species. (B) A stacked barplot representing the proportion of genus-core, species-core, and accessory within the top 10 down- and up-regulated genes in each isolate in the ES medium relative to BHI-YE. (C) A discrete heatmap of log2-fold changes of all the genes that were differentially expressed (≥ or ≤ 2-fold change, adjusted P value < 0.05) in ES relative to BHI-YE. Columns are individual isolates and rows are differentially expressed genes. Genes upregulated in the ES medium are shown in red, downregulated genes are in purple. Light pink cells represent genes that were encoded within an isolate genome, but not differentially expressed in that isolate. Grey cells denote genes that were absent in the isolate genome. The left sidebar depicts the category to which each gene belongs. Top and side dendrograms were generated by unsupervised clustering of the expression data (Euclidean distance; Ward). (D) KEGG pathway enrichment analysis of differentially expressed genes in ES medium relative to BHI-YE in each isolate. The x-axis and y-axis show the isolate and pathway, respectively. Bubble size shows GeneRatio and color indicates adjusted P value.

References

    1. Proksch E., Brandner J. M., Jensen J. M., The skin: an indispensable barrier. Exp Dermatol 17, 1063–1072 (2008). - PubMed
    1. Oh J. et al., Biogeography and individuality shape function in the human skin metagenome. Nature 514, 59–64 (2014). - PMC - PubMed
    1. Oh J. et al., Temporal Stability of the Human Skin Microbiome. Cell 165, 854–866 (2016). - PMC - PubMed
    1. Harris-Tryon T. A., Grice E. A., Microbiota and maintenance of skin barrier function. Science 376, 940–945 (2022). - PubMed
    1. Otto M., Staphylococci in the human microbiome: the role of host and interbacterial interactions. Curr Opin Microbiol 53, 71–77 (2020). - PubMed

Publication types

LinkOut - more resources