A pyroptosis-related gene signature that predicts immune infiltration and prognosis in colon cancer
- PMID: 37503314
- PMCID: PMC10369052
- DOI: 10.3389/fonc.2023.1173181
A pyroptosis-related gene signature that predicts immune infiltration and prognosis in colon cancer
Abstract
Background: Colon cancer (CC) is a highly heterogeneous malignancy associated with high morbidity and mortality. Pyroptosis is a type of programmed cell death characterized by an inflammatory response that can affect the tumor immune microenvironment and has potential prognostic and therapeutic value. The aim of this study was to evaluate the association between pyroptosis-related gene (PRG) expression and CC.
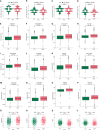
Methods: Based on the expression profiles of PRGs, we classified CC samples from The Cancer Gene Atlas and Gene Expression Omnibus databases into different clusters by unsupervised clustering analysis. The best prognostic signature was screened and established using least absolute shrinkage and selection operator (LASSO) and multivariate COX regression analyses. Subsequently, a nomogram was established based on multivariate COX regression analysis. Next, gene set enrichment analysis (GSEA) and gene set variation analysis (GSVA) were performed to explore the potential molecular mechanisms between the high- and low-risk groups and to explore the differences in clinicopathological characteristics, gene mutation characteristics, abundance of infiltrating immune cells, and immune microenvironment between the two groups. We also evaluated the association between common immune checkpoints and drug sensitivity using risk scores. The immunohistochemistry staining was utilized to confirm the expression of the selected genes in the prognostic model in CC.
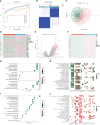
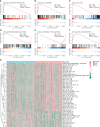
Results: The 1163 CC samples were divided into two clusters (clusters A and B) based on the expression profiles of the 33 PRGs. Genes with prognostic value were screened from the DEGs between the two clusters, and an eight PRGs prognostic model was constructed. GSEA and GSVA of the high- and low-risk groups revealed that they were mainly enriched in inflammatory response-related pathways. Compared to those in the low-risk group, patients in the high-risk group had worse overall survival, an immunosuppressive microenvironment, and worse sensitivity to immunotherapy and drug treatment.
Conclusion: Our findings provide a foundation for future research targeting pyroptosis and new insights into prognosis and immunotherapy from the perspective of pyroptosis in CC.
Keywords: colon cancer; prognosis; pyroptosis; risk signature; tumor immune microenvironment.
Copyright © 2023 Wu, Hao, Wang, Su, Du, Zhou, Yang and Du.
Conflict of interest statement
The authors declare that the research was conducted in the absence of any commercial or financial relationships that could be construed as a potential conflict of interest.
Figures


Similar articles
-
Pyroptosis-Related Gene Signature Predicts Prognosis and Indicates Immune Microenvironment Infiltration in Glioma.Front Cell Dev Biol. 2022 Apr 25;10:862493. doi: 10.3389/fcell.2022.862493. eCollection 2022. Front Cell Dev Biol. 2022. PMID: 35547808 Free PMC article.
-
A pyroptosis-related gene signature predicts prognosis and immune microenvironment in hepatocellular carcinoma.World J Surg Oncol. 2022 Jun 3;20(1):179. doi: 10.1186/s12957-022-02617-y. World J Surg Oncol. 2022. PMID: 35659304 Free PMC article.
-
Pyroptosis related genes signature predicts prognosis and immune infiltration of tumor microenvironment in hepatocellular carcinoma.BMC Cancer. 2022 Sep 20;22(1):999. doi: 10.1186/s12885-022-10097-2. BMC Cancer. 2022. PMID: 36127654 Free PMC article.
-
Identification of cuproptosis-related subtypes, construction of a prognosis model, and tumor microenvironment landscape in gastric cancer.Front Immunol. 2022 Nov 21;13:1056932. doi: 10.3389/fimmu.2022.1056932. eCollection 2022. Front Immunol. 2022. PMID: 36479114 Free PMC article.
-
Development and Validation of a Robust Pyroptosis-Related Signature for Predicting Prognosis and Immune Status in Patients with Colon Cancer.J Oncol. 2021 Nov 18;2021:5818512. doi: 10.1155/2021/5818512. eCollection 2021. J Oncol. 2021. PMID: 34840571 Free PMC article.
Cited by
-
In-depth study of pyroptosis-related genes and immune infiltration in colon cancer.PeerJ. 2024 Oct 29;12:e18374. doi: 10.7717/peerj.18374. eCollection 2024. PeerJ. 2024. PMID: 39494275 Free PMC article.
References
-
- Amin MB, Greene FL, Edge SB, Compton CC, Gershenwald JE, Brookland RK, et al. . The eighth edition AJCC cancer staging manual: continuing to build a bridge from a population-based to a more "personalized" approach to cancer staging. CA Cancer J Clin (2017) 67(2):93–9. doi: 10.3322/caac.21388 - DOI - PubMed
-
- Hegde M, Ferber M, Mao R, Samowitz W, Ganguly A, Working Group of the American College of Medical G et al. . ACMG technical standards and guidelines for genetic testing for inherited colorectal cancer (Lynch syndrome, familial adenomatous polyposis, and MYH-associated polyposis). Genet Med (2014) 16(1):101–16. doi: 10.1038/gim.2013.166 - DOI - PubMed
LinkOut - more resources
Full Text Sources

