. 2023 Sep 22;51(17):9369-9384.
doi: 10.1093/nar/gkad613.

BLM helicase protein negatively regulates stress granule formation through unwinding RNA G-quadruplex structures

Affiliations

BLM helicase protein negatively regulates stress granule formation through unwinding RNA G-quadruplex structures

Yehuda M Danino et al. Nucleic Acids Res. .

Abstract

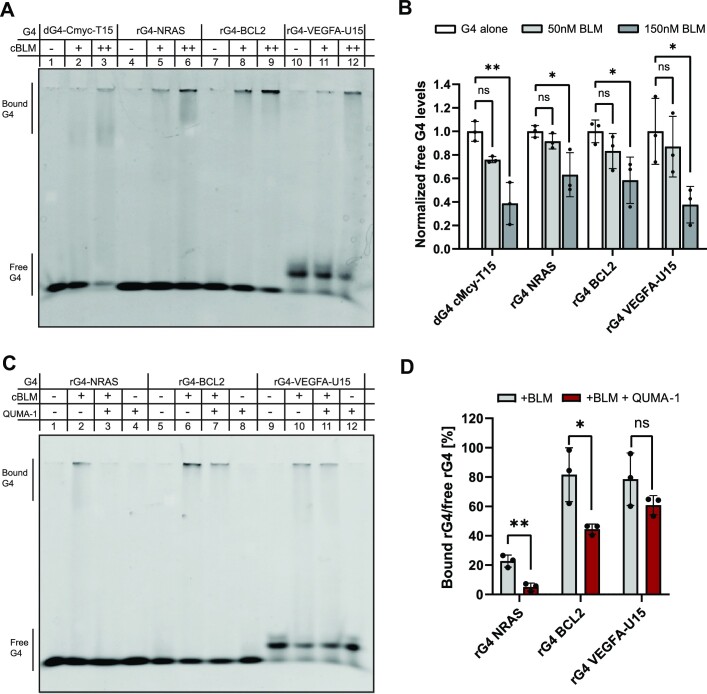
Bloom's syndrome (BLM) protein is a known nuclear helicase that is able to unwind DNA secondary structures such as G-quadruplexes (G4s). However, its role in the regulation of cytoplasmic processes that involve RNA G-quadruplexes (rG4s) has not been previously studied. Here, we demonstrate that BLM is recruited to stress granules (SGs), which are cytoplasmic biomolecular condensates composed of RNAs and RNA-binding proteins. BLM is enriched in SGs upon different stress conditions and in an rG4-dependent manner. Also, we show that BLM unwinds rG4s and acts as a negative regulator of SG formation. Altogether, our data expand the cellular activity of BLM and shed light on the function that helicases play in the dynamics of biomolecular condensates.


Figures

Graphical Abstract
Graphical Abstract
Figure 1.
Figure 1.
BLM is a resident protein of stress granules. (A) Confocal micrographs of BLM immunostaining (Cy5, Purple), in U2OS cells under a variety of stressors and co-localization with stress granule marker G3BP1-GFP (green). Nuclei (DAPI, blue). ×63 lens. Scale bar – 20 um. Inset scale bar 2 um. Intensity profiles for SGs and BLM channels in representative SGs under different stress conditions using Fiji software. (B) Box plot of BLM enrichment in SGs, which were quantified from micrographs of >30 cells per treatment. Median (|) and mean (+). Analyzed using Fiji software.
Figure 2.
Figure 2.
BLM binds rG4s in vitro. (A) Representative blot from an electromobility shift assay of DNA (CMyc-dG4-T15) or RNA (rG4-NRAS, rG4-BCL2 and rG4-VEGFA-U15) G4 forming sequences without/with recombinant core BLM protein (+ for 50 nM or ++ for 150 nM). (B) Quantification of the free rG4 signal for each of the oligos tested in panel (A). Data normalized to free G4 signal obtained from the lane of G4 without protein for each oligo (lanes 1, 4, 7, 10). Three experimental repeats. (C) Representative EMSA of RNA G4 forming sequences, bound to 150nM recombinant core BLM protein with/without rG4-binder QUMA-1 (1 uM). (D) Quantification of the normalized core BLM-bound rG4 signal with/without competition on rG4 by QUMA-1 (1 uM) for each of the oligos tested in panel (C). Data normalized to the free rG4 signal obtained from the lane of rG4 without protein/QUMA-1 for each oligo (lanes 1, 5, 9). Three experimental repeats. One-way ANOVA with Dunett's test (B) and two-tailed unpaired t-test (D); ns, non-significant; * P-value < 0.05, ** P-value < 0.01, *** P-value < 0.001, **** P-value < 0.0001.
Figure 3.
Figure 3.
BLM unwinds rG4s in vitro and in cultured cells. In-vitro unwinding assay monitored in real-time, as the relative emission of a 6FAM-labelled fluorescent short oligo (% unwound) unwound from a dabcyl labelled quencher oligo, VEGFA-rG4-U15, and in response to (A) cBLM concentrations (1, 4, 8, 16 uM) with ATP addition (+ATP) or (B) 8 uM cBLM in addition of ATP or a non hydrolysable analogue ATPgS (+ATP/+ATPgS). Data normalized to 0 formula image cBLM and to the first time point, per condition. Average of two or five technical repeats in A or B, respectively; Two-way ANOVA repeated measure with Tukey's test for multiple comparisons. Representative scatter plots of the endogenous rG4 signal gained by quantification of QUMA-1 staining in (C) U2OS cells with siRNA knock-down of Dhx36 or Blm. Stress induced by sodium arsenate, 150 uM, 2.5 hr. siControl non-targeting oligonucleotides served as controls, or (D) RPE wild-type versus BLM KO cells. Three experimental repeats; log2-transformed rG4 intensity in individual cell, normalized to the cell area. Horizontal line - mean. Representative box plots of endogenous rG4 signal, gained by QUMA-1 quantification in stress granules, relative to adjacent cytoplasm of (E) U2OS cells or (F) RPE wild-type versus BLM KO cells, under conditions identical to those in panels C and D. Three experimental repeats; Median (|) and mean (+) of log2-transformation of rG4 enriched signal in stress granules. One-way ANOVA with Dunnett's test (C, E), Two-tailed (D) or one-tailed (F) unpaired t-test. * P-value < 0.05, ** P-value < 0.01, *** P-value < 0.001, **** P-value < 0.0001.
Figure 4.
Figure 4.
BLM is recruited to SGs in an rG4-dependent manner. (A) Diagram of the experimental design. (B) Principal component analysis of the proteomic content of APEX-isolated stress granules under QUMA-1 treatment (1 uM, 3 hr) or control (carrier, DMSO). (C) A volcano plot of APEX-isolated SG proteins, obtained under QUMA-1 treatment (orange), relative to DMSO control (blue). Y-axis –log10 of P-value (P-value < 0.05) and x-axis, log2 values of fold-change. BLM is highlighted in red. Grey proteins were lacking statistical significance. (D) Heatmap of unsupervised clustering of the final 472 SG-associated proteins that were enriched or depleted under experimental conditions in stress granules (upper), and bar plot represents BLM’s intensity under QUMA-1 or DMSO conditions (orange/blue, lower). FDR corrected P-value (* adjusted P-value < 0.05). (E) APEX-isolated SG proteins blotted with anti-BLM antibody after QUMA-1 treatment normalized to DMSO control. BLM is represented at ∼169 kDa. (F) Representative box plot of BLM enrichment in SGs. Quantification of immuno-stained confocal micrographs with median (|) and mean (+) of log2-transformation of BLM enriched signal in SGs, relative to adjacent cytoplasm of U2OS cells. Three experimental repeats. Two-tailed unpaired t-test, * P-value < 0.05 (E),*** P-value < 0.001 (F).
Figure 5.
Figure 5.
BLM negatively regulates SG formation. Quantification of the ratio of SG area, to the cell area, by live imaging of G3BP1-GFP in U2OS cells treated with 150 uM of sodium arsenate for 2.5 hr. siRNA knockdown of (A) Dhx36, or (B) Blm compared to siControl. Over-expression of (C) mCherry-DHX36, or (D) mCherry-BLM compared to mCherry-only overexpression control. Four sites per well, 3–4 wells per condition. Three independent repeats. Two-way ANOVA repeated measures with FDR correction, **** P-value < 0.0001. (E) Box plot quantification of data from (A, B) and (F) Box plot quantification of data from (C, D), 120 min after stress induction. Data normalized to control average, per repeat. One-way ANOVA with Dunnett's test, *P-value < 0.05, **P-value < 0.01, ***P-value < 0.001. (G) Bar plot of the percentage of stress granule-positive U2OS cells with overexpression of mCherry-DHX36 or mCherry-BLM, compared mCherry only as a control. ImageStream study, one-way ANOVA with Dunett's test, *P-value < 0.05. (H) Representative micrograph channels: G3BP1-GFP (green), mCherry (red), Hoechst 44432 (Blue). (I) A model for the regulatory role of BLM in SG formation through the unwinding of rG4. BLM is recruited to SGs, where plausibly it performs its rG4 helicase activity.

References

    1. Fay M.M., Lyons S.M., Ivanov P.. RNA G-quadruplexes in biology: principles and molecular mechanisms. J. Mol. Biol. 2017; 429:2127–2147. - PMC - PubMed
    1. Kwok C.K., Marsico G., Balasubramanian S.. Detecting RNA G-quadruplexes (rG4s) in the transcriptome. Cold Spring Harb. Perspect. Biol. 2018; 10:a032284. - PMC - PubMed
    1. Varshney D., Spiegel J., Zyner K., Tannahill D., Balasubramanian S.. The regulation and functions of DNA and RNA G-quadruplexes. Nat. Rev. Mol. Cell Biol. 2020; 21:459–474. - PMC - PubMed
    1. Yang S.Y., Lejault P., Chevrier S., Boidot R., Gordon Robertson A., Wong J.M.Y., Monchaud D.. Transcriptome-wide identification of transient RNA G-quadruplexes in human cells. Nat. Commun. 2018; 9:4730. - PMC - PubMed
    1. Yang S.Y., Monchaud D., Wong J.M.Y.. Global mapping of RNA G-quadruplexes (G4-RNAs) using G4RP-seq. Nat. Protoc. 2022; 17:870–889. - PubMed

Publication types