

A Comprehensive Machine Learning Benchmark Study for Radiomics-Based Survival Analysis of CT Imaging Data in Patients With Hepatic Metastases of CRC
- PMID: 37504498
- PMCID: PMC10662603
- DOI: 10.1097/RLI.0000000000001009
A Comprehensive Machine Learning Benchmark Study for Radiomics-Based Survival Analysis of CT Imaging Data in Patients With Hepatic Metastases of CRC
Abstract
Objectives: Optimizing a machine learning (ML) pipeline for radiomics analysis involves numerous choices in data set composition, preprocessing, and model selection. Objective identification of the optimal setup is complicated by correlated features, interdependency structures, and a multitude of available ML algorithms. Therefore, we present a radiomics-based benchmarking framework to optimize a comprehensive ML pipeline for the prediction of overall survival. This study is conducted on an image set of patients with hepatic metastases of colorectal cancer, for which radiomics features of the whole liver and of metastases from computed tomography images were calculated. A mixed model approach was used to find the optimal pipeline configuration and to identify the added prognostic value of radiomics features.
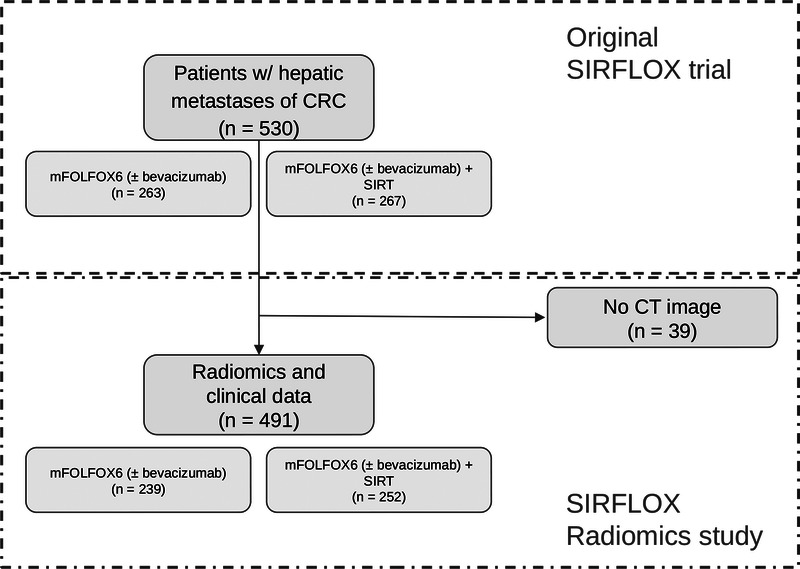
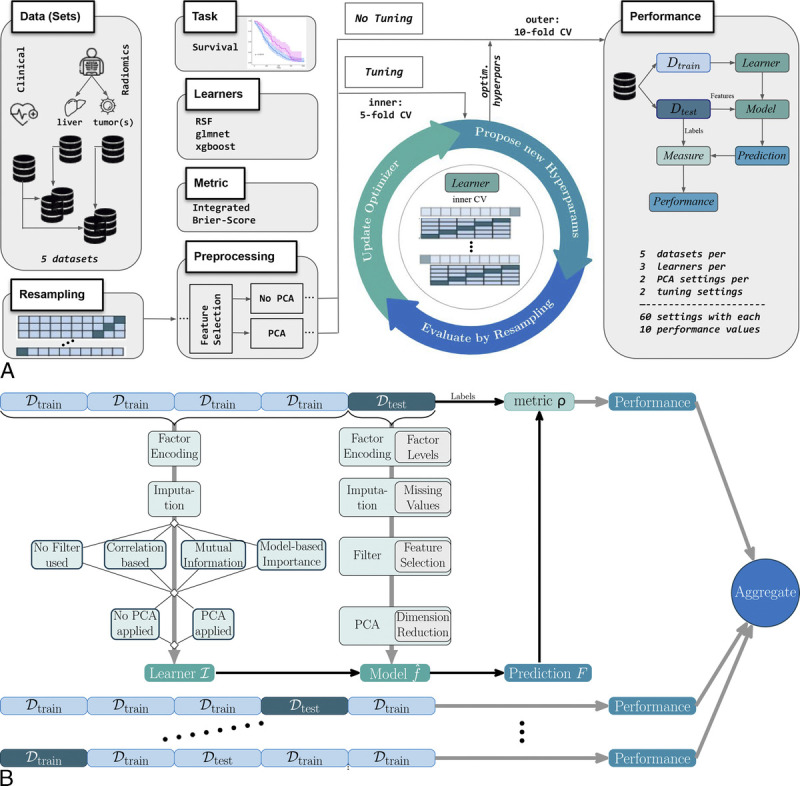
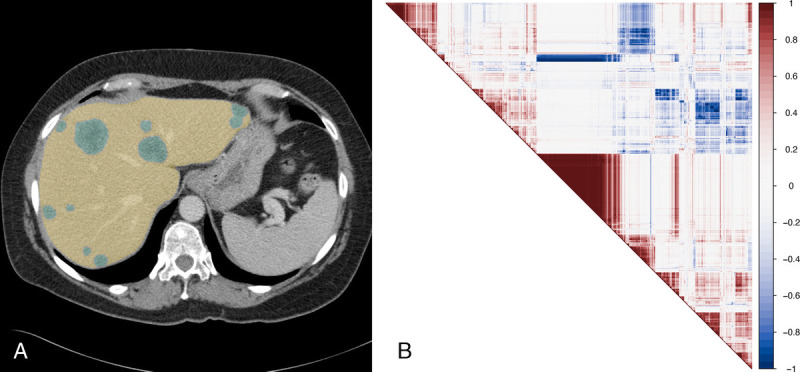
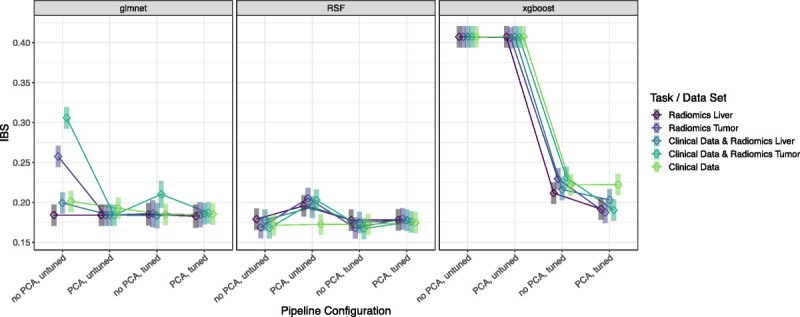
Materials and methods: In this study, a large-scale ML benchmark pipeline consisting of preprocessing, feature selection, dimensionality reduction, hyperparameter optimization, and training of different models was developed for radiomics-based survival analysis. Portal-venous computed tomography imaging data from a previous prospective randomized trial evaluating radioembolization of liver metastases of colorectal cancer were quantitatively accessible through a radiomics approach. One thousand two hundred eighteen radiomics features of hepatic metastases and the whole liver were calculated, and 19 clinical parameters (age, sex, laboratory values, and treatment) were available for each patient. Three ML algorithms-a regression model with elastic net regularization (glmnet), a random survival forest (RSF), and a gradient tree-boosting technique (xgboost)-were evaluated for 5 combinations of clinical data, tumor radiomics, and whole-liver features. Hyperparameter optimization and model evaluation were optimized toward the performance metric integrated Brier score via nested cross-validation. To address dependency structures in the benchmark setup, a mixed-model approach was developed to compare ML and data configurations and to identify the best-performing model.
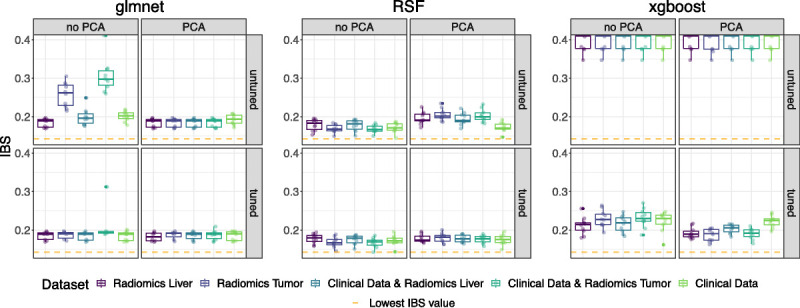
Results: Within our radiomics-based benchmark experiment, 60 ML pipeline variations were evaluated on clinical data and radiomics features from 491 patients. Descriptive analysis of the benchmark results showed a preference for RSF-based pipelines, especially for the combination of clinical data with radiomics features. This observation was supported by the quantitative analysis via a linear mixed model approach, computed to differentiate the effect of data sets and pipeline configurations on the resulting performance. This revealed the RSF pipelines to consistently perform similar or better than glmnet and xgboost. Further, for the RSF, there was no significantly better-performing pipeline composition regarding the sort of preprocessing or hyperparameter optimization.
Conclusions: Our study introduces a benchmark framework for radiomics-based survival analysis, aimed at identifying the optimal settings with respect to different radiomics data sources and various ML pipeline variations, including preprocessing techniques and learning algorithms. A suitable analysis tool for the benchmark results is provided via a mixed model approach, which showed for our study on patients with intrahepatic liver metastases, that radiomics features captured the patients' clinical situation in a manner comparable to the provided information solely from clinical parameters. However, we did not observe a relevant additional prognostic value obtained by these radiomics features.
Copyright © 2023 The Author(s). Published by Wolters Kluwer Health, Inc.
Conflict of interest statement
Conflicts of interest and sources of funding: none declared.
Figures
References
-
- Kocak B Bulut E Bayrak ON, et al. . Negative results in radiomics research (NEVER): a meta-research study of publication bias in leading radiology journals. Eur J Radiol. 2023;163:110830. - PubMed
-
- Bommert A Sun X Bischl B, et al. . Benchmark for filter methods for feature selection in high-dimensional classification data. Comput Stat Data Anal. 2020;143:106839.
-
- Bischl B Binder M Lang M, et al. . Hyperparameter optimization: foundations, algorithms, best practices, and open challenges. WIREs Data Min Knowl Discov. 2023;13:e1484.
MeSH terms
LinkOut - more resources
Full Text Sources
Medical
