. 2023 Jun 24;21(7):371.
doi: 10.3390/md21070371.

Ircinia ramosa Sponge Extract (iSP) Induces Apoptosis in Human Melanoma Cells and Inhibits Melanoma Cell Migration and Invasiveness

Affiliations

Ircinia ramosa Sponge Extract (iSP) Induces Apoptosis in Human Melanoma Cells and Inhibits Melanoma Cell Migration and Invasiveness

Benedetta Romano et al. Mar Drugs. .

Abstract

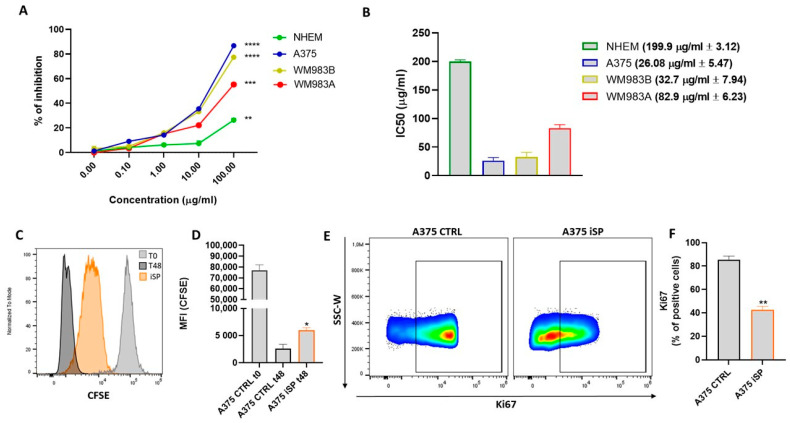
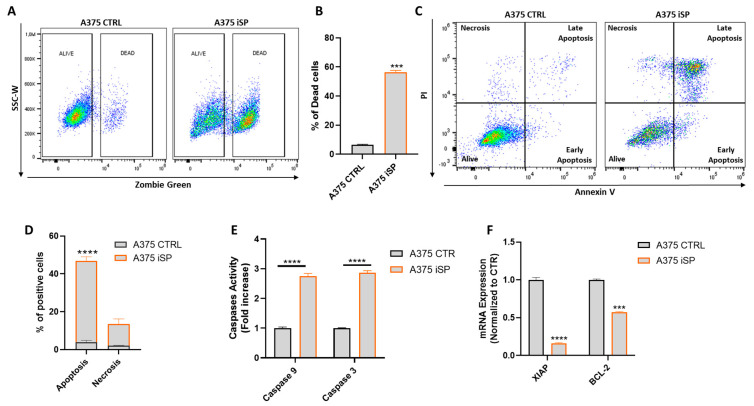
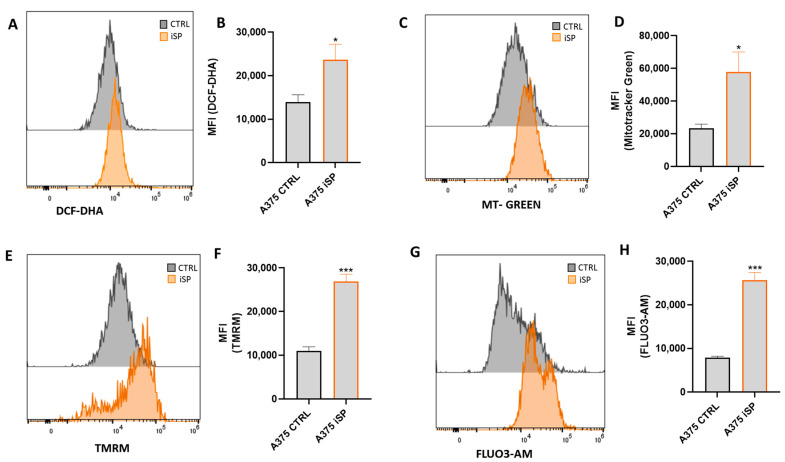
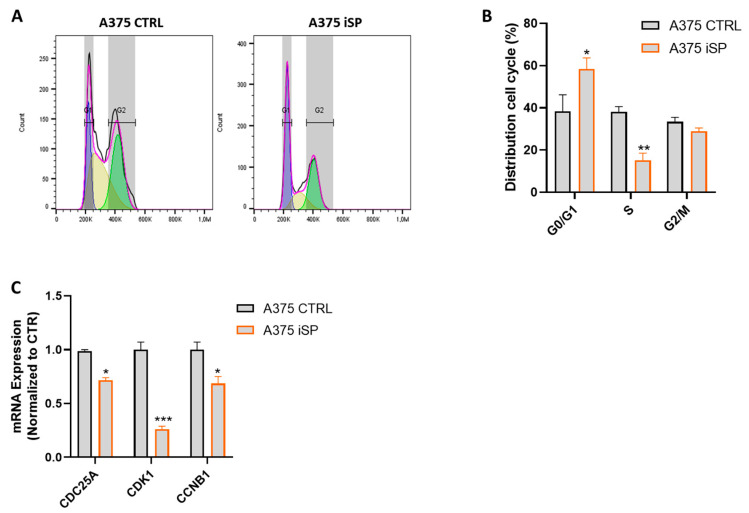
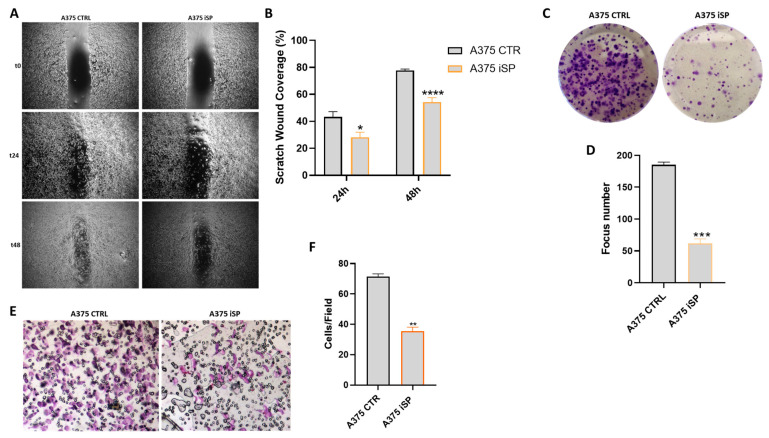
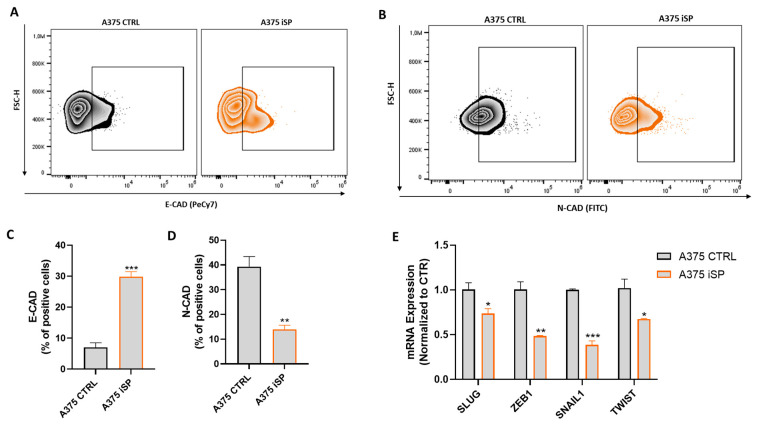
Marine compounds represent a varied source of new drugs with potential anticancer effects. Among these, sponges, including those belonging to the Irciniidae family, have been demonstrated to exert cytotoxic effects on different human cancer cells. Here, we investigated, for the first time, the therapeutic effect of an extract (referred as iSP) from the sponge, Ircinia ramosa (Porifera, Dictyoceratida, and Irciniidae), on A375 human melanoma cells. We found that iSP impaired A375 melanoma cells proliferation, induced cell death through caspase-dependent apoptosis and arrested cells in the G1 phase of the cell cycle, as demonstrated via both flow cytometry and qPCR analysis. The proapoptotic effect of iSP is associated with increased ROS production and mitochondrial modulation, as observed by using DCF-DHA and mitochondrial probes. In addition, we performed wound healing, invasion and clonogenic assays and found that iSP was able to restrain A375 migration, invasion and clonogenicity. Importantly, we observed that an iSP treatment modulated the expression of the EMT-associated epithelial markers, E-CAD and N-CAD, unveiling the mechanism underlying the effect of iSP in modulating A375 migration and invasion. Collectively, this study provides the first evidence to support the role of Ircinia ramosa sponge extracts as a potential therapeutic resource for the treatment of human melanoma.

Keywords: EMT; Ircinia ramosa; ROS; apoptosis; marine compounds; melanoma; sponges.


Conflict of interest statement

The authors declare no conflict of interest.

Figures

Figure 1
Figure 1
iSP affects the proliferation rate of human melanoma cell lines. (A) Antiproliferative effect of iSP (0.1–100 μg/mL) was assessed via MTT assay in A375, WM983A, and WM983B melanoma cells and normal human epidermal melanocytes (NHEM) at 48 h. (B) IC50 values for iSP-treated A375, WM983A, and WM983B melanoma cells and NHEM. (C) Representative example of flow cytometry analysis of CFSE staining in A375 after staining (grey histogram) and after 48 h treatment (orange histogram) or not (black histogram) with iSP 30 μg/mL. (D) CFSE quantification in terms of mean fluorescence intensity (MFI). (E) Representative example of flow cytometry analysis of A375-derived Ki67 upon treatment or not for 48 h with iSP 30 μg/mL. (F) Frequency of Ki67 in A375 after treatment (orange bar) or not (black bar) with iSP 30 μg/mL. Data are shown as mean ± SEM of at least three independent experiments (* p < 0.05; ** p < 0.01; *** p < 0.001 **** p < 0.0001 vs. A375 CTRL).
Figure 2
Figure 2
iSP induces apoptosis in A375 human melanoma cells. (A) Representative example of flow cytometry analysis of Zombie Green staining in A375 upon 48 h treatment or not with iSP 30 μg/mL. (B) Frequency of dead cells after treatment (orange bar) or not (black bar) for 48 h with iSP 30 μg/mL. (C) Representative example of annexin V/propidium iodide (PI) staining after 48 h treatment or not with iSP 30 μg/mL. (D) Frequency of apoptotic cells after treatment (orange bar) or not (black bar) for 48 h with iSP 30 μg/mL. (E) Activation of Caspase 9 and 3 in A375 upon 48 h treatment (orange bar) or not (black bar) for 48 h with iSP 30 μg/mL. (F) Expression of XIAP and BCL−2 assessed by qPCR in A375 upon 48 h treatment (orange bar) or not (black bar) with iSP 30 μg/mL. Data are shown as mean ± SEM of at least three independent experiments (*** p < 0.001; **** p < 0.0001 vs. A375 CTRL).
Figure 3
Figure 3
iSP induced ROS production and modulated mitochondrial fitness in melanoma cells. (AG) Representative examples of flow cytometry analysis of DCF-DHA, (A) MitoTracker Green, (C) TMRM, (E) and FLUO3-AM (G) in untreated A375 cells (black histograms) and after iSP treatment (orange histograms) for 24 h, with their respective quantification in terms of mean fluorescence intensity (MFI) (B,D,F,H). Data are shown as mean ± SEM of at least three independent experiments (* p < 0.05; *** p < 0.001 vs. A375 CTRL).
Figure 4
Figure 4
iSP induced cell cycle arrest in A375 human melanoma cell line. (A) Representative example of cell cycle distribution in A375 after 24 h treatment or not with iSP 30 μg/mL. (B) Frequency of A375 cells in G0/G1, S and G2/M cell cycle distribution in A375 after treatment (orange bar) or not (black bar) for 24 h with iSP 30 μg/mL. (C) Expression of CCNB1, CDK1 and CDC25C, assessed via qPCR of A375, after 24 h treatment (green bar) or not (black bar) with ERU 30 μM. Data are shown as mean ± SEM of at least three independent experiments (* p < 0.05; ** p < 0.01; *** p < 0.001; vs. A375 CTRL).
Figure 5
Figure 5
iSP inhibited melanoma cell migration and colony formation (A) Representative example of wound healing assay of A375 cells after incubation with iSP 1 μg/mL for 24 and 48 h. (B) Quantification of the healed wound area at 24 and 48 h. (C,D) Representative example (C) and quantification (D) of clonogenic assays of A375 cells after incubation with iSP 1 μg/mL. (E) Representative example of invasion assay of A375 cells after incubation with iSP 1 μg/mL. (F) Average number of invasive cells per field. Data are shown as mean ± SEM of at least three independent experiments (* p < 0.05; ** p < 0.01; *** p < 0.001; **** p < 0.0001 vs. A375 CTRL).
Figure 6
Figure 6
iSP modulated the expression of ECAD and EMT-related transcription factors. (A) Representative example of flow cytometry analysis of A375-derived E-CAD after treatment (orange dot plot) or not (black dot plot) with iSP 1 μg/mL for 24 h. (B) Representative example of flow cytometry analysis of A375-derived N-CAD after treatment (orange dot plot) or not (black dot plot) with iSP 1 μg/mL for 24 h. (C) Frequency of E-CAD in A375 after treatment (orange bar) or not (black bar) with iSP 1 μg/mL. (D) Frequency of N-CAD in A375 after treatment (orange bar) or not (black bar) with iSP 1 μg/mL. (E) Expression of SLUG, ZEB1, SNAIL and TWIST assessed by qPCR in A375 upon 48 h treatment (orange bar) or not (black bar) with iSP 1 μg/mL. Data are shown as mean ± SEM of at least three independent experiments (* p < 0.05; ** p < 0.01; *** p < 0.001 vs. A375 CTRL).

Similar articles

Cited by

References

    1. Arnold M., Singh D., Laversanne M., Vignat J., Vaccarella S., Meheus F., Cust A.E., de Vries E., Whiteman D.C., Bray F. Global Burden of Cutaneous Melanoma in 2020 and Projections to 2040. JAMA Dermatol. 2022;158:495–503. - PMC - PubMed
    1. Ercolano G., De Cicco P., Ianaro A. New Drugs from the Sea: Pro-Apoptotic Activity of Sponges and Algae Derived Compounds. Mar. Drugs. 2019;17:31. doi: 10.3390/md17010031. - DOI - PMC - PubMed
    1. Holmes D. The cancer that rises with the sun. Nature. 2014;515:S110–S111. doi: 10.1038/515S110a. - DOI - PubMed
    1. Sun X., Zhang N., Yin C., Zhu B., Li X. Ultraviolet Radiation and Melanomagenesis: From Mechanism to Immunotherapy. Front. Oncol. 2020;10:951. - PMC - PubMed
    1. Ascierto P.A., Kirkwood J.M., Grob J.J., Simeone E., Grimaldi A.M., Maio M., Palmieri G., Testori A., Marincola F.M., Mozzillo N. The role of BRAF V600 mutation in melanoma. J. Transl. Med. 2012;10:85. doi: 10.1186/1479-5876-10-85. - DOI - PMC - PubMed