. 2023 Jul 3;64(10):35.
doi: 10.1167/iovs.64.10.35.

Molecular, Cellular, and Functional Heterogeneity of Retinal and Choroidal Endothelial Cells

Affiliations

Molecular, Cellular, and Functional Heterogeneity of Retinal and Choroidal Endothelial Cells

Soo Jin Kim et al. Invest Ophthalmol Vis Sci. .

Abstract

Purpose: To investigate the endothelial heterogeneity across distinct vascular beds in the inner and outer blood-retinal barriers.

Methods: We evaluated the molecular, cellular, and functional differences between primary human retinal endothelial cells (HRECs) and human choroidal endothelial cells (HCECs) in terms of angiogenic and vasculogenic properties, permeability, and transcytosis. Tube formation assay, cell migration assay, in vitro permeability assay, microfluidic sprouting assay, and transcriptome analysis were performed.

Results: HRECs showed higher proliferation and migration activity than did HCECs, whereas the tube formation ability was similar between HRECs and HCECs. Under angiogenic stimuli, HCECs displayed earlier sprouting angiogenesis, but the overall speed was faster and more stable in HRECs. HRECs expressed higher levels of adherens junctional proteins, whereas the tight junctional genes and transcytosis-related genes were more highly expressed in HCECs. Angiopoietin-2 was predominantly expressed in HRECs, but vascular endothelial growth factor (VEGF) receptors were more strongly expressed in HCECs. Platelet-derived growth factor subunit B (PDGFB) was more highly expressed in HRECs, which correlates to the lower degree of pericyte coverage in choroidal blood vessels.

Conclusions: Retinal and choroidal ECs showed significant cellular and molecular heterogeneities that correlated with their functional characteristics. Retinal ECs are vasculogenic with high migratory characteristics and faster angiogenic sprouting, and they are more responsive to VEGF-induced permeability. In contrast, choroidal ECs express high levels of transcytosis genes, and they are vasculogenic, rather proliferative, adept in generating tip cells, and less responsive to VEGF-induced permeability.


Conflict of interest statement

Disclosure: S.J. Kim, None; J.S. Lim, None; J.H. Park, None; J. Lee, None

Figures

Figure 1.
Figure 1.
Isolation of endothelial cells from human retina and choroid. (A) A schematic diagram of the isolation of endothelial cells from fresh donor eyes using CD31(+) magnetic beads. (B) The mRNA expression levels of PECAM1 and VEGFR2 in CD31-positive endothelial cells and CD31-negative cells isolated from the retina. (C) The mRNA expression levels of PECAM1, VEGFR2, and PLVAP in CD31-positive endothelial cells and CD31-negative cells isolated from the choroid. Error bars indicate standard deviations from qPCR loading replicates.
Figure 2.
Figure 2.
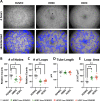
HRECs and HCECs have similar morphologies but different molecular profiles. (A) The morphologies of HUVECs (passage 4), HRECs (passage 2), and HCECs (passage 2) (magnification, 20×). Scale bar: 100 µm. (BG) mRNA expression analysis of VEGF receptors (B) and genes related to pericyte interaction (C), tip cell function (D), transcytosis (E), adherens junction (F), and tight junction (G). Error bars indicate standard error (one-way ANOVA with Tukey's post hoc analysis for multiple comparisons; n = 6 per group, three different cultures each from donor 1 and donor 2). *P < 0.05, **P < 0.01, ***P < 0.001.
Figure 3.
Figure 3.
HRECs and HCECs have similar vasculogenic activities. (A) Brightfield microscopic images of tubes formed by endothelial cells 4 hours after seeding on Matrigel and skeletonized images for analysis (magnification, 4×). Scale bar: 500 µm. (BE) Profiles of the tubes generated by HRECs and HCECs in comparison with HUVECs in terms of number of nodes (B), number of loops (C), length of the tubes (D), and area of the loops (E). Error bars indicate standard error (one-way ANOVA with Tukey's post hoc analysis for multiple comparisons; n = 6 per group, three different cultures each from donor 1 and donor 2). *P < 0.05, **P < 0.01, ***P < 0.001.
Figure 4.
Figure 4.
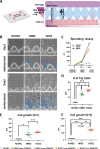
HRECs sprout faster and HCECs make more tip cells. (A) Schematic diagram of a microfluidics chip with a VEGF gradient and interstitial flow. (B) Brightfield images of sprouting endothelial cells and skeletonized images for analysis (day 1 magnification, 20×; day 3 magnification, 10×). Scale bar: 200 µm. Red dots indicate the leading tip cells. (C) Average sprouting length; statistical significance is not indicated. (DF) Number of tip cells at day 3. Cell growth length has been analyzed at day 1 (E) and at day 3 (F). Error bars indicate standard error (one-way ANOVA with Tukey's post hoc analysis for multiple comparisons; n = 6 per group, three different cultures each from donor 1 and donor 2). *P < 0.05, **P < 0.01, ***P < 0.001.
Figure 5.
Figure 5.
HRECs show a migratory behavior and HCECs show a proliferative behavior. (A) Wound closure assay without MMC treatment that tests both proliferative and migratory functions. The wound area was evaluated at 12 hours and 24 hours post-scraping. (B) Wound closure assay with pretreatment of MMC before scraping. (CF) Wound opening areas without MMC treatment (C, E) and with pretreatment of MMC (D, F) were measured and analyzed at 12-hour intervals. Error bars indicate standard error (two-way ANOVA test; n = 6 per group, three different cultures each from donor 1 and donor 2). *P < 0.05, **P < 0.01, ***P < 0.001. (GI) Wound opening areas at 12-hour intervals with or without MMC treatment in HUVECs (G), HRECs (H), and HCECs (I). Error bars indicate standard error (two-way ANOVA test; n = 6 per group, six replicate assays from donor 2). ***P < 0.001 versus MMC(–).
Figure 6.
Figure 6.
HRECs show high permeability in response to VEGF stimulus. (A) Schematic diagram of permeability assay under VEGF stimulus. (B) Staining of cells prior to fixation for confirmation of the breakage of the monolayer. (C) Fluorescence measurement of FITC–dextran after 24 hours of VEGF stimulus. Error bars indicate standard error (Welch's t-test or Student's t-test; n = 6 per group, six different culture assays from donor 2). *P < 0.05.
Figure 7.
Figure 7.
Molecular, cellular, and functional heterogeneities of HRECs and HCECs. A schematic illustration of the relationships between molecular profile differences and functional characteristics. (A) An illustration of retinal and choroidal vessels where the HRECs and HCECs were isolated. (B) HRECs were migratory, and HCECs were proliferative. (C) VEGF responsive permeability was higher in HRECs than in HCECs. (D) HCECs developed more tip cells with low fidelity, but HRECs developed stable tip cells with high angiopoietin-2 (Ang2) expression under the VEGF gradient. (E) HRECs showed high pericyte coverage with PDGFB expression, and HCECs showed fenestrations with diaphragms with high PLVAP expression.

References

    1. Augustin HG, Koh GY.. Organotypic vasculature: from descriptive heterogeneity to functional pathophysiology. Science. 2017; 357: eaal2379. - PubMed
    1. Campbell JP, Zhang M, Hwang TS, et al. .. Detailed vascular anatomy of the human retina by projection-resolved optical coherence tomography angiography. Sci Rep. 2017; 7: 42201. - PMC - PubMed
    1. Anand-Apte B, Hollyfield JG.. Developmental anatomy of the retinal and choroidal vasculature. In: Dartt DA, ed. Encyclopedia of the Eye . Oxford: Academic Press; 2010: 9–15.
    1. Sekiryu T, Sugano Y, Ojima A, et al. .. Hybrid three-dimensional visualization of choroidal vasculature imaged by swept-source optical coherence tomography. Transl Vis Sci Technol. 2019; 8: 31. - PMC - PubMed
    1. Santos GSP, Prazeres PHDM, Mintz A, Birbrair A.. Role of pericytes in the retina. Eye (Lond). 2018; 32: 483–486. - PMC - PubMed

Publication types

Substances