

Zinc Phosphide Poisoning: From A to Z
- PMID: 37505522
- PMCID: PMC10386637
- DOI: 10.3390/toxics11070555
Zinc Phosphide Poisoning: From A to Z
Abstract
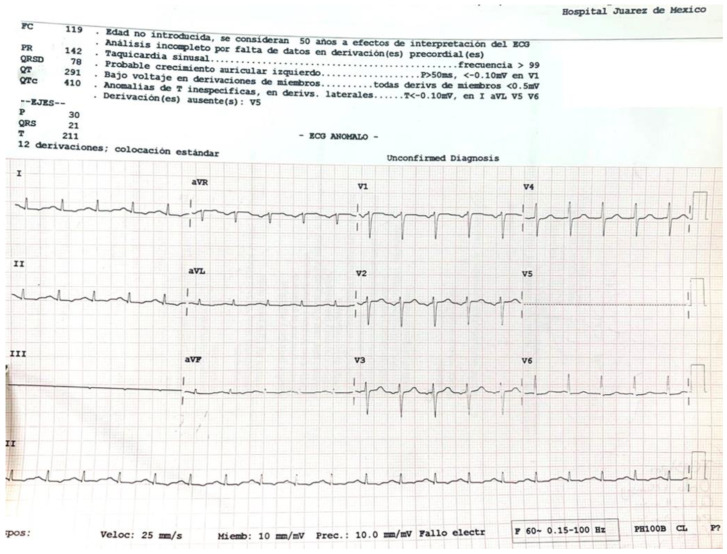
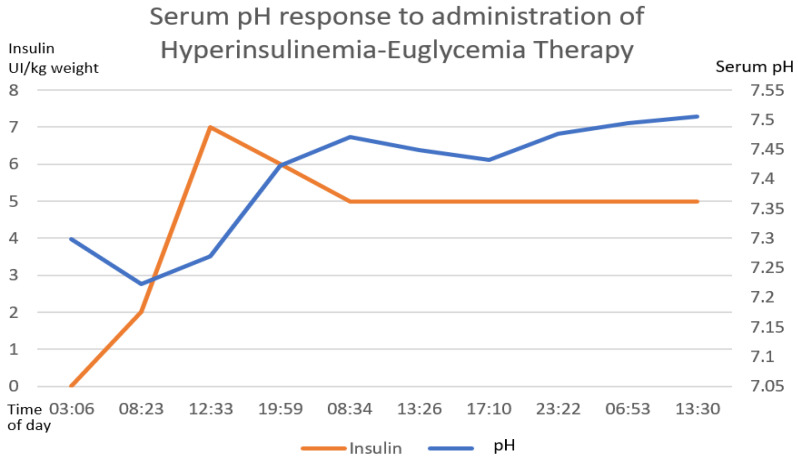
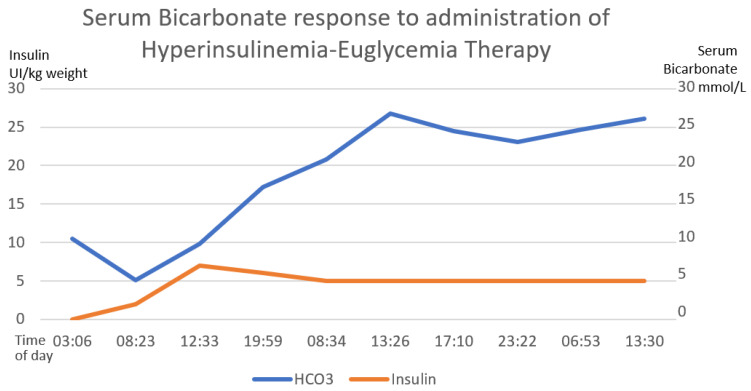
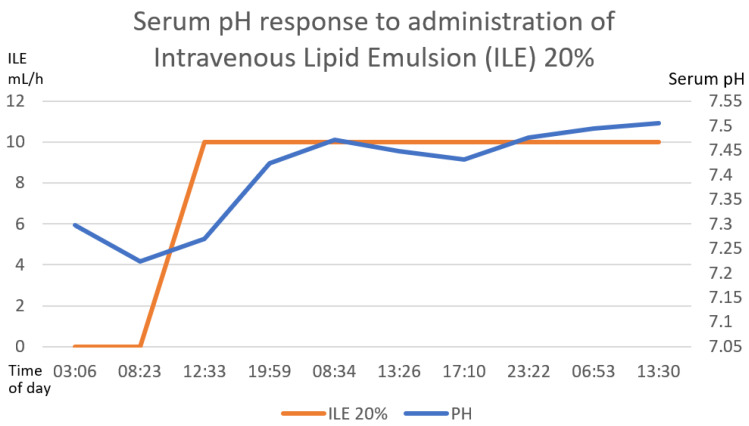
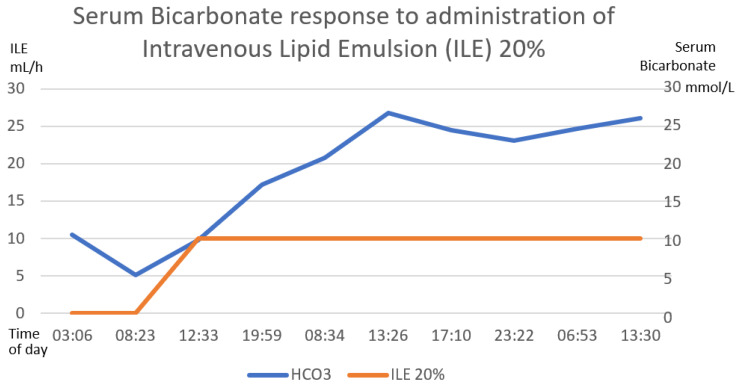
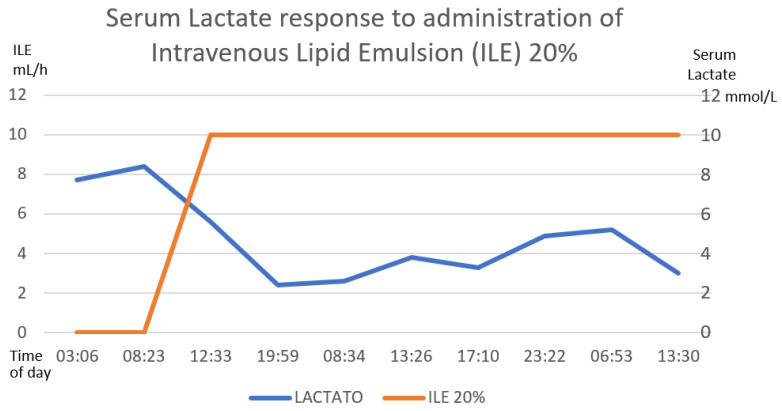
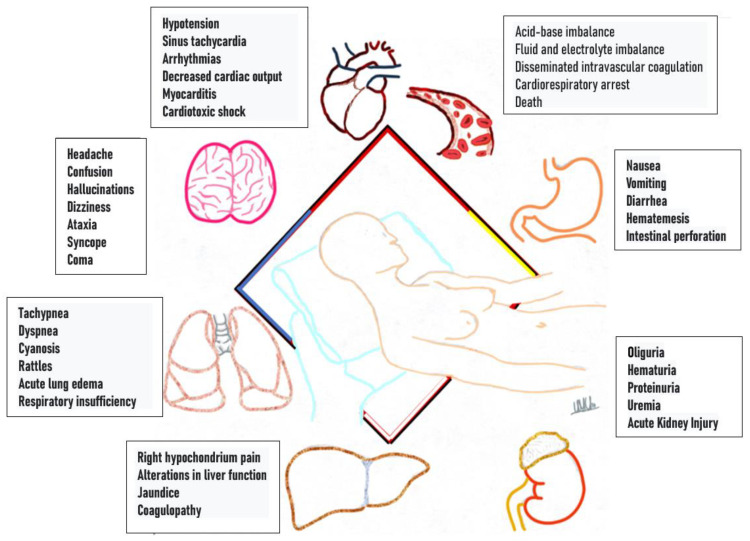
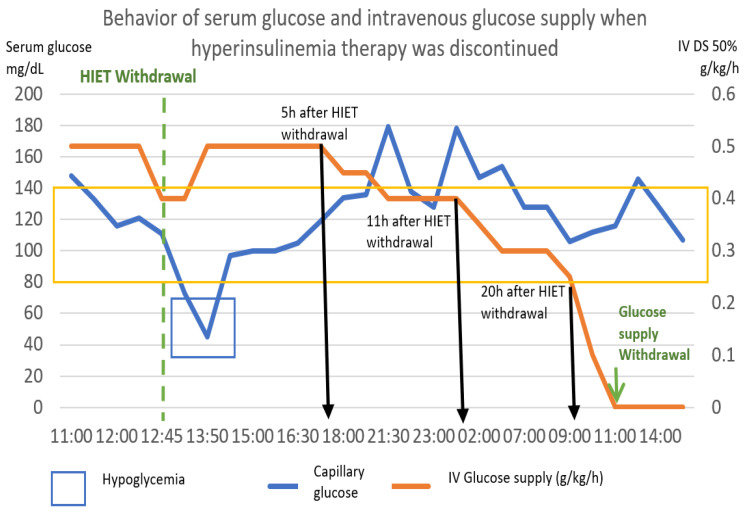
Zinc phosphide is a rodenticide that is used in agricultural, urban and industrial environments in México. After ingestion, it reacts with hydrochloric acid, hydrolyzing into phosphine. It causes cellular hypoxia via mitochondrial toxicity, resulting in multiple organ dysfunction and death. There is no antidote or specific treatment for zinc phosphide toxicity. We present the case of a 45-year-old female who ingested zinc phosphide with suicidal intent. On arrival at the emergency department, she had multisystemic disorders. Supportive care, decontamination and antidotal therapy were initiated. Subsequently, she evolved to clinical improvement with a resolution of the biochemical abnormalities of tissue hypoperfusion. She was discharged on day 7 without complications. In this review, we provide updated therapeutic options and discuss their specific pathophysiological basis.
Keywords: antioxidants; coconut oil; hyperinsulinemia–euglycemia therapy; intravenous lipid emulsion; magnesium sulphate; personal protective equipment; phosphine; zinc phosphide poisoning.
Conflict of interest statement
The authors declare no conflict of interest.
Figures


Similar articles
-
Cookie monster of a pediatric ingestion of zinc phosphide.Am J Emerg Med. 2022 Aug;58:349.e5-349.e7. doi: 10.1016/j.ajem.2022.04.043. Epub 2022 Apr 30. Am J Emerg Med. 2022. PMID: 35527098
-
Successful treatment of acute aluminium phosphide poisoning: possible benefit of coconut oil.Hum Exp Toxicol. 2005 Apr;24(4):215-8. doi: 10.1191/0960327105ht513oa. Hum Exp Toxicol. 2005. PMID: 15957538
-
A case report of zinc phosphide poisoning: complicated by acute renal failure and tubulo interstitial nephritis.BMC Pharmacol Toxicol. 2017 May 25;18(1):37. doi: 10.1186/s40360-017-0144-7. BMC Pharmacol Toxicol. 2017. PMID: 28545504 Free PMC article.
-
Management of Acute Aluminum Phosphide Poisoning: Has Anything Changed?Drug Metab Lett. 2021;14(2):106-116. doi: 10.2174/1872312814666210813115625. Drug Metab Lett. 2021. PMID: 34818996 Review.
-
Aluminium and zinc phosphide poisoning.Clin Toxicol (Phila). 2009 Feb;47(2):89-100. doi: 10.1080/15563650802520675. Clin Toxicol (Phila). 2009. PMID: 19280425 Review.
Cited by
-
In vivo treatment of zinc phosphide poisoning by administration of mesoporous silica nanoparticles as an effective antidote agent.Heliyon. 2024 Apr 16;10(8):e29458. doi: 10.1016/j.heliyon.2024.e29458. eCollection 2024 Apr 30. Heliyon. 2024. PMID: 38681564 Free PMC article.
References
-
- Catálogo Oficial de Plaguicidas 1991. Comisión intersecretarial para el control del proceso y uso de plaguicidas, fertilizantes y sustancias toxicas; Ciudad de Mexico, Mexico: 1991.
-
- Fernando Bejarano González Los Plaguicidas Altamente Peligrosos en México, Primera edición, julio 2017. Red de Acción Sobre Plaguicidas y Alternativas en México, A.C. (RAPAM) [(accessed on 10 April 2023)]. Available online: https://www.rapam.org/wp-content/uploads/2017/09/Libro-Plaguicidas-Final....
-
- Comisión Federal Para la Protección Contra Riesgos Sanitarios (COFEPRIS) Plaguicidas 2015. [(accessed on 29 May 2022)]. Available online: http://www.cofepris.gob.mx/AZ/Paginas/PlaguicidasyFertilizantes/Plaguici....
Publication types
LinkOut - more resources
Full Text Sources
