

Cross-Species Transcriptomics Analysis Highlights Conserved Molecular Responses to Per- and Polyfluoroalkyl Substances
- PMID: 37505532
- PMCID: PMC10385990
- DOI: 10.3390/toxics11070567
Cross-Species Transcriptomics Analysis Highlights Conserved Molecular Responses to Per- and Polyfluoroalkyl Substances
Abstract
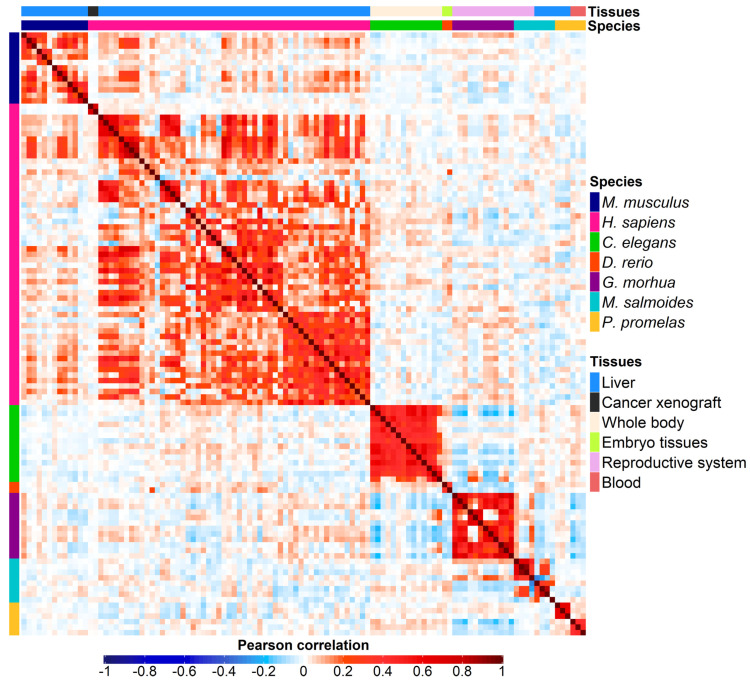
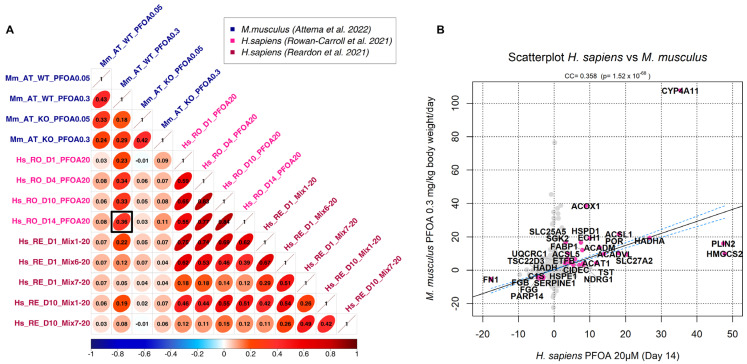
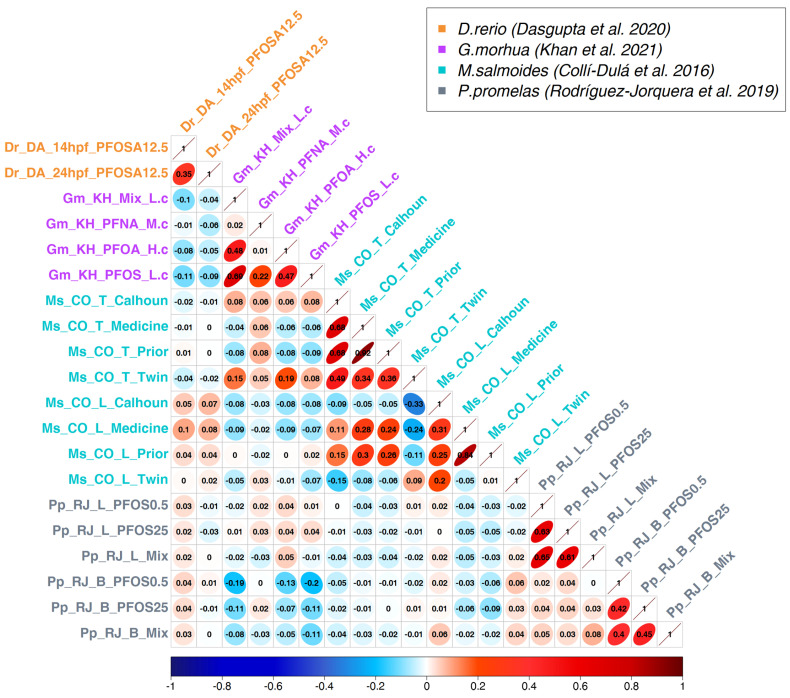
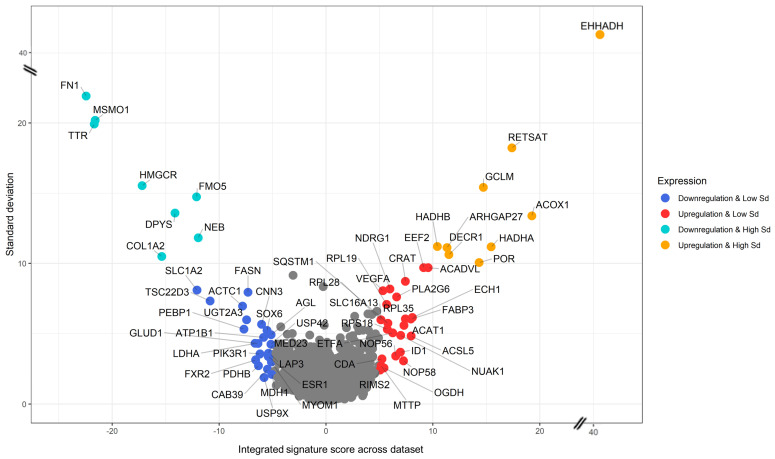
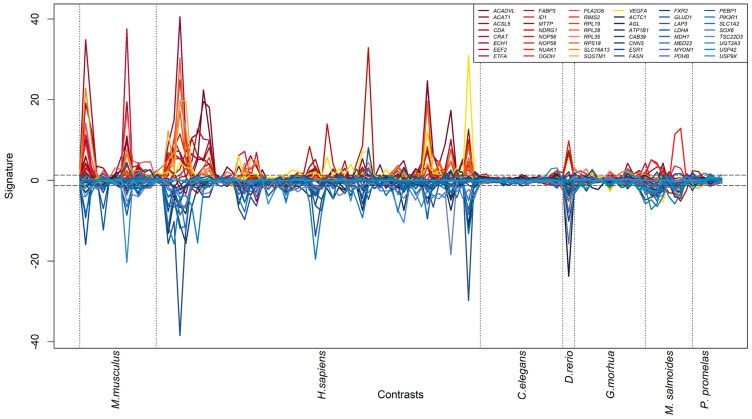
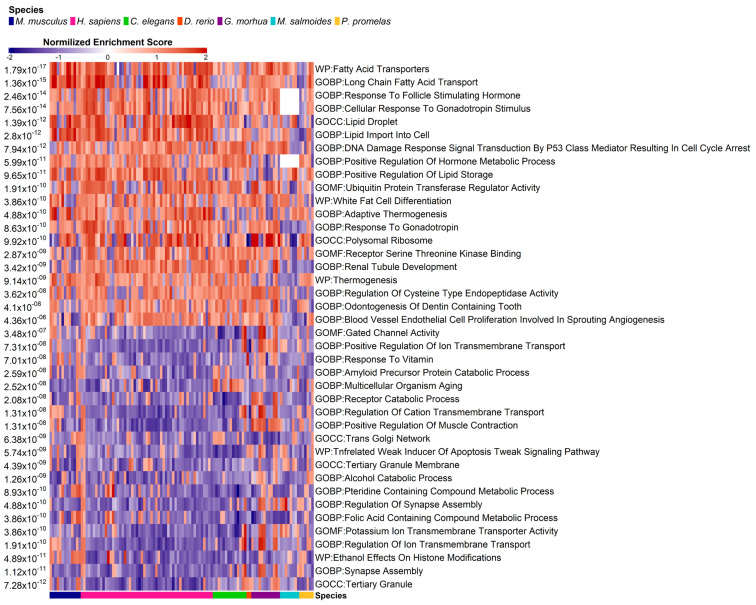
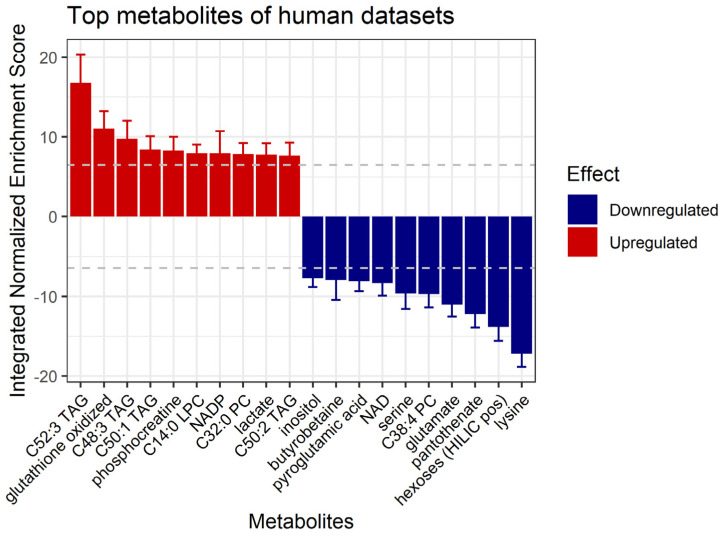
In recent decades, per- and polyfluoroalkyl substances (PFASs) have garnered widespread public attention due to their persistence in the environment and detrimental effects on the health of living organisms, spurring the generation of several transcriptome-centered investigations to understand the biological basis of their mechanism. In this study, we collected 2144 publicly available samples from seven distinct animal species to examine the molecular responses to PFAS exposure and to determine if there are conserved responses. Our comparative transcriptional analysis revealed that exposure to PFAS is conserved across different tissues, molecules and species. We identified and reported several genes exhibiting consistent and evolutionarily conserved transcriptional response to PFASs, such as ESR1, HADHA and ID1, as well as several pathways including lipid metabolism, immune response and hormone pathways. This study provides the first evidence that distinct PFAS molecules induce comparable transcriptional changes and affect the same metabolic processes across inter-species borders. Our findings have significant implications for understanding the impact of PFAS exposure on living organisms and the environment. We believe that this study offers a novel perspective on the molecular responses to PFAS exposure and provides a foundation for future research into developing strategies for mitigating the detrimental effects of these substances in the ecosystem.
Keywords: PFAS; cross-species correlation; metabolism; transcriptome; transcriptomics.
Conflict of interest statement
The authors declare no conflict of interest.
Figures
Similar articles
-
Plant responses to per- and polyfluoroalkyl substances (PFAS): a molecular perspective.Int J Phytoremediation. 2024;26(2):219-227. doi: 10.1080/15226514.2023.2232874. Epub 2023 Jul 18. Int J Phytoremediation. 2024. PMID: 37462666 Review.
-
Sublethal Exposure of Per- and Polyfluoroalkyl Substances of Varying Chain Length and Polar Functionality Results in Distinct Metabolic Responses in Daphnia magna.Environ Toxicol Chem. 2023 Jan;42(1):242-256. doi: 10.1002/etc.5517. Epub 2022 Dec 9. Environ Toxicol Chem. 2023. PMID: 36345965
-
Serum vaccine antibody concentrations in adults exposed to per- and polyfluoroalkyl substances: A birth cohort in the Faroe Islands.J Immunotoxicol. 2021 Dec;18(1):85-92. doi: 10.1080/1547691X.2021.1922957. J Immunotoxicol. 2021. PMID: 34143710 Free PMC article.
-
Exposure to a mixture of legacy, alternative, and replacement per- and polyfluoroalkyl substances (PFAS) results in sex-dependent modulation of cholesterol metabolism and liver injury.Environ Int. 2021 Dec;157:106843. doi: 10.1016/j.envint.2021.106843. Epub 2021 Aug 31. Environ Int. 2021. PMID: 34479135 Free PMC article.
-
Epigenetic changes by per- and polyfluoroalkyl substances (PFAS).Environ Pollut. 2021 Jun 15;279:116929. doi: 10.1016/j.envpol.2021.116929. Epub 2021 Mar 15. Environ Pollut. 2021. PMID: 33751946 Review.
Cited by
-
Closing the Gaps in Understanding PFAS Toxicology and Metabolism.Toxics. 2024 Dec 27;13(1):19. doi: 10.3390/toxics13010019. Toxics. 2024. PMID: 39853019 Free PMC article.
-
Transcriptional and metabolic effects of aspartate-glutamate carrier isoform 1 (AGC1) downregulation in mouse oligodendrocyte precursor cells (OPCs).Cell Mol Biol Lett. 2024 Mar 29;29(1):44. doi: 10.1186/s11658-024-00563-z. Cell Mol Biol Lett. 2024. PMID: 38553684 Free PMC article.
References
-
- Buck R.C., Franklin J., Berger U., Conder J.M., Cousins I.T., De Voogt P., Jensen A.A., Kannan K., Mabury S.A., Van Leeuwen S.P.J. Perfluoroalkyl and polyfluoroalkyl substances in the environment: Terminology, classification, and origins. Integr. Environ. Assess. Manag. 2011;7:513–541. doi: 10.1002/ieam.258. - DOI - PMC - PubMed
-
- OECD . Reconciling Terminology of the Universe of Per and Polyfluoroalkyl Substances: Recommendations and Practical Guidance. OECD; Paris, France: 2021.
-
- PubChem Classification Browser. [(accessed on 3 March 2023)]; Available online: https://pubchem.ncbi.nlm.nih.gov/classification/#hid=120.
Grants and funding
LinkOut - more resources
Full Text Sources
Miscellaneous
