. 2023 Jul 4;11(7):581.
doi: 10.3390/toxics11070581.

Time- and Concentration-Dependent Adverse Effects of Paclitaxel on Non-Neuronal Cells in Rat Primary Dorsal Root Ganglia

Affiliations

Time- and Concentration-Dependent Adverse Effects of Paclitaxel on Non-Neuronal Cells in Rat Primary Dorsal Root Ganglia

Amira Elfarnawany et al. Toxics. .

Abstract

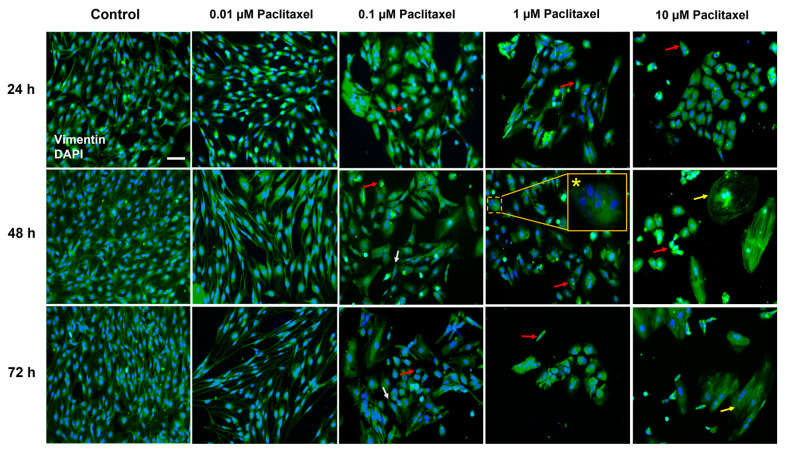
Paclitaxel is a chemotherapeutic agent used to treat a wide range of malignant tumors. Although it has anti-tumoral properties, paclitaxel also shows significant adverse effects on the peripheral nervous system, causing peripheral neuropathy. Paclitaxel has previously been shown to exert direct neurotoxic effects on primary DRG neurons. However, little is known about paclitaxel's effects on non-neuronal DRG cells. They provide mechanical and metabolic support and influence neuronal signaling. In the present study, paclitaxel effects on primary DRG non-neuronal cells were analyzed and their concentration or/and time dependence investigated. DRGs of Wister rats (6-8 weeks old) were isolated, and non-neuronal cell populations were separated by the density gradient centrifugation method. Different concentrations of Paclitaxel (0.01 µM-10 µM) were tested on cell viability by MTT assay, cell death by lactate dehydrogenase (LDH) assay, and propidium iodide (PI) assay, as well as cell proliferation by Bromodeoxyuridine (BrdU) assay at 24 h, 48 h, and 72 h post-treatment. Furthermore, phenotypic effects have been investigated by using immunofluorescence techniques. Paclitaxel exhibited several toxicological effects on non-neuronal cells, including a reduction in cell viability, an increase in cell death, and an inhibition of cell proliferation. These effects were concentration- and time-dependent. Cellular and nuclear changes such as shrinkage, swelling of cell bodies, nuclear condensation, chromatin fragmentation, retraction, and a loss in processes were observed. Paclitaxel showed adverse effects on primary DRG non-neuronal cells, which might have adverse functional consequences on sensory neurons of the DRG, asking for consideration in the management of peripheral neuropathy.

Keywords: BrdU assay; DRG non-neuronal cells; LDH assay; MTT assay; paclitaxel; peripheral neuropathy.


Conflict of interest statement

The authors declare no conflict of interest.

Figures

Figure 1
Figure 1
Morphological features and treatment protocol of primary DRG co-culture. (a) Representative images show the morphology and growth of DRG co-culture at different time points, blue arrows indicate neuronal populations, while red arrows indicate different subpopulations of DRG non-neuronal cells, Scale bar = 50 µm. (b) Treatment protocol for studying the effects of paclitaxel on DRG co-culture viability by using MTT assays at 24 h, 48 h, and 72 h post-treatment.
Figure 2
Figure 2
Various treatment protocols investigate the effects of different paclitaxel concentrations on primary DRG non-neuronal cells after 24 h, 48 h, and 72 h of the application. (a) The MTT assay was used for cell viability determination; (b) the LDH assay for cytotoxicity measurements; (c) the BrdU assay was used to detect cell proliferation; (d) treatment protocol for studying the effects of paclitaxel on cellular morphology through immunofluorescence staining; (e) detection of cell death by using the PI assay.
Figure 3
Figure 3
Effects of different paclitaxel concentrations on viability (%) of DRG co-culture at 24 h, 48 h, and 72 h post-treatment by MTT assay. (a) No significant effect on viability was found in co-cultures compared to controls at 24 h post-treatment (p > 0.05). (b) 48 h, and (c) 72 h post-treatment, paclitaxel displayed a significant reduction in the viability of cells compared to the control (**** p < 0.0001). The asterisks depict statistically significant results regarding the respective measurement indicated with the bar. Values are served as the mean ± SEM of three independent experiments performed in triplicate. ns, non-significant.
Figure 4
Figure 4
Representative phase contrast images show the morphology and growth of primary DRG non-neuronal cells at various time points. Blue arrows indicate Schwann cells, red arrows satellite glial cells, and black arrows represent fibroblasts, Scale bar = 50 µm.
Figure 5
Figure 5
Effects of different concentrations of paclitaxel on the viability (%) of DRG non-neuronal cultures at 24 h, 48 h, and 72 h post-treatment by using MTT assay. (a) 10 µM of paclitaxel was the only concentration that showed a significant effect on the viability of DRG non-neuronal cells compared to control at 24 h post-treatment (* p < 0.05). (b,c), Different concentrations of paclitaxel elucidated a significant reduction in the viability of cells compared to the control at 48 h and 72 h post-treatment (*** p < 0.001, **** p < 0.0001). The asterisk denotes significant results regarding the respective measurement indicated with the bar. Values are served as mean ± SEM of three independent experiments performed in triplicate, ns: non-significant.
Figure 6
Figure 6
Effects of different concentrations of paclitaxel on cytotoxicity of DRG non-neuronal cultures using lactate dehydrogenase (LDH) assay. Levels of released LDH were quantified at (a) 24 h, (b) 48 h, and (c) 72 h post-treatment and showed a significant increase in LDH release that was proportional to the number of dead or damaged cells compared to the control group (**** p < 0.0001). +ve Control represents the maximum release of LDH after 100% cell death. The asterisks denote significant results regarding the respective measurement indicated with the bar. Values are given as the mean ± SEM of three independent experiments conducted in 15 replicates.
Figure 7
Figure 7
Effects of different concentrations of paclitaxel on cell proliferation of DRG non-neuronal cells using BrdU assay. (a) Representative immunofluorescence images of different non-neuronal cells treated with 0.01 µM, 0.1 µM, 1 µM, and 10 µM paclitaxel at 24 h, 48 h, and 72 h post-treatment show proliferating cells labeled with BrdU antibody (green) and all nuclei stained with DAPI (blue). 5–8 areas were recorded randomly per each coverslip; Scale bar = 75 µm. Bar charts demonstrated a significant decrease in the rate of cell proliferation after treatment compared to the control group (**** p < 0.0001) at (b) 24 h, (c) 48 h, and (d) 72 h post-treatment. The asterisks denote significant results regarding the respective measurement indicated with the bar. Values served as the mean ± SEM of three independent experiments performed in 15 replicates.
Figure 8
Figure 8
Effects of various paclitaxel concentrations on cellular morphology at different investigated time points using immunofluorescence staining. Representative microphotographs demonstrate cells stained with vimentin antibody (green) and nuclei counterstained with DAPI (blue). Paclitaxel (0.1 µM, 1 µM, and 10 µM) strongly affected the cell morphology of non-neuronal cells including shrinkage of cells’ bodies (red arrows) and retraction of processes (white arrows). In addition, some cells treated with 10 µM paclitaxel were swelling (yellow arrows). Additionally, nuclear changes were observed, such as nuclear fragmentation (indicated by an asterisk in the inlet) and condensation. Five to eight regions were recorded randomly per coverslip by fluorescence microscopy. Scale bar = 75 µm.
Figure 9
Figure 9
Effects of different concentrations of paclitaxel on nuclear morphology of DRG non-neuronal cells were analyzed by DAPI staining to detect % of apoptosis. (a) Representative images show DAPI-stained nuclei of non-neuronal cells of the control group (left) or 1 µM paclitaxel group (right) at 48 h post-treatment, Scale bar = 75 µm. White arrows indicate healthy and uniformly stained nuclei, whereas red arrows identify apoptotic nuclei. (bd) A significant increase in % of apoptotic cells with fragmented or condensed nuclei was observed in different cultures treated with various paclitaxel concentrations (0.01 µM, 0.1 µM, 1 µM, and 10 µM) in comparison with the control group (** p < 0.01, *** p < 0.001, **** p < 0.0001). Data represented as mean ± SEM. The experiments were performed at least three independent times with n = 15 replicas. The asterisk denotes significant results regarding the respective measurement indicated with the bar graphs.
Figure 10
Figure 10
Effects of different paclitaxel concentrations on cell death of DRG non-neuronal cells by using PI assay. (a) Representative immunofluorescent fields show the amount of damaged non-neuronal cells (PI-positive) in treated groups compared to control fields. The white arrows represent degenerating cells (bright pink nuclei), Scale bar = 75 µm. At 24 h (b), 48 h (c), and 72 h (d) post-treatment, all concentrations of paclitaxel led to a massive increase in the number of dead cells compared to the control group (* p < 0.05, *** p < 0.001, **** p < 0.0001), except for 0.01 µM paclitaxel concentration at 48 h (p > 0.05). Values served as mean ± SEM, and the experiments were carried out three times independently with n = 15 replicas. The asterisk denotes significant results regarding the respective measurement indicated with the bar graphs, ns: non-significant.

Similar articles

Cited by

References

    1. Kim E. Chemotherapy-Induced Peripheral Neuropathy: Bench to Clinical Practice. Korean J. Pain. 2020;33:291–293. doi: 10.3344/kjp.2020.33.4.291. - DOI - PMC - PubMed
    1. Seretny M., Currie G.L., Sena E.S., Ramnarine S., Grant R., MacLeod M.R., Colvin L.A., Fallon M. Incidence, Prevalence, and Predictors of Chemotherapy-Induced Peripheral Neuropathy: A Systematic Review and Meta-Analysis. Pain. 2014;155:2461–2470. doi: 10.1016/j.pain.2014.09.020. - DOI - PubMed
    1. Han Y., Smith M.T. Pathobiology of Cancer Chemotherapy-Induced Peripheral Neuropathy (CIPN) Front. Pharmacol. 2013;4:156. doi: 10.3389/fphar.2013.00156. - DOI - PMC - PubMed
    1. Miltenburg N.C., Boogerd W. Chemotherapy-Induced Neuropathy: A Comprehensive Survey. Cancer Treat. Rev. 2014;40:872–882. doi: 10.1016/j.ctrv.2014.04.004. - DOI - PubMed
    1. Argyriou A., Kyritsis A., Makatsoris T., Kalofonos H. Chemotherapy-Induced Peripheral Neuropathy in Adults: A Comprehensive Update of the Literature. Cancer Manag. Res. 2014;6:135–147. doi: 10.2147/CMAR.S44261. - DOI - PMC - PubMed