

Integrative Chemical-Biological Grouping of Complex High Production Volume Substances from Lower Olefin Manufacturing Streams
- PMID: 37505552
- PMCID: PMC10385386
- DOI: 10.3390/toxics11070586
Integrative Chemical-Biological Grouping of Complex High Production Volume Substances from Lower Olefin Manufacturing Streams
Abstract
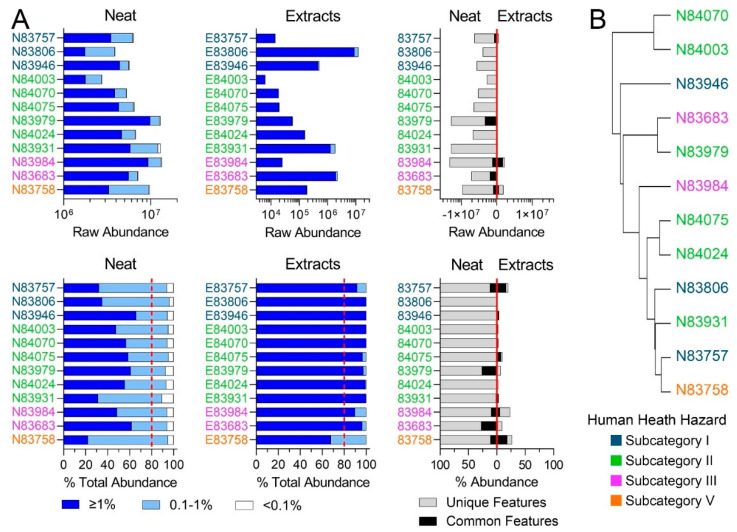
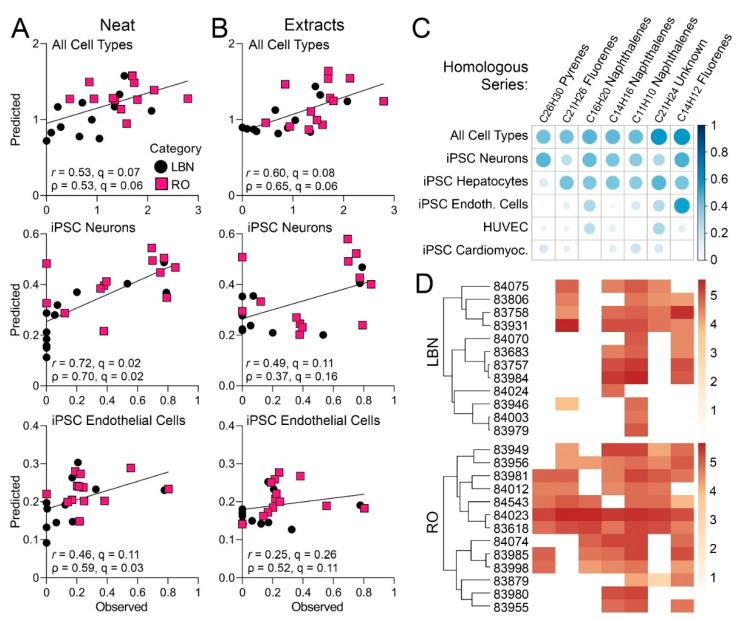
Human cell-based test methods can be used to evaluate potential hazards of mixtures and products of petroleum refining ("unknown or variable composition, complex reaction products, or biological materials" substances, UVCBs). Analyses of bioactivity and detailed chemical characterization of petroleum UVCBs were used separately for grouping these substances; a combination of the approaches has not been undertaken. Therefore, we used a case example of representative high production volume categories of petroleum UVCBs, 25 lower olefin substances from low benzene naphtha and resin oils categories, to determine whether existing manufacturing-based category grouping can be supported. We collected two types of data: nontarget ion mobility spectrometry-mass spectrometry of both neat substances and their organic extracts and in vitro bioactivity of the organic extracts in five human cell types: umbilical vein endothelial cells and induced pluripotent stem cell-derived hepatocytes, endothelial cells, neurons, and cardiomyocytes. We found that while similarity in composition and bioactivity can be observed for some substances, existing categories are largely heterogeneous. Strong relationships between composition and bioactivity were observed, and individual constituents that determine these associations were identified. Overall, this study showed a promising approach that combines chemical composition and bioactivity data to better characterize the variability within manufacturing categories of petroleum UVCBs.
Keywords: UVCB; ion mobility spectrometry; petroleum; read-across; regulatory risk assessment.
Conflict of interest statement
The authors declare no conflict of interest.
Figures


Similar articles
-
Grouping of UVCB substances with new approach methodologies (NAMs) data.ALTEX. 2021;38(1):123-137. doi: 10.14573/altex.2006262. Epub 2020 Oct 9. ALTEX. 2021. PMID: 33086383 Free PMC article.
-
Grouping of UVCB substances with dose-response transcriptomics data from human cell-based assays.ALTEX. 2022;39(3):388–404. doi: 10.14573/altex.2107051. Epub 2022 Mar 10. ALTEX. 2022. PMID: 35288757 Free PMC article.
-
Grouping of Petroleum Substances as Example UVCBs by Ion Mobility-Mass Spectrometry to Enable Chemical Composition-Based Read-Across.Environ Sci Technol. 2017 Jun 20;51(12):7197-7207. doi: 10.1021/acs.est.6b06413. Epub 2017 May 26. Environ Sci Technol. 2017. PMID: 28502166 Free PMC article.
-
The Next Frontier of Environmental Unknowns: Substances of Unknown or Variable Composition, Complex Reaction Products, or Biological Materials (UVCBs).Environ Sci Technol. 2022 Jun 21;56(12):7448-7466. doi: 10.1021/acs.est.2c00321. Epub 2022 May 9. Environ Sci Technol. 2022. PMID: 35533312 Free PMC article. Review.
-
Persistence, bioaccumulation and toxicity-assessment of petroleum UVCBs: A case study on alkylated three-ring PAHs.Chemosphere. 2021 Aug;276:130113. doi: 10.1016/j.chemosphere.2021.130113. Epub 2021 Feb 26. Chemosphere. 2021. PMID: 33690043 Review.
Cited by
-
Hazard and risk characterization of 56 structurally diverse PFAS using a targeted battery of broad coverage assays using six human cell types.Toxicology. 2024 Mar;503:153763. doi: 10.1016/j.tox.2024.153763. Epub 2024 Feb 27. Toxicology. 2024. PMID: 38423244 Free PMC article.
-
Advancing systemic toxicity risk assessment: Evaluation of a NAM-based toolbox approach.Toxicol Sci. 2025 Mar 1;204(1):79-95. doi: 10.1093/toxsci/kfae159. Toxicol Sci. 2025. PMID: 39693112 Free PMC article.
-
Informing Hazard Identification and Risk Characterization of Environmental Chemicals by Combining Transcriptomic and Functional Data from Human-Induced Pluripotent Stem-Cell-Derived Cardiomyocytes.Chem Res Toxicol. 2024 Aug 19;37(8):1428-1444. doi: 10.1021/acs.chemrestox.4c00193. Epub 2024 Jul 24. Chem Res Toxicol. 2024. PMID: 39046974 Free PMC article.
References
-
- Lai A., Clark A.M., Escher B.I., Fernandez M., McEwen L.R., Tian Z., Wang Z., Schymanski E.L. The next frontier of environmental unknowns: Substances of unknown or variable composition, complex reaction products, or biological materials (uvcbs) Environ. Sci. Technol. 2022;56:7448–7466. doi: 10.1021/acs.est.2c00321. - DOI - PMC - PubMed
Grants and funding
LinkOut - more resources
Full Text Sources
