. 2023 Jul 17;11(7):619.
doi: 10.3390/toxics11070619.

Absorption and Distribution of Imidacloprid and Its Metabolites in Goldfish (Carassius auratus Linnaeus)

Affiliations

Absorption and Distribution of Imidacloprid and Its Metabolites in Goldfish (Carassius auratus Linnaeus)

Wanghui Xu et al. Toxics. .

Abstract

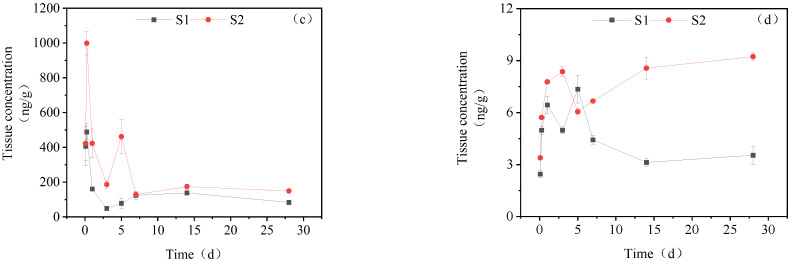
Imidacloprid (IMI) is the first-generation neonicotinoid insecticide. But, the long-term use of IMI as a pesticide has caused severe water pollution. Recently, the toxicity of IMI to aquatic organisms has received increasing attention. This study aimed to investigate the absorption and distribution of IMI in various tissues (gills, intestine, liver, muscle, brain and gonads) of goldfish through short-term and continuous exposure tests over 28 days. The results of short-term exposure indicated that the concentration of IMI and its metabolites in tissues at the transfer stage decreased steadily after 1 day of 40 mg/L IMI water treatment and was below the detection limit after 3 days. Continuous exposure for 28 days at various treatment concentrations showed that the concentrations of IMI and its metabolites differed significantly among the different tissues of the goldfish. In the 20 mg/L treatment group (S1), the highest concentration of IMI was found in the liver (12.04 μg/gtissue), followed by the intestine (9.91 μg/gtissue), muscle (6.20 μg/gtissue), gill (6.11 μg/gtissue), gonads (5.22 μg/gtissue) and brain (2.87 μg/gtissue). In the 40 mg/L treatment group (S2), the order of the tissue concentrations was similar to that of the S1 group, with the highest concentration observed in the liver (12.04 μg/gtissue), followed by the intestine (9.91 μg/gtissue), muscle (6.20 μg/gtissue), gill (6.11 μg/gtissue), gonads (5.22 μg/gtissue) and brain (2.87 μg/gtissue). Furthermore, the study detected 5-hydroxy-IMI, IMI urea and 6-chloronicotinic acid in IMI metabolites in all tissues, while IMI was detected only in the intestine and liver. Overall, the results of this study contribute to a better understanding of the metabolic behavior of IMI in organisms and provide new data to support the assessment of IMI toxicity in fish.

Keywords: goldfish; imidacloprid; metabolites; tissue distribution; toxicity.


Conflict of interest statement

The authors declare no conflict of interest.

Figures

Figure 1
Figure 1
Concentration changes of IMI and its metabolites in goldfish under short-term exposure (treatment concentration: 40 mg/L): (A) IMI; (B) IMI-urea; (C) 6-chloronicotinic acid; (D): 5-hydroxy-IMI.
Figure 2
Figure 2
Concentration changes of IMI in goldfish under continuous exposure (treatment concentration: (S1) 20 mg/L; (S2) 40 mg/L).
Figure 3
Figure 3
Concentration changes in IMI metabolites in gill tissues (treatment concentration: (S1) 20 mg/L; (S2) 40 mg/L): (a) IMI-urea; (b) 6-chloronicotinic acid; (c) 5-hydroxy-IMI.
Figure 4
Figure 4
Concentration changes in IMI metabolites in the intestine (treatment concentration: (S1) 20 mg/L; (S2) 40 mg/L): (a) IMI-urea; (b) 6-chloronicotinic acid; (c) 5-hydroxy-IMI; (d) IMI-olefin.
Figure 4
Figure 4
Concentration changes in IMI metabolites in the intestine (treatment concentration: (S1) 20 mg/L; (S2) 40 mg/L): (a) IMI-urea; (b) 6-chloronicotinic acid; (c) 5-hydroxy-IMI; (d) IMI-olefin.
Figure 5
Figure 5
Concentration changes in IMI metabolites in intestine (treatment concentration: (S1) 20 mg/L; (S2) 40 mg/L): (a) IMI-urea; (b) 6-chloronicotinic acid; (c) 5-hydroxy-IMI; (d) IMI-olefin.
Figure 5
Figure 5
Concentration changes in IMI metabolites in intestine (treatment concentration: (S1) 20 mg/L; (S2) 40 mg/L): (a) IMI-urea; (b) 6-chloronicotinic acid; (c) 5-hydroxy-IMI; (d) IMI-olefin.
Figure 6
Figure 6
Concentration changes in IMI metabolites in muscle (treatment concentration: (S1) 20 mg/L; (S2) 40 mg/L): (a) IMI-urea; (b) 6-chloronicotinic acid; (c) 5-hydroxy-IMI.
Figure 7
Figure 7
Concentration changes in IMI metabolites in brain tissue (treatment concentration: (S1) 20 mg/L; (S2) 40 mg/L): (a) IMI-urea; (b) 6-chloronicotinic acid; (c) 5-hydroxy-IMI.
Figure 8
Figure 8
Concentration changes in IMI metabolites in gonads (treatment concentration: (S1) 20 mg/L; (S2) 40 mg/L): (a) IMI-urea; (b) 6-chloronicotinic acid; (c) 5-hydroxy-IMI.
Figure 9
Figure 9
Metabolic pathways of IMI: (a) housefly: (b) honeybee.
Figure 10
Figure 10
Structure of IMI.
Figure 11
Figure 11
Possible metabolic pathways of IMI in goldfish.

Similar articles

References

    1. Peter J., Ralf N., Michael S., Alfred E. Overview of the Status and Global Strategy for Neonicotinoids. J. Agric. Food Chem. 2011;59:2897–2908. - PubMed
    1. Dave G., David K. Review: An Overview of the Environmental Risks Posed by Neonicotinoid Insecticides. J. Appl. Ecol. 2013;50:977–987.
    1. Casida John E. Neonicotinoids and Other Insect Nicotinic Receptor Competitive Modulators: Progress and Prospects. Annu. Rev. Entomol. 2018;63:125–144. doi: 10.1146/annurev-ento-020117-043042. - DOI - PubMed
    1. Hladik Michelle L., Main Anson R., Goulson D. Environmental Risks and Challenges Associated with Neonicotinoid Insecticides. Environ. Sci. Technol. 2018;52:3329–3335. doi: 10.1021/acs.est.7b06388. - DOI - PubMed
    1. Anderson J.C., Dubetz C., Palace V.P. Neonicotinoids in the Canadian Aquatic Environment: A Literature Review on Current Use Products with a Focus on Fate, Exposure, and Biological Effects. Sci. Total Environ. 2015;505:409–422. doi: 10.1016/j.scitotenv.2014.09.090. - DOI - PubMed

LinkOut - more resources