. 2023 Jul 3;15(7):438.
doi: 10.3390/toxins15070438.

Sodium Propionate Relieves LPS-Induced Inflammation by Suppressing the NF-ĸB and MAPK Signaling Pathways in Rumen Epithelial Cells of Holstein Cows

Affiliations

Sodium Propionate Relieves LPS-Induced Inflammation by Suppressing the NF-ĸB and MAPK Signaling Pathways in Rumen Epithelial Cells of Holstein Cows

Chenxu Zhao et al. Toxins (Basel). .

Abstract

Subacute ruminal acidosis (SARA) is a prevalent disease in intensive dairy farming, and the rumen environment of diseased cows acidifies, leading to the rupture of gram-negative bacteria to release lipopolysaccharide (LPS). LPS can cause rumentitis and other complications, such as liver abscess, mastitis and laminitis. Propionate, commonly used in the dairy industry as a feed additive, has anti-inflammatory effects, but its mechanism is unclear. This study aims to investigate whether sodium propionate (SP) reduces LPS-induced inflammation in rumen epithelial cells (RECs) and the underlying mechanism. RECs were stimulated with different time (0, 1, 3, 6, 9, 18 h) and different concentrations of LPS (0, 1, 5, 10 μg/mL) to establish an inflammation model. Then, RECs were treated with SP (15, 25, 35 mM) or 10 μM PDTC in advance and stimulated by LPS for the assessment. The results showed that LPS (6h and 10 μg/mL) could stimulate the phosphorylation of NF-κB p65, IκB, JNK, ERK and p38 MAPK through TLR4, and increase the release of TNF-α, IL-1β and IL-6. SP (35 mM) can reduce the expression of cytokines by effectively inhibiting the NF-κB and MAPK inflammatory pathways. This study confirmed that SP inhibited LPS-induced inflammatory responses through NF-κB and MAPK in RECs, providing potential therapeutic targets and drugs for the prevention and treatment of SARA.

Keywords: inflammation; lipopolysaccharide; rumen epithelial cells; sodium propionate; subacute ruminal acidosis.


Conflict of interest statement

The authors declare no conflict of interest.

Figures

Figure 1
Figure 1
Culture, identification and viability test of RECs. (A) RECs in the culture at different times; (B) ACTB and CK18 protein expression in RECs; (C) the cellular viability following exposure to distinct concentrations of LPS (1, 5, 10 μg/mL), SP (15, 25, 35 mM) and PDTC (10 μM).
Figure 2
Figure 2
The changes in the expression of key proteins of NF-κB and MAPK signaling pathway after LPS stimulation in RECs at different times. (A) The WB results of TLR4, Myd88, P-NF-κB p65, NF-κB p65, P-IκBα, IκBα, P-JNK, JNK, P-ERK, ERK, P-p38 MAPK, p38 MAPK and β-actin; (BH) The gray analysis of TLR4, Myd88, P-NF-κB p65, P-IκBα, JNK, ERK and p38 MAPK. * p < 0.05, ** p < 0.01, * was compared to 0 h group. N = 5 in each group.
Figure 3
Figure 3
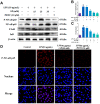
The changes in the expression of key proteins of NF-κB signaling pathway after LPS stimulation at different concentrations and P-NF-κB p65 cellular localization. (A) Effects of 0, 1, 5 and 10 μg/mL LPS on TLR4, Myd88, P-NF-κB p65, P-IκBα, NF-κB p65, IκBα protein expression of RECs; (BE) the gray analysis of TLR4, Myd88, P-NF-κB p65, P-IκBα; (F) effect of 6 h and 10 μg/mL LPS on P-NF-κB p65 cellular localization in RECs. The red light represents P-NF-κB p65, and the blue light represents the nucleus. ** p < 0.01, * was compared to 0 μg/mL group. N = 5 in each group.
Figure 4
Figure 4
The changes in the expression of key proteins of MAPK signaling pathway after LPS stimulation at different concentrations. (A) Effects of 0, 1, 5, 10 μg/mL LPS on P-JNK, P-ERK, P-p38 MAPK, JNK, ERK, p38 MAPK and β-actin protein expression in RECs; (BD) phosphorylation levels of JNK, ERK and p38 MAPK. ** p < 0.01, ** was compared to 0 μg/mL group. N = 5 in each group.
Figure 5
Figure 5
Effects of varying concentrations of LPS on the release of cytokines and mRNA expression. (AC) Effects of 0, 1, 5, 10 μg/mL LPS on TNF-α, IL-1β and IL-6 content in RECs supernatant; (DF) mRNA expression of TNF-α, IL-1β and IL-6 in RECs. * p < 0.05, ** p < 0.01, * was compared with control group. N = 5 in each group.
Figure 6
Figure 6
Effects of concentrations varying of SP on LPS-induced NF-κB signaling pathway in RECs and P-NF-κB p65 cellular localization. (A) WB protein bands of P-NF-κB p65, P-IκBα, NF-κB p65, IκBα in RECs treated with 10 μg/mL LPS and 15, 25, 35 mM SP and 10 μM PDTC; (B,C) phosphorylation intensities of NF-κB p65 and IκBα; (D) effect of 10 μg/mL LPS, 35 mM SP and 10 μM PDTC on P-NF-κB p65 cellular localization in RECs. The red light represents P-NF-κB p65, and the blue light represents the nucleus. ## p < 0.01, ** p < 0.01, # was LPS group vs. control group, * was SP (15, 25, 35 mM) group or PDTC group vs. LPS group. N = 5 in each group.
Figure 7
Figure 7
Effects of different concentrations of SP on LPS-induced MAPK signaling pathway proteins. (A) WB protein bands of P-JNK, P-ERK, P-p38 MAPK, ERK, JNK, p38MAPK and β-actin in RECs treated with 10 μg/mL LPS and 15, 25, 35 mM SP; (BD) the phosphorylation intensities of JNK, ERK and p38MAPK. ## p < 0.01, ** p < 0.01, # was LPS group vs. control group, * was SP (15, 25, 35 mM) group vs. LPS group. N = 5 in each group.
Figure 8
Figure 8
Effects of SP on LPS-induced cytokine release and mRNA expression. (AC) Effects of 10 μg/mL LPS and 35 mM SP on TNF-α, IL-1β and IL-6 content in RECs supernatant; (DF) mRNA expression of TNF-α, IL-1β, and IL-6 in RECs. * p < 0.05, ** p < 0.01. N = 5 in each group.

References

    1. Abaker J.A., Xu T.L., Jin D., Chang G.J., Zhang K., Shen X.Z. Lipopolysaccharide derived from the digestive tract provokes oxidative stress in the liver of dairy cows fed a high-grain diet. J. Dairy Sci. 2017;100:666–678. doi: 10.3168/jds.2016-10871. - DOI - PubMed
    1. Chen X., Su X., Li J., Yang Y., Wang P., Yan F., Yao J., Wu S. Real-time monitoring of ruminal microbiota reveals their roles in dairy goats during subacute ruminal acidosis. NPJ Biofilms Microbi. 2021;7:45. doi: 10.1038/s41522-021-00215-6. - DOI - PMC - PubMed
    1. Castillo-Lopez E., Rivera-Chacon R., Ricci S., Petri R.M., Reisinger N., Zebeli Q. Short-term screening of multiple phytogenic compounds for their potential to modulate chewing behavior, ruminal fermentation profile, and pH in cattle fed grain-rich diets. J. Dairy Sci. 2021;104:4271–4289. doi: 10.3168/jds.2020-19521. - DOI - PubMed
    1. Enemark J.M. The monitoring, prevention and treatment of sub-acute ruminal acidosis (SARA): A review. Vet. J. 2008;176:32–43. doi: 10.1016/j.tvjl.2007.12.021. - DOI - PubMed
    1. Plaizier J.C., Mulligan F.J., Neville E.W., Guan L.L., Steele M.A., Penner G.B. Invited review: Effect of subacute ruminal acidosis on gut health of dairy cows. J. Dairy Sci. 2022;105:7141–7160. doi: 10.3168/jds.2022-21960. - DOI - PubMed

Publication types