. 2023 Nov;33(6):e13189.
doi: 10.1111/bpa.13189. Epub 2023 Jul 28.

Inorganic phosphate exporter heterozygosity in mice leads to brain vascular calcification, microangiopathy, and microgliosis

Affiliations

Inorganic phosphate exporter heterozygosity in mice leads to brain vascular calcification, microangiopathy, and microgliosis

Upasana Maheshwari et al. Brain Pathol. 2023 Nov.

Abstract

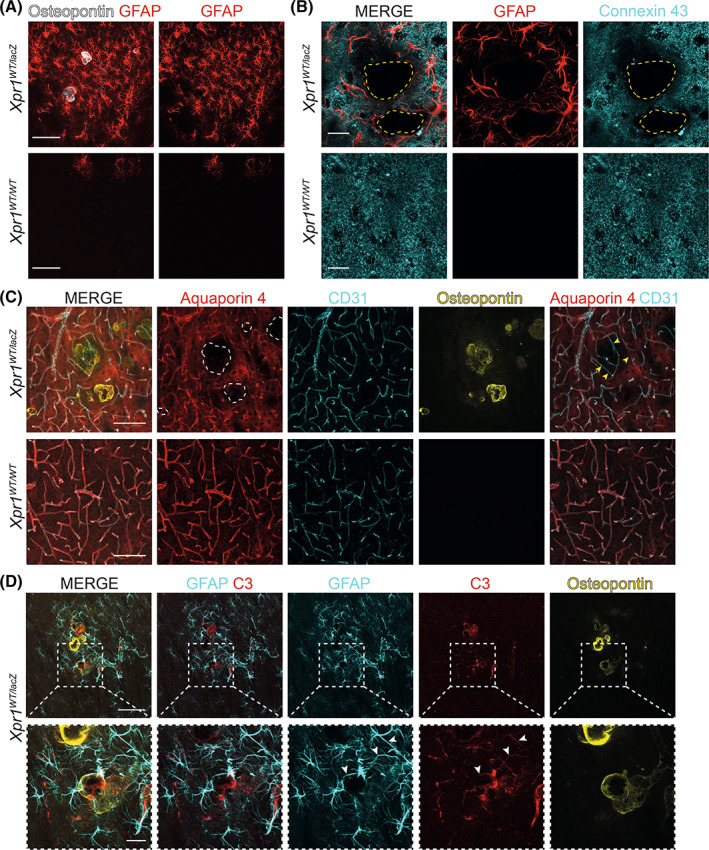
Calcification of the cerebral microvessels in the basal ganglia in the absence of systemic calcium and phosphate imbalance is a hallmark of primary familial brain calcification (PFBC), a rare neurodegenerative disorder. Mutation in genes encoding for sodium-dependent phosphate transporter 2 (SLC20A2), xenotropic and polytropic retrovirus receptor 1 (XPR1), platelet-derived growth factor B (PDGFB), platelet-derived growth factor receptor beta (PDGFRB), myogenesis regulating glycosidase (MYORG), and junctional adhesion molecule 2 (JAM2) are known to cause PFBC. Loss-of-function mutations in XPR1, the only known inorganic phosphate exporter in metazoans, causing dominantly inherited PFBC was first reported in 2015 but until now no studies in the brain have addressed whether loss of one functional allele leads to pathological alterations in mice, a commonly used organism to model human diseases. Here we show that mice heterozygous for Xpr1 (Xpr1WT/lacZ ) present with reduced inorganic phosphate levels in the cerebrospinal fluid and age- and sex-dependent growth of vascular calcifications in the thalamus. Vascular calcifications are surrounded by vascular basement membrane and are located at arterioles in the smooth muscle layer. Similar to previously characterized PFBC mouse models, vascular calcifications in Xpr1WT/lacZ mice contain bone matrix proteins and are surrounded by reactive astrocytes and microglia. However, microglial activation is not confined to calcified vessels but shows a widespread presence. In addition to vascular calcifications, we observed vessel tortuosity and transmission electron microscopy analysis revealed microangiopathy-endothelial swelling, phenotypic alterations in vascular smooth muscle cells, and thickening of the basement membrane.

Keywords: acoustic startle response; dark microglia; inflammation; retina; scanning electron microscopy; sexual dimorphism.


Conflict of interest statement

The authors declare that they have no competing interests.

Figures

FIGURE 1
FIGURE 1
Characterization of ectopic brain vascular calcifications in Xpr1 WT/lacZ mice. (A) Histological staining of brain sections of 16‐month‐old Xpr1 WT/lacZ mice showing nodules positive for staining with hematoxylin and eosin (HE), periodic acid‐Schiff (PAS), alcian blue (AB), von Kossa (VK), and alizarin red (AR) which are absent in controls. Black arrows indicate the nodules shown in the inset at higher magnification. Scale bars: 200 μm, 25 μm inset. n = 3 mice. (B) Quantification of Pi levels in the CSF of Xpr1 WT/WT and Xpr1 WT/lacZ mice (P = 0.0010). n = 4–5 mice. Data are presented as mean ± SD (C) Immunofluorescence analysis of calcifications in 7‐ to 16‐month‐old female and male Xpr1 WT/lacZ mice. Osteopontin‐positive calcifications (red) are associated with vessels (white). Images are acquired at midbrain region. Scale bar: 100 μm. n = 4–5 mice per stage. (D) Osteopontin‐positive calcifications (red) are associated with arterioles (ASMA positive, cyan) in the thalamus of 16‐month‐old Xpr1 WT/lacZ mice. A white dotted line drawn with reference to ASMA staining shows localization of calcification around ASMA positive vessel. White arrowheads point to the coverage of BM (Collagen IV, yellow) around calcifications. Scale bar: 100 μm. n = 3–5 mice. (E) TEM image in 16‐month‐old Xpr1 WT/lacZ male mice showing arteriole‐associated calcification in the thalamus, which appears as layered nodule with electron‐dense and rugged edges. Near calcification signs of tissue rarefaction (blue arrows) and a myelin balloon (black asterisk) were seen. The calcified arteriole presents with thickened BM (pink arrowhead). Dark microglia (MG) (white arrow) was observed adjacent to the calcification. The orange and yellow dotted box surrounds magnified regions, showing BM coverage (red arrows) around the calcification. Endothelial cell (black arrow) with intact cell–cell junction (black arrowhead) is separated from calcification by the BM (red arrow). Adjacent to the calcification, VSMC (red asterisk) is also seen. Note the absence of BM between VSMC and calcification. The pink dotted box surrounds the magnified region showing another nodule, with electron‐dense and rugged edges, adjacent to a cell (pink asterisk). Note the absence of BM between the cell and the nodule. VL, vessel lumen. Scale bars: 10 μm, 5 μm inset. (F) Selected SEM images from the array show layered calcification and continuous BM (red arrows) around the calcification. VSMC (red asterisk) is observed adjacent to the calcification and contains electron‐dense accumulations (red arrowhead). Scale bar: 5 μm. *P < 0.05.
FIGURE 2
FIGURE 2
Sexually dimorphic development of brain calcification in Xpr1 WT/lacZ mice. (A) A brain section from SW imaging and corresponding phase image showing calcification as hypointensities (red dotted box) in the thalamus of 16‐month‐old male and female Xpr1 WT/lacZ mice and diamagnetic nature, calcification, of the hypointensities observed in SW imaging, respectively. Insets show magnified view of the boxed region in the corresponding image. Scale bar: 1000 μm. (B) Quantification of calcification load in Xpr1 WT/lacZ female and male mice from SW images. P = 0.0179, *P < 0.05. Each data point represents the sum of area of calcification from one hemisphere. n = three Xpr1 WT/lacZ female and four Xpr1 WT/lacZ male. Data are presented as mean ± SD. (C) Osteopontin labeled calcifications (white) in cleared hemispherized brain of a 16‐month‐old Xpr1 WT/lacZ female and male mouse. Inset shows higher magnification of the calcified region in the thalamus. A white dotted line marks the outline of the brain. The overview images are compiled of selected sequential optical slices. Higher magnification (inset) is a maximum‐intensity view of the calcified region. Punctiform signal visible in the cortex of male mice is due to non‐specific secondary antibody aggregates. HC, hippocampus. Scale bars: 1000 μm overview and 500 μm inset. n = 3–4 mice.
FIGURE 3
FIGURE 3
Microangiopathy in Xpr1 WT/lacZ mice. (A–C) TEM images of the thalamus of 16‐month‐old Xpr1 WT/lacZ male mice showing vascular alterations. (A) Vessels with convoluted lumen associated with altered VSMC (red arrows). Red dotted box surrounds the thickened VSMC in magnified view. Scale bars: 10 μm, 5 μm magnified view. (B) Vessels with narrowed lumen. Red asterisk labels swollen endothelial cell. Scale bar: 10 μm. (C) Image of a vessel associated with degenerating VSMC (red arrow) and thickened BM (red arrowhead). Scale bar: 5 μm. (D) Immunohistochemical staining of deep brain region showing increased vascular ICAM‐1 staining (white) in Xpr1 WT/lacZ mice. Scale bar: 100 μm. (E) Tortuous arterioles (ASMA, cyan) in the cortex of 16‐month‐old Xpr1 WT/lacZ mice. Scale bar: 100 μm. For IHC n = 3 mice.
FIGURE 4
FIGURE 4
Reactive astrocytes in Xpr1 WT/lacZ mice surround vascular calcifications. (A) Strongly GFAP‐positive astrocytes (red) in the deep brain region of 16‐month‐old Xpr1 WT/lacZ mice. GFAP‐positive astrocytes were surrounding calcifications (white) and were also widespread in the deep brain region. Scale bar: 100 μm. (B) Reduced connexin 43 expression (cyan) observed in regions surrounding calcifications (yellow dotted line) in Xpr1 WT/lacZ mice. Scale bar: 25 μm. (C) Mislocalized aquaporin 4 (red) from astrocyte endfeet in near vicinity to calcified vessels (yellow, marked with white dotted line). Blood vessels are visualized with antibody detecting CD31 (cyan). Some vessel segments lacked aquaporin 4 coverage (yellow arrowheads). Scale bar: 100 μm. (D) GFAP‐positive astrocytes (cyan) express C3 (red) around osteopontin‐positive calcifications (yellow). Higher magnification image shows colocalization of GFAP and C3 expression (white arrowheads). Scale bars: 100 μm, 25 μm higher magnification. For IHC n = 3 mice.
FIGURE 5
FIGURE 5
Activated microglia in the brain of Xpr1 WT/lacZ mice. (A) Immunofluorescent staining showing expression of CLEC7A (red) in IBA1‐positive microglia (cyan) surrounding osteopontin‐positive calcifications (yellow). A few microglia surrounding calcifications were strongly positive for CLEC7A and IBA1 (pink arrows). Scale bar: 100 μm. For IHC n = 3 mice. (B,C) TEM images showing (B) dark microglia and (C) microglia containing fibrillar inclusion (surrounded by red dotted line) in Xpr1 WT/lacZ mice. Note the presence of swollen astrocyte end‐feet (red asterisk) adjacent to dark microglia (B) and swollen mitochondria (red arrowhead) in microglia with fibrillar inclusion (C). VL, vessel lumen. Scale bar: 5 μm.
FIGURE 6
FIGURE 6
Behavioral analysis of Xpr1 WT/lacZ mice. (A) Analysis from pre‐pulse inhibition test, where the mean PPI is expressed as percentage and calculated from the reflex outcomes of a combination of three different prepulses and three different pulses (P = 0.0021). (B) Percentage pre‐pulse inhibition exhibited by mice when subjected to different pulses (100, 110, and 120 dB), each pulse is presented as a mean of combination with three different prepulses (pp71, pp77, and pp83) (pA P = 0.0040; pB P = 0.0022; pC P = 0.1804). (C) The acoustic startle reflex of mice measured in arbitary units (AU) plotted against three different pulses—100, 110, and 120 dB (pA P = 0.0007; pB P = 0.0051; pC P = 0.1445). (D) Startle reflex of mice to three different prepulses (pp71, pp77, and pp83) measured in arbitrary units (AU) plotted against each prepulse (pp71 P = 0.9938; pp77 P = 0.7599; pp83 P = <0.0001). n = 9 Xpr1 WT/WT and n = 10 Xpr1 WT/lacZ mice. Data are presented as mean ± SD. *P < 0.05. ns, not significant.

References

    1. Tailor CS, Nouri A, Lee CG, Kozak C, Kabat D. Cloning and characterization of a cell surface receptor for xenotropic and polytropic murine leukemia viruses. Proc Natl Acad Sci U S A. 1999;96(3):927–932. 10.1073/pnas.96.3.927 - DOI - PMC - PubMed
    1. Yang Q, Li J, Jiao B, Weng L. Primary familial brain calcification in a patient with a novel compound heterozygous mutation in MYORG presenting with an acute ischemic stroke: a case report. Ann Transl Med. 2022;10(7):423. 10.21037/atm-21-4883 - DOI - PMC - PubMed
    1. Giovannini D, Touhami J, Charnet P, Sitbon M, Battini JL. Inorganic phosphate export by the retrovirus receptor XPR1 in metazoans. Cell Rep. 2013;3(6):1866–1873. 10.1016/j.celrep.2013.05.035 - DOI - PubMed
    1. Wild R, Gerasimaite R, Jung JY, Truffault V, Pavlovic I, Schmidt A, et al. Control of eukaryotic phosphate homeostasis by inositol polyphosphate sensor domains. Science. 2016;352(6288):986–990. 10.1126/science.aad9858 - DOI - PubMed
    1. Li X, Gu C, Hostachy S, Wittwer C, Jessen HJ, Fiedler H, et al. Control of XPR1‐dependent cellular phosphate efflux by InsP(8) is an exemplar for functionally‐exclusive inositol pyrophosphate signaling. Proc Natl Acad Sci U S A. 2020;117(7):3568–3574. 10.1073/pnas.1908830117 - DOI - PMC - PubMed

Publication types

MeSH terms

Substances