. 2023 Jul 28;8(85):eadd1591.
doi: 10.1126/sciimmunol.add1591. Epub 2023 Jul 28.

Clonally expanded CD38hi cytotoxic CD8 T cells define the T cell infiltrate in checkpoint inhibitor-associated arthritis

Affiliations

Clonally expanded CD38hi cytotoxic CD8 T cells define the T cell infiltrate in checkpoint inhibitor-associated arthritis

Runci Wang et al. Sci Immunol. .

Abstract

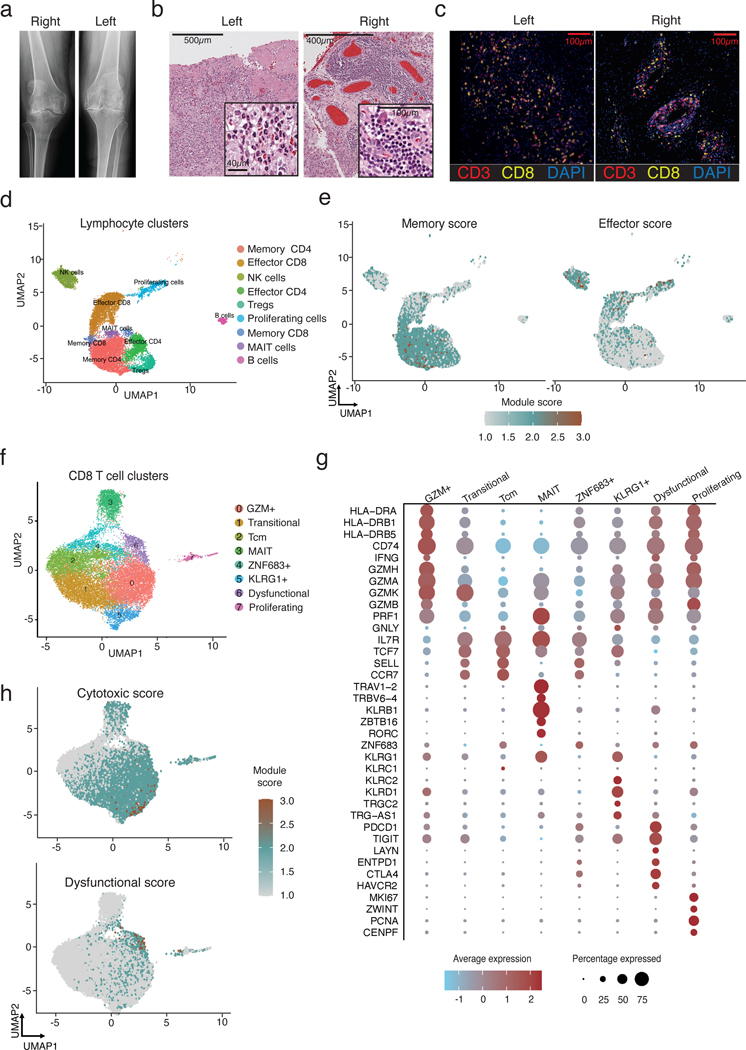
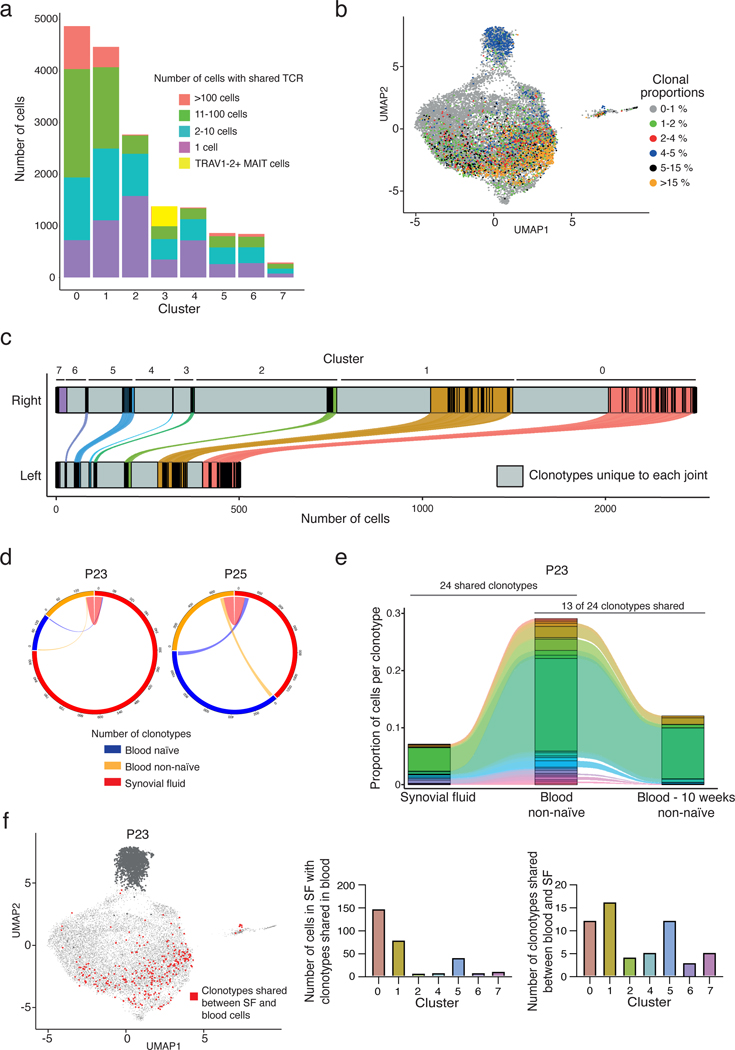
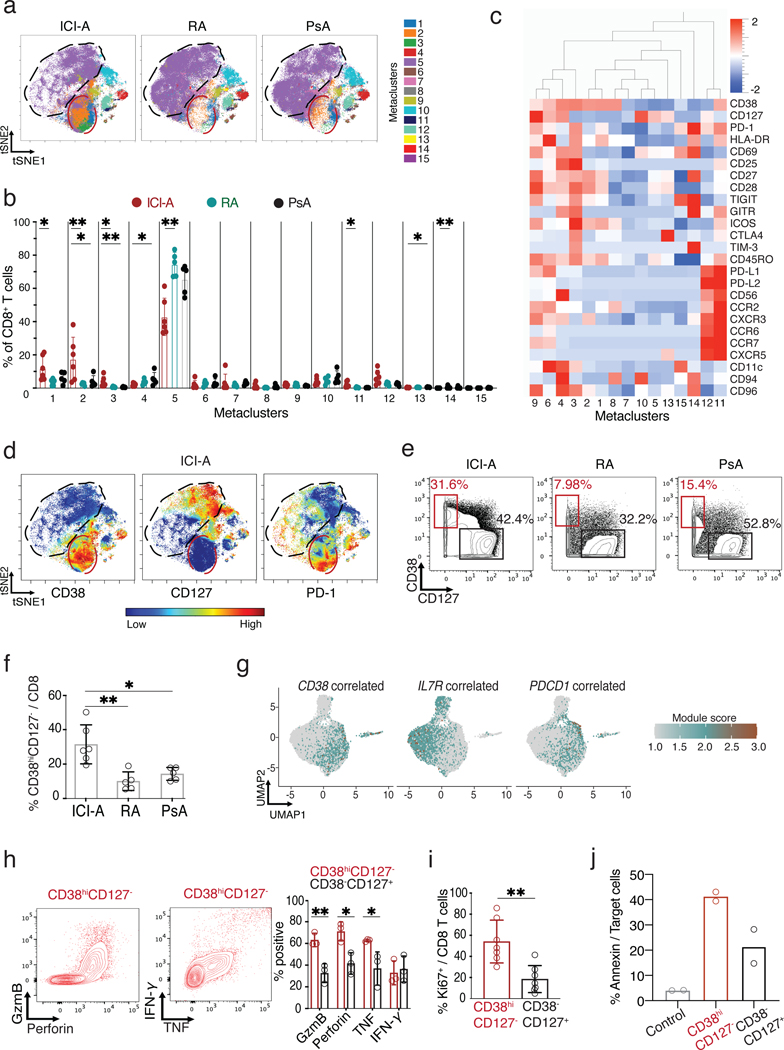
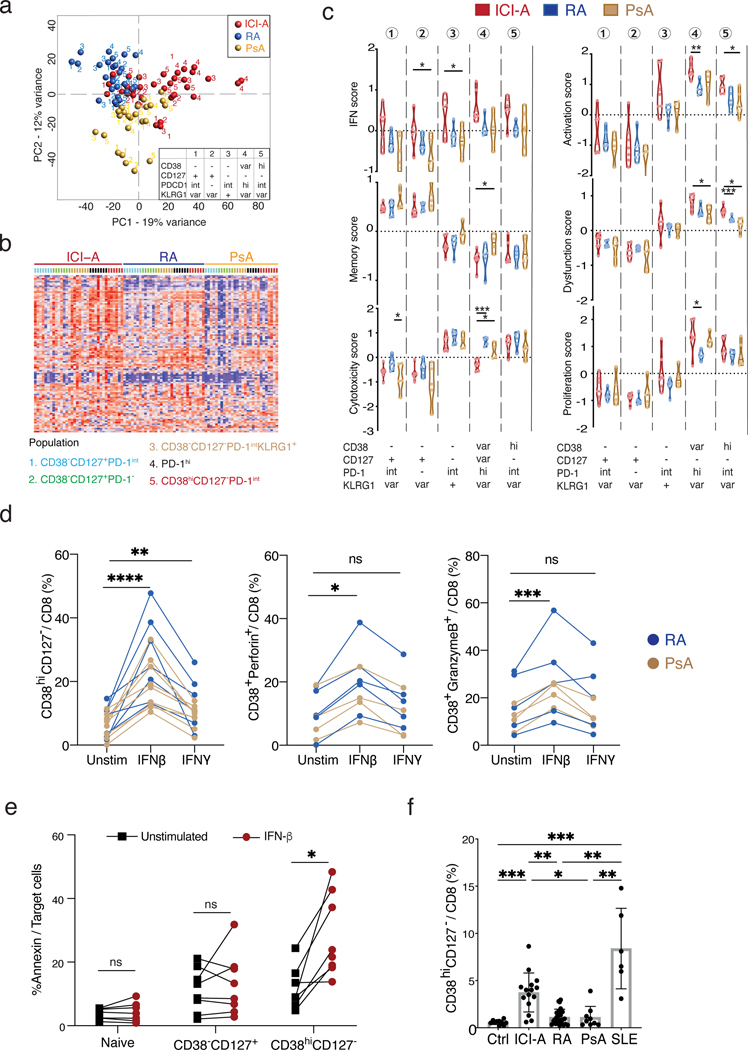
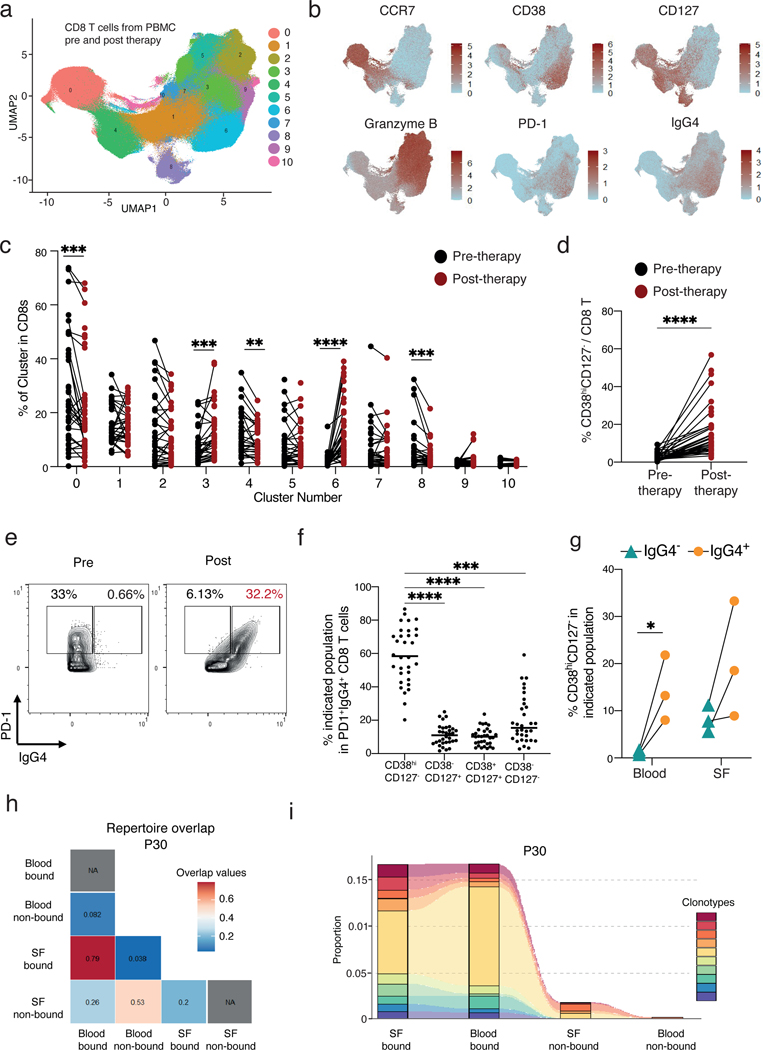
Immune checkpoint inhibitor (ICI) therapies used to treat cancer, such as anti-PD-1 antibodies, can induce autoimmune conditions in some individuals. The T cell mechanisms mediating such iatrogenic autoimmunity and their overlap with spontaneous autoimmune diseases remain unclear. Here, we compared T cells from the joints of 20 patients with an inflammatory arthritis induced by ICI therapy (ICI-arthritis) with two archetypal autoimmune arthritides, rheumatoid arthritis (RA) and psoriatic arthritis (PsA). Single-cell transcriptomic and antigen receptor repertoire analyses highlighted clonal expansion of an activated effector CD8 T cell population in the joints and blood of patients with ICI-arthritis. These cells were identified as CD38hiCD127- CD8 T cells and were uniquely enriched in ICI-arthritis joints compared with RA and PsA and also displayed an elevated interferon signature. In vitro, type I interferon induced CD8 T cells to acquire the ICI-associated CD38hi phenotype and enhanced cytotoxic function. In a cohort of patients with advanced melanoma, ICI therapy markedly expanded circulating CD38hiCD127- T cells, which were frequently bound by the therapeutic anti-PD-1 drug. In patients with ICI-arthritis, drug-bound CD8 T cells in circulation showed marked clonal overlap with drug-bound CD8 T cells from synovial fluid. These results suggest that ICI therapy directly targets CD8 T cells in patients who develop ICI-arthritis and induces an autoimmune pathology that is distinct from prototypical spontaneous autoimmune arthritides.


Conflict of interest statement

D.A. Rao reports personal fees from Pfizer, Janssen, Merck, GlaxoSmithKline, and Bristol-Myers Squibb and grant support from Janssen and Bristol-Myers Squibb, outside the submitted work. J. A. Sparks is funded by NIH/NIAMS (grant numbers R01 AR080659, R01 AR077607, P30 AR070253, and P30 AR072577), the R. Bruce and Joan M. Mickey Research Scholar Fund, and the Llura Gund Award for Rheumatoid Arthritis Research and Care. J. A. Sparks reports research support from Bristol Myers Squibb; consulting fees from AbbVie, Amgen, Boehringer Ingelheim, Bristol Myers Squibb, Gilead, Inova Diagnostics, Janssen, Optum, and Pfizer, all unrelated to this work. The funders had no role in the decision to publish or preparation of this article. The content is solely the responsibility of the authors and does not necessarily represent the official views of Harvard University, its affiliated academic healthcare centers, or the National Institutes of Health. M.B. Brenner reports consulting fees from GlaxoSmithKline, 4FO Ventures, Third Rock Ventures and is consultant and founder of Mestag Therapeutics. M. A. Postow reports consulting fees from BMS, Merck, Novartis, Eisai, Pfizer, Chugai and institutional support from RGenix, Infinity, BMS, Merck, Novartis. A.R. Bass reports being a Member of the American College of Rheumatology, Board of Directors from 2019–2022.

Figures

Figure 1.
Figure 1.. Activated CD8 T cells accumulate in the synovium in ICI-arthritis.
a) Left and right knee radiographs prior to arthroplasty. b) Left and right knee synovial tissue H&E histology. c) Multiplexed immunofluorescence images showing diffuse CD8 T cell infiltration in left knee and aggregate-like CD8 T cell infiltration in right knee. CD3 staining is shown in red, CD8 in yellow, nuclear stain DAPI in blue. d) Synovial tissue (bilateral knee explants from n=1) and synovial fluid (n=5) lymphocytes resolve into 9 distinct clusters using scRNA-seq. e) UMAP visualization of T cell effector and memory signature scores for all lymphocytes in synovial samples. f) Synovial fluid (n=4) and tissue (bilateral knee explants from n=1) CD8 T cells analyzed by scRNA-seq and plotted in clusters in UMAP space. g) Dotplot visualization of differentially expressed genes that distinguish CD8 T cell clusters. Color of the dot represents the average expression of the gene across cells in the cluster. Size of the dot represents the percentage of cells h) UMAP visualization of T cell cytotoxic and dysfunctional signature scores for all CD8 T cells in synovial samples.
Figure 2.
Figure 2.. Extensive clonal expansion and proliferation of synovial CD8 T cells in ICI-arthritis.
a) The number of cells in each synovial CD8 T cell cluster that either contains a unique TCR (purple) or a shared TCR (all other colors, for which the total number of clones from the sample is represented by the specific color). Yellow in Cluster 3 represents TRAV1–2+ invariant MAIT cells. b) Expanded TCR clones (>1% of T cells from a patient) depicted onto the transcriptionally defined UMAP clustering. c) Number of distinct (gray) and shared CD8 TCR clonotypes in left and right knee from each transcriptionally defined cluster. Colored bars represent clonotypes in each cluster that can be found in both joints. Distance between black lines in the colored segment represents the size (number of cells) of shared clonotypes. d) Circle plot showing the number of clonotypes expressed in and shared between paired synovial fluid and blood CD8 T cells (n=2 patients). e) Representative alluvial plot of the proportion of shared clonotypes between paired synovial fluid and non-naïve blood CD8 T cells further compared to non-naïve blood CD8 T cells collected 10 weeks later for P23. f) UMAP representation of clonotypes shared between paired synovial fluid CD8 T cells and blood naïve and non-naïve CD8 T cells in P23. MAIT cells were excluded in the analysis (dark gray dots). Bar graphs show the number of cells contained in the shared clonotypes and the number of shared clonotypes in each cluster. Cluster IDs for figures (a), (c) and (f): 0 - GZM+, 1 - Transitional, 2 - Tcm, 3 - MAIT, 4 - ZNF683+, 5 - KLRG1+, 6 - Dysfunctional, and 7 - Proliferating.
Figure 3.
Figure 3.. Expansion of CD38hiCD127 CD8 T cells in ICI-arthritis (ICI-A).
a) tSNE visualization of FlowSOM metaclusters of CD8 T cells from ICI-A (n=6), RA (n=5) and PsA (n=5) synovial fluid. The red circle indicates area that includes MC1–3 with increased density in ICI-A. Black circle indicates area of MC5 with lower density in ICI-A. b) Frequency of FlowSOM metaclusters of CD8 T cells from ICI-A, RA and PsA synovial fluid. c) Heatmap of marker expression in CD8 T cell metaclusters. d) tSNE plots of mass cytometry data showing expression of indicated markers on CD8 T cells from ICI-A, RA and PsA synovial fluid. e,f) Biaxial gating (e) and quantification (f) of CD38hiCD127- cells among CD8 T cells from ICI-A, RA and PsA synovial fluid detected by mass cytometry. g) UMAP overlay of signature scores for gene sets that correlate with CD38, IL7R (CD127) or PDCD1 (PD-1) expression derived from bulk RNA-seq data. h) Representative flow cytometric plots and summarized frequency of intracellular granzyme B, perforin, IFN-γ, and TNF in CD38hiCD127 and CD38CD127+ populations from ICI-A synovial fluid, detected after PMA/ionomycin stimulation (n=3 donors). i) Frequency of intracellular Ki67 in sorted CD38hiCD127 and CD38CD127+ populations from ICI-A synovial fluid (n=7). Mean ± SD shown. j) Cytotoxicity assay of sorted CD38hiCD127 or CD38CD127+ CD8 T cells from synovial fluid. Control condition contains only target cells without CD8 T cells. Data represents ≥6 individual experiments. *p<0.05, **p<0.001, ***p<0.0001 by Kruskal-Wallis test in (b), (f), (h) and (i).
Figure 4.
Figure 4.. Type I IFN drives the expansion of synovial CD8 T cells in ICI-arthritis.
a) PCA plot showing the expression of 106 IFN-inducible genes across the sorted populations ordered by diseases. b) Heatmap showing clusters of CD8 T cell populations using genes differentially expressed by ICI-A, RA and PsA, with numbers indicating five sorted populations colored by disease. c) Gene module scores of the CD8 T cell populations as in (b) from ICI-A, PsA and RA synovial fluid, calculated based on differentially expressed genes (int = intermediate, var = variable). d) Frequency of CD38hiCD127 cells, CD38hiperforin+ cells and CD38+granzyme B+ cells in CD8 T cells from RA or PsA SFMC cultured with IFN-β or IFN-γ for indicated times. Lines link the same patient sample under the different conditions. Data represents ≥5 individual experiments. e) Cytotoxicity assay of sorted naïve, CD38CD127+, or CD38hiCD127 CD8 T cells from healthy blood. Data represents 2 individual experiments. f) Frequency of CD38hiCD127 cells among CD8 T cells from PBMC from control (n=10), ICI-A (n=15), RA (n=22), PsA (n=9), and SLE (n=6) patients. Mean ± SD shown. *p<0.05, **p<0.001, ***p<0.0001 by Kruskal-Wallis test in (c) and (f), Wilcoxon matched-pair test in (d) paired T test in (e).
Figure 5.
Figure 5.. Expansion of CD38hiCD127 CD8 T cells following ICI-therapy.
a) UMAP visualization of CD8 T cells plotted in clusters from mass cytometry analysis of melanoma patient PBMC before and after anti-PD-1 and anti-CTLA-4 therapy. b) Expression of markers present in the CD8 T clusters shown in the UMAP space. c) Distribution of CD8 T cells in the clusters depicted in (a). Black lines connect paired patients before and 6-weeks post initiation of therapy. d) Frequency of CD38hiCD127 CD8 T cells among total CD8 T cells pre and post initiation of therapy. e) Example of the gating strategy of the population divided in (f). f) PD-1+IgG4+ CD8 T cells are divided by their expression of CD38 and CD127. Statistical significance as compared to CD38hiCD127 is depicted. g) Frequency of CD38hiCD127 CD8 T cells in IgG4+ or IgG4 CD8 T cells in either blood or synovial fluid. h) Plot denoting the Morisita index value for each comparison demonstrating the repertoire overlap. Representative plot of three patients. See Fig S.12. i) Alluvial plot demonstrating the location and overlap of the top 10 most abundant TCR clones in anti-PD-1 bound and not bound blood and synovial fluid in one of the three patients. *p<0.05, **p<0.01, ***p<0.001 and ****p<0.0001 by Wilcoxon in (c), (d), and (f) and by Two-tailed Student’s t test (g).

References

    1. Dougan M, Luoma AM, Dougan SK, Wucherpfennig KW, Understanding and treating the inflammatory adverse events of cancer immunotherapy. Cell 184, 1575–1588 (2021). - PMC - PubMed
    1. Leach DR, Krummel MF, Allison JP, Enhancement of antitumor immunity by CTLA-4 blockade. Science 271, 1734–1736 (1996). - PubMed
    1. Nishimura H, Nose M, Hiai H, Minato N, Honjo T, Development of lupus-like autoimmune diseases by disruption of the PD-1 gene encoding an ITIM motif-carrying immunoreceptor. Immunity 11, 141–151 (1999). - PubMed
    1. Sharpe AH, Pauken KE, The diverse functions of the PD1 inhibitory pathway. Nat Rev Immunol 18, 153–167 (2018). - PubMed
    1. Michot JM, Bigenwald C, Champiat S, Collins M, Carbonnel F, Postel-Vinay S, Berdelou A, Varga A, Bahleda R, Hollebecque A, Massard C, Fuerea A, Ribrag V, Gazzah A, Armand JP, Amellal N, Angevin E, Noel N, Boutros C, Mateus C, Robert C, Soria JC, Marabelle A, Lambotte O, Immune-related adverse events with immune checkpoint blockade: a comprehensive review. Eur J Cancer 54, 139–148 (2016). - PubMed

Publication types

MeSH terms