. 2023 Jul 28;9(30):eadg1805.
doi: 10.1126/sciadv.adg1805. Epub 2023 Jul 28.

Control of protein synthesis through mRNA pseudouridylation by dyskerin

Affiliations

Control of protein synthesis through mRNA pseudouridylation by dyskerin

Chiara Pederiva et al. Sci Adv. .

Abstract

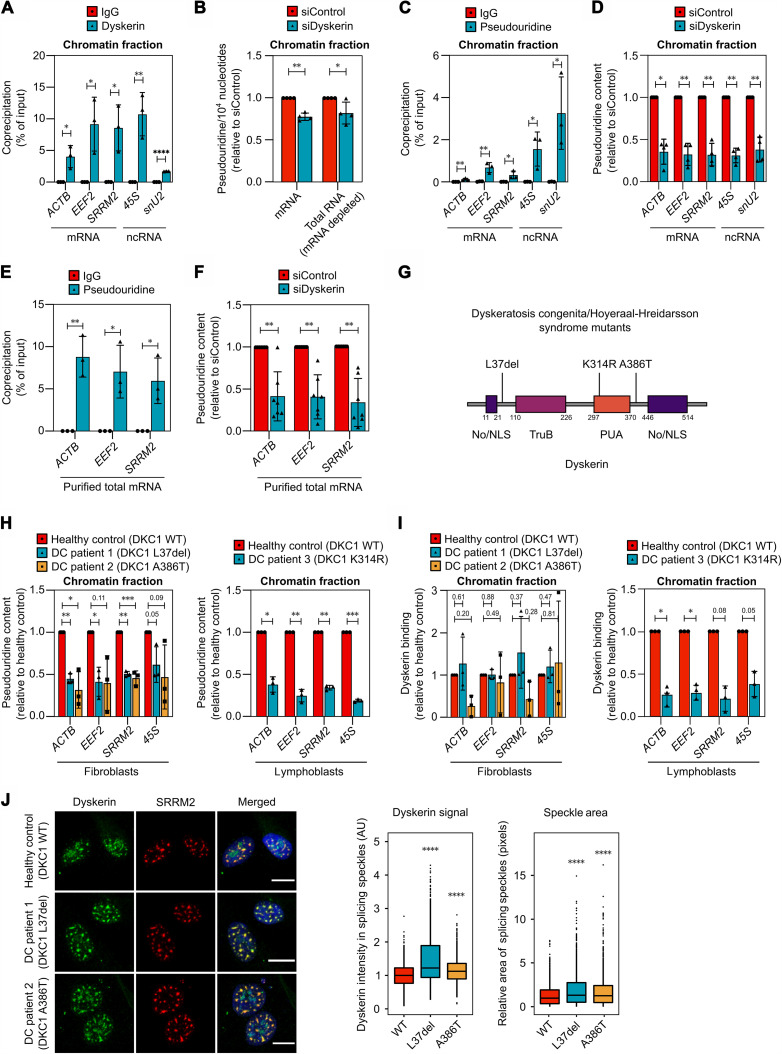
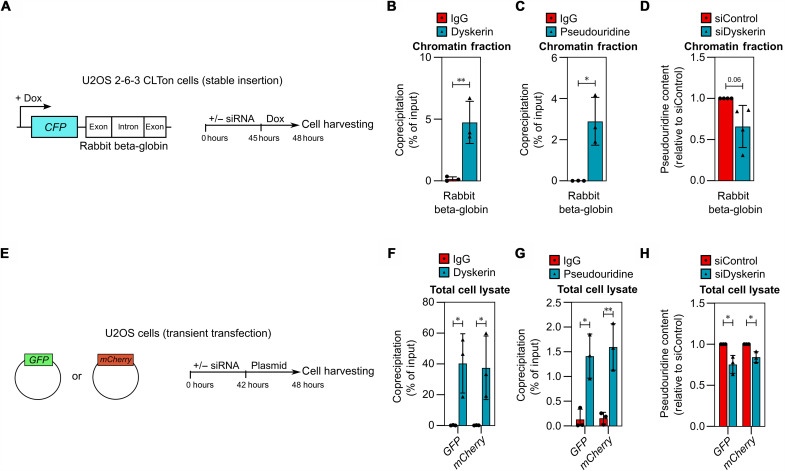
Posttranscriptional modifications of mRNA have emerged as regulators of gene expression. Although pseudouridylation is the most abundant, its biological role remains poorly understood. Here, we demonstrate that the pseudouridine synthase dyskerin associates with RNA polymerase II, binds to thousands of mRNAs, and is responsible for their pseudouridylation, an action that occurs in chromatin and does not appear to require a guide RNA with full complementarity. In cells lacking dyskerin, mRNA pseudouridylation is reduced, while at the same time, de novo protein synthesis is enhanced, indicating that this modification interferes with translation. Accordingly, mRNAs with fewer pseudouridines due to knockdown of dyskerin are translated more efficiently. Moreover, mRNA pseudouridylation is severely reduced in patients with dyskeratosis congenita caused by inherited mutations in the gene encoding dyskerin (i.e., DKC1). Our findings demonstrate that pseudouridylation by dyskerin modulates mRNA translatability, with important implications for both normal development and disease.


Figures

Fig. 1.
Fig. 1.. Dyskerin is localized in nuclear speckles.
(A) U2OS cells immunostained for dyskerin (green, Abnova antibody) and the speckle protein SRRM2 (red). Paraformaldehyde (PFA) fixation indicates fixation with 4% formaldehyde followed by permeabilization; “Pre-extraction” indicates permeabilization of cells with cytoskeleton buffer 5 min before fixation with PFA; “RNase A” is the same as pre-extraction, but with addition of RNase A (300 μg/ml) to the cytoskeleton buffer. Intensity profiles were calculated above the speckles indicated between the two arrows. DAPI, 4′,6-diamidino-2-phenylindole. (B) U2OS cells treated with 250 nM flavopiridol, 1 μM triptolide, or 100 nM pladienolide B for 2 hours, followed by treatment with RNase A and immunostaining for dyskerin (green, Abnova antibody) and SRRM2 (red). Plots show the distribution of signal intensity of dyskerin inside nuclear speckles, as determined by CellProfiler, three independent experiments, >60 cells per experiment. AU, arbitrary units. (C) U2OS cells were treated with pladienolide B for 2 hours, then treated with RNase A, and immunostained for GAR1, NHP2, or NOP1 (green) and the speckle marker SC-35 (red). Intensity profiles were calculated above the indicated speckles. (D) U2OS cells treated with the small interfering RNA (siRNAs) indicated for 48 hours and immunostained for dyskerin (green, Abnova antibody) and SF3B1 (red). The plot below the images shows the distribution of signal intensity of dyskerin inside nuclear speckles, as determined by CellProfiler, five independent experiments, >60 cells per experiment. (E) U2OS cells treated with the siRNAs indicated for 48 hours and immunostained for SF3B1 or SRRM2. Plots show the distribution of their signal intensity inside nuclear speckles, as determined by CellProfiler, four independent experiments, >60 cells per experiment. ****P ≤ 0.0001, as determined by a Wilcoxon rank sum test. Scale bar (white line), 10 μm.
Fig. 2.
Fig. 2.. Dyskerin associates with active regions of chromatin through RNAPII.
(A) Metadata profile of dyskerin ChIP-seq coverage over expressed [transcripts per million (TPM) > 1] protein-coding genes in U2OS cells (based on two independent experiments). The x axis shows scaled genomic regions, while the y axis shows the normalized log2 fold change compared to the input signal. (B) ChIP-seq profile of dyskerin and RNAPII (precipitated with antibody MAB0601) at the ACTB gene in control and flavopiridol-treated U2OS cells. The ChIP-seq signal is normalized to input and represents the average of two independent experiments. (C) Metadata profile of dyskerin and RNAPII ChIP-seq coverage around the TSS in U2OS cells after flavopiridol treatment (based on two independent experiments). The y axis shows the signal ratio between the flavopiridol treatment and the untreated control, as calculated after normalization of the signal over the corresponding inputs. (D) Immunoprecipitation (IP) of RNAPII or immunoglobulin G (IgG) (negative control) from the chromatin fraction of U2OS cells followed by Western blotting of the proteins indicated. A characteristic blot is shown. (E) IP of dyskerin or IgG from the chromatin fraction of U2OS cells followed by Western blotting of the proteins indicated. A characteristic blot is shown. (F) Heatmaps of dyskerin and RNAPII ChIP-seq signals along expressed (TPM > 1) protein-coding genes. Rows indicate all genes and are sorted by decreasing RNAPII occupancy. Signal abundances are displayed as colors ranging from blue (low binding) to red (high binding). (G) Metadata profile of dyskerin ChIP-seq coverage around the TES of expressed (TPM > 1) protein-coding genes in U2OS (top) and HCT116 (bottom) cells (based on two independent experiments). The x axis shows the distance to the TES, while the y axis shows the normalized log2 fold changes compared to the input signal. Expressed genes were divided into quartiles according to their TPM values (from three RNA-seq experiments).
Fig. 3.
Fig. 3.. Dyskerin and GAR1 bind to mRNAs.
(A) Correlation between iCLIP binding signals (log10) obtained from dyskerin or GAR1 in U2OS cells, divided by RNA biotype. The average of two independent experiments is shown. (B) Distribution of iCLIP reads from dyskerin and GAR1, divided by RNA biotype. The average of two independent experiments is shown. (C) Distribution of iCLIP peaks from dyskerin and GAR1 mapped inside protein-coding RNAs, normalized to the size of the following genic regions: untranslated regions (UTR), coding DNA sequences (CDS), and introns. The average of two independent experiments is shown. (D) Distribution of the iCLIP signal from dyskerin or GAR1 along the ACTB gene. The average of two independent experiments is shown. (E) Cumulative distribution of protein-coding RNAs bound by dyskerin (blue) and GAR1 (red) across protein-coding RNAs ranked according to their RNA-seq expression (TPM) (the highest to the lowest from left to right). (F) Splicing index calculated for protein-coding RNAs bound by dyskerin or GAR1.
Fig. 4.
Fig. 4.. Dyskerin pseudouridylates mRNA cotranscriptionally and this process is disrupted in patients with dyskeratosis congenita.
(A) RIP using an antibody targeting dyskerin from the chromatin fraction of U2OS cells. Shown is the amount of coprecipitated RNA as percentage of input (mean ± SD, three independent experiments) measured by qPCR. (B) Quantification of RNA modifications using LC-MS/MS. mRNA and total RNA remaining after mRNA depletion were extracted from chromatin fractions of U2OS cells treated with siRNA for 48 hours. Shown are the levels of pseudouridine normalized to the number of canonical ribonucleosides and relative to the control sample (mean ± SD, four independent experiments). (C and D) RIP using an antibody targeting pseudouridine from the chromatin fraction of U2OS cells. In (D), cells were treated with siRNA for 48 hours. (E and F) RIP using an antibody targeting pseudouridine from mRNA purified from whole U2OS cells. In (F), cells were treated with siRNA for 48 hours. (G) Dyskerin protein domains and the dyskeratosis congenita–associated mutations in the patient cells examined. No/NLS, nucleolar/nuclear localization signal; TruB, PUS domain; PUA, PUS and archaeosine transglycosylase domain. (H and I) RIP using an antibody targeting pseudouridine (H) or dyskerin (I) from the chromatin fraction of fibroblasts or lymphoblasts from patients with dyskeratosis congenita (DC) and healthy donors. (J) Fibroblasts from patients with DC and healthy donors were immunostained for dyskerin (green, Abnova antibody) and the speckle protein SRRM2 (red). Scale bar (white line), 10 μm. Plots show the distribution of dyskerin signal intensity inside nuclear speckles and area of speckle as determined by CellProfiler. Wilcoxon rank sum test. Two independent experiments, >30 cells per experiment. For RIP experiments, graphs show the coprecipitated RNA as percentage of input (mean ± SD, ≥3 independent experiments) measured by qPCR. RIP samples were compared as indicated using an unpaired two-tailed t test (A), (C), and (E), paired ratio two-tailed t test (I), or paired ratio one-tailed t test (B), (D), (F), and (H). *P < 0.05, **P < 0.01, ***P < 0.001, and ****P ≤ 0.0001.
Fig. 5.
Fig. 5.. mRNA pseudouridylation by dyskerin does not appear to require a guide RNA with perfect complementarity.
(A) Schematic representation of the U2OS 2-6-3 CLTon reporter system and experimental setup. (B to D) RIP using an antibody targeting dyskerin (B) or pseudouridine (C) and (D) from the chromatin fraction of U2OS 2-6-3 CLTon cells treated with doxycycline for 3 hours to induce the expression of the exogenous cassette. In (D), cells were treated with siRNA for 48 hours. The graphs show the amount of coprecipitated RNA as percentage of input (mean ± SD, ≥3 independent experiments) measured by qPCR. (E) Schematic representation of the GFP/mCherry reporter systems and experimental setup. (F to H) RIP using an antibody targeting dyskerin (F) or pseudouridine (G) and (H) from whole-cell lysate of U2OS cells transfected with plasmids encoding GFP or mCherry for 6 hours. In (H), cells were treated with siRNA for 48 hours. The graphs show the coprecipitated RNA as percentage of input (mean ± SD, ≥3 independent experiments) measured by qPCR. RIP samples were compared as indicated using an unpaired two-tailed t test (B), (C), (F), and (G) or a paired ratio one-tailed t test (D) and (H). *P < 0.05 and **P < 0.01.
Fig. 6.
Fig. 6.. Loss of dyskerin-mediated mRNA pseudouridylation enhances protein synthesis.
(A and B) U2OS cells transfected with siRNA for 48 hours (A) or for the last 16 hours also with plasmids encoding GFP-Dyskerin resistant to siDyskerin #7 (B), pulsed with puromycin, and analyzed by Western blot. Shown are a representative blot and quantification of puromycin normalized to β-actin and relative to siControl (mean ± SD, three independent experiments). (C) Polysomal fractionation of MCF7 cells treated with siRNA for 48 hours. Shown is a representative profile (three independent experiments). (D) Total mRNA and polysome-associated mRNA (associated with more than three ribosomes) from (C) were quantified using qPCR. Expression, relative to the siControl sample, is shown (mean ± SD, three independent experiments). (E) The expression of rRNA intermediates (left) and puromycin incorporation (right) in siRNA-treated U2OS cells analyzed by qPCR or Western blot, respectively. RNA levels are shown normalized to β-actin and relative to siControl (mean ± SD, four independent experiments). Full Western blots and quantifications are shown in fig. S7 (C and D). (F) U2OS 2-6-3 CLTon cells were treated with siRNA for 48 hours and for the last 3 hours with doxycycline and analyzed by Western blot. Shown are representative blots and densitometric quantification normalized as in (A) (four biological replicates). (G) U2OS cells were treated with siRNA for 48 hours and for the last 6 hours with plasmids encoding GFP or mCherry and analyzed by Western blot. Shown are representative blots and densitometric quantification normalized as in (A) (three biological replicates). (H) GFP mRNAs containing the indicated amount of pseudouridine were translated in wheat germ extract and protein production assessed by Western blotting. Shown is a representative blot and quantification normalized to the 0% pseudouridine sample (mean ± SD, three independent experiments). Samples were compared using a paired ratio two-tailed t test. *P < 0.05, **P < 0.01, and ****P ≤ 0.0001.
Fig. 7.
Fig. 7.. Schematic model of dyskerin-mediated mRNA pseudouridylation and protein synthesis.
(Step 1) Dyskerin and the H/ACA complex associate with chromatin and RNAPII cotranscriptionally. (Step 2) This allows pseudouridylation of mRNA by dyskerin, potentially using LINE/Alu RNA as guides. In addition, dyskerin pseudouridylates rRNA in the nucleolus. (Step 3) Pseudouridines in mRNA reduce its translation allowing controlled protein synthesis. When the function of dyskerin is impaired, it has different outcomes on translation depending on the duration of impairment; short-term (48 hours) depletion enhances translation due to reduced mRNA pseudouridylation, while long-term (>96 hours) depletion attenuates translation due to defective rRNA pseudouridylation and processing. Inherited mutation of dyskerin in dyskeratosis congenita has a similar outcome on translation as long-term depletion of the enzyme.

References

    1. F. F. Davis, F. W. Allen, Ribonucleic acids from yeast which contain a fifth nucleotide. J. Biol. Chem. 227, 907–915 (1957). - PubMed
    1. W. E. Cohn, E. Volkin, Nucleoside-5′-phosphates from ribonucleic acid. Nature 167, 483–484 (1951).
    1. E. K. Borchardt, N. M. Martinez, W. V. Gilbert, Regulation and function of RNA pseudouridylation in human cells. Annu. Rev. Genet. 54, 309–336 (2020). - PMC - PubMed
    1. J. Ge, Y.-T. Yu, RNA pseudouridylation: New insights into an old modification. Trends Biochem. Sci. 38, 210–218 (2013). - PMC - PubMed
    1. T. M. Carlile, M. F. Rojas-Duran, B. Zinshteyn, H. Shin, K. M. Bartoli, W. V. Gilbert, Pseudouridine profiling reveals regulated mRNA pseudouridylation in yeast and human cells. Nature 515, 143–146 (2014). - PMC - PubMed

MeSH terms