Clinical Trial
. 2023 Sep:95:104732.
doi: 10.1016/j.ebiom.2023.104732. Epub 2023 Jul 26.

Plasma proteomic profiling identifies CD33 as a marker of HIV control in natural infection and after therapeutic vaccination

Affiliations
Clinical Trial

Plasma proteomic profiling identifies CD33 as a marker of HIV control in natural infection and after therapeutic vaccination

Clara Duran-Castells et al. EBioMedicine. 2023 Sep.

Abstract

Background: Biomarkers predicting the outcome of HIV-1 virus control in natural infection and after therapeutic interventions in HIV-1 cure trials remain poorly defined. The BCN02 trial (NCT02616874), combined a T-cell vaccine with romidepsin (RMD), a cancer-drug that was used to promote HIV-1 latency reversal and which has also been shown to have beneficial effects on neurofunction. We conducted longitudinal plasma proteomics analyses in trial participants to define biomarkers associated with virus control during monitored antiretroviral pause (MAP) and to identify novel therapeutic targets that can improve future cure strategies.

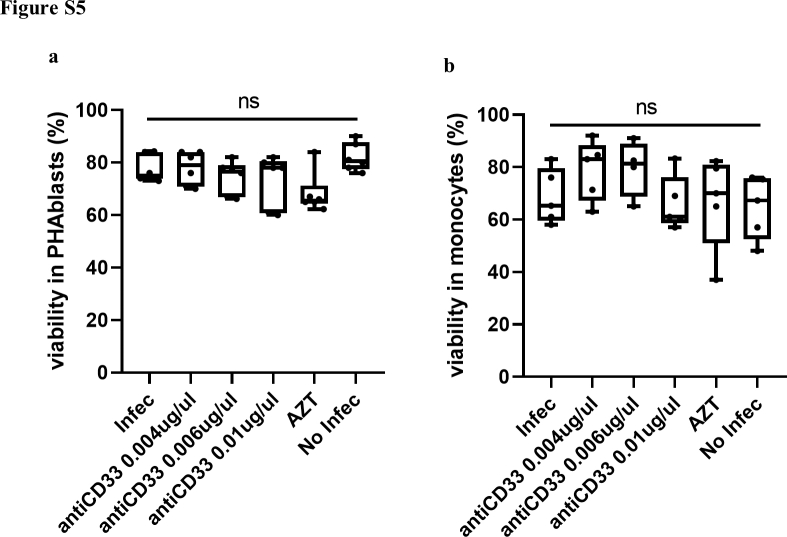
Methods: BCN02 was a phase I, open-label, single-arm clinical trial in early-treated, HIV infected individuals. Longitudinal plasma proteomes were analyzed in 11 BCN02 participants, including 8 participants that showed a rapid HIV-1 plasma rebound during a monitored antiretroviral pause (MAP-NC, 'non-controllers') and 3 that remained off ART with sustained plasma viremia <2000 copies/ml (MAP-C, 'controllers'). Inflammatory and neurological proteomes in plasma were evaluated and integration data analysis (viral and neurocognitive parameters) was performed. Validation studies were conducted in a cohort of untreated HIV-1+ individuals (n = 96) and in vitro viral replication assays using an anti-CD33 antibody were used for functional validation.

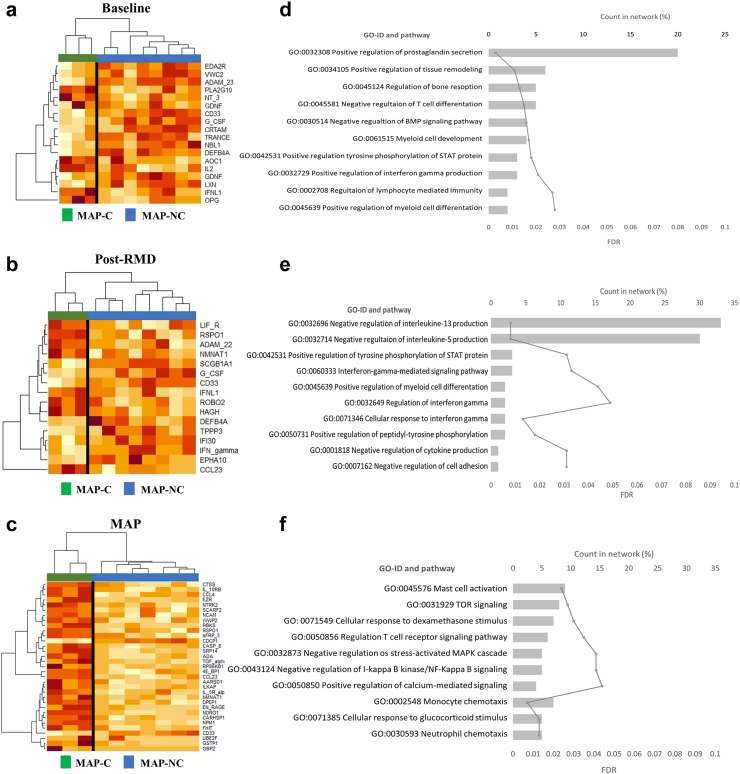
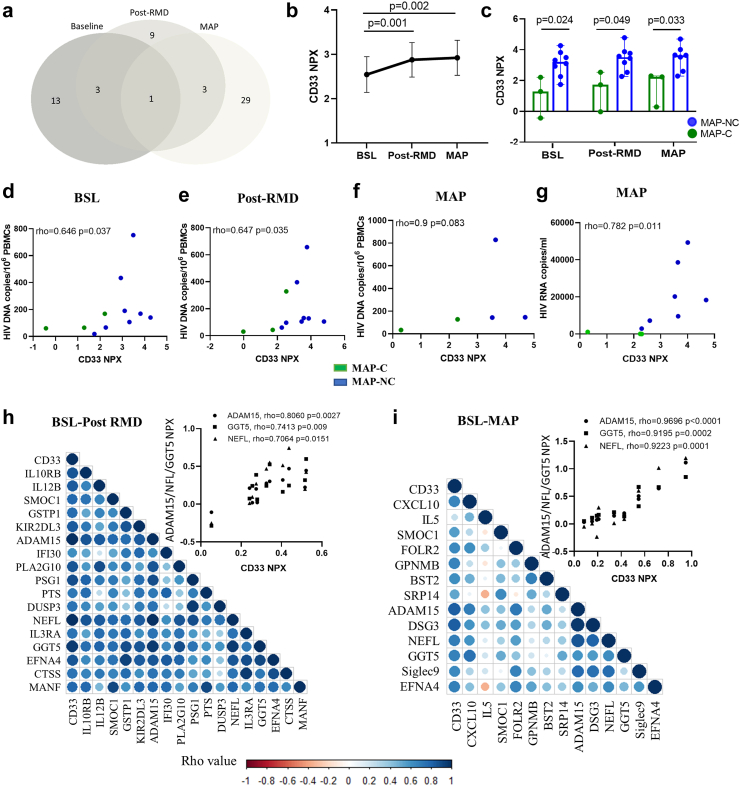
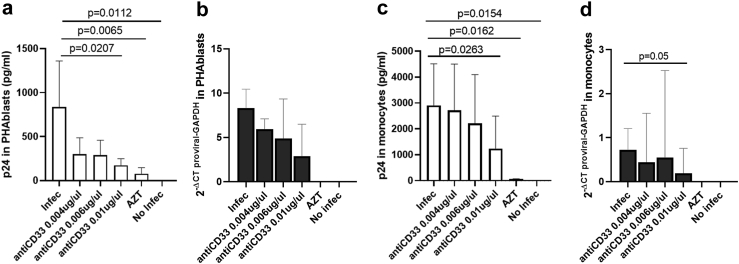
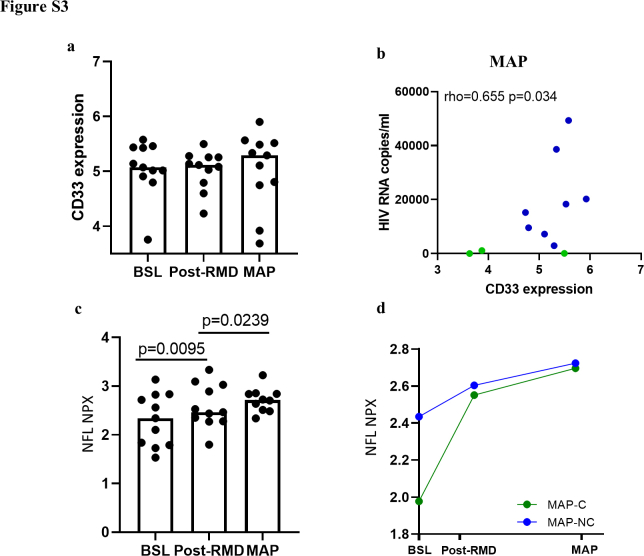
Findings: Inflammatory plasma proteomes in BCN02 participants showed marked longitudinal alterations. Strong proteome differences were also observed between MAP-C and MAP-NC, including in baseline timepoints. CD33/Siglec-3 was the unique plasma marker with the ability to discriminate between MAPC-C and MAP-NC at all study timepoints and showed positive correlations with viral parameters. Analyses in an untreated cohort of PLWH confirmed the positive correlation between viral parameters and CD33 plasma levels, as well as PBMC gene expression. Finally, adding an anti-CD33 antibody to in vitro virus cultures significantly reduced HIV-1 replication and proviral levels in T cells and macrophages.

Interpretation: This study indicates that CD33/Siglec-3 may serve as a predictor of HIV-1 control and as potential therapeutic tool to improve future cure strategies.

Funding: Spanish Science and Innovation Ministry (SAF2017-89726-R and PID2020-119710RB-I00), NIH (P01-AI131568), European Commission (GA101057548) and a Grifols research agreement.

Keywords: Control of HIV-1 infection; Inflammation; Kick and kill HIV cure strategy; Neurological function; Plasma proteomics; Siglec-3/CD33.


Conflict of interest statement

Declaration of interests BM is a consultant of AELIX THERAPEUTICS, SL outside the submitted work. CB is co-founder, chief science officer and shareholder of AELIX THERAPEUTICS. TH is a coinventor of the HIVconsv immunogen. All other authors declare that they have no competing interests.

Figures

Fig. 1
Fig. 1
Changes in plasma proteomes during the BCN02 clinical trial. Soluble proteomes from 11 participants in the BCN02 trial at baseline (BSL), 1 week after 3 infusions of RMD (post-RMD) and during monitored antiretroviral pause (MAP) timepoints were determined using the proximity extension assay. a) Principal Component Analysis (PCA) reflecting the changes of 276 inflammatory and neurological-related plasma proteins during the BCN02 clinical trial at each tested timepoint. The BSL timepoint are is indicated in green, post-RMD timepoint in blue and MAP timepoint in red, each point representing one participant. b) Venn diagram representing differentially detected proteins when comparing BSL vs post-RMD (n = 49) and BSL vs MAP phase timepoints (n = 76). The different profiles indicate relative abundance of proteins that were up- or down-regulated: Profile I: Significant changes only detected when comparing BSL vs post-RMD infusions (n = 20); Profile II: Proteins that show significant changes when comparing BSL vs post-RMD as well as BSL vs MAP timepoints (n = 29); and Profile III: Significant changes only detected when comparing BSL vs MAP phase (n = 47). The x-axis marks the timepoints of the clinical trial and on the y-axis, the relative levels of the proteins, represented as the mean of NPX values for each protein. Longitudinal changes between BSL vs post-RMD and BSL vs MAP phase timepoints were assessed using Wilcoxon signed rank test. c) Heatmap showing the relative protein levels (NPX) of all significantly modulated proteins from (b) (p < 0.05, n = 96) per patient and timepoint (orange-yellow scale). Each column represents a patient measured at BSL, post-RMD and MAP. Additional columns (blue-pink scale, right of the heatmap) indicate the value of correlations (Spearman’s rho) between individual proteins and either plasma viral load, proviral levels or neurotest score (NPZ6). The Spearman's rank test was used for correlation analyses. d) Pie charts representing the percentages of number of proteins that are negatively or positively correlated with viral parameters (viral load and proviral levels, respectively) and with neurological parameters (NPZ6 evaluation matrix). Blue (post-RMD), purple (MAP), dark color indicates positive correlations and light color negative correlations. The Chi-square test was applied for categorizing positive or negative correlation. Statistical significance was set at p < 0.05.
Fig. 2
Fig. 2
Differential plasma proteomes between MAP-C and MAP-NC. a–c) Heatmap of relative protein plasma levels (NPX) of proteins differentially detected between MAP-C and MAP-NC at (a) baseline, (b) post-RMD and (c) the MAP phase of the BCN02 clinical trial. Orange-yellow scale indicates NPX values. Green represents MAP-C and blue MAP-NC participants. d–f) Gene Ontology (GO) classification of proteins that differed significantly between MAP-C and MAP-NC at each timepoint. On the y-axis, gene ontology categories are indicated, on the upper x-axis, counts in network are noted to indicate how many proteins in our network are annotated with a particular term (GO, represented as percentage in histogram) and on the lower x-axis, as continuous line, the false discovery rate (FDR) representation.
Fig. 3
Fig. 3
CD33 plasma protein levels differentiate MAP-C and MAP-NC across the clinical trial. a) Venn diagram showing differentially detected proteins between MAP-C and MAP-NC in samples from each timepoint of the clinical trial (BSL, post-RMD and MAP). b) Longitudinal representation of the relative plasma CD33 levels (NPX, y-axis) at each timepoint (x-axis). Values are shown as mean and standard error. Longitudinal changes over time were assessed using Wilcoxon signed rank test. c) Cross-sectional analysis of the relative CD33 plasma levels in MAP-C (green color) and MAP-NC (blue color) individuals over the duration of the clinical trial. Clinical trial timepoints are shown on the x-axis, and relative plasma levels of CD33 shown on the y-axis. Values are shown as median and max and min. Group changes per timepoint were assessed using the Mann–Whitney U test. d–f) Correlation analysis between relative CD33 protein levels (NPX, x-axis) vs HIV proviral DNA levels (HIV DNA copies/106 PBMCs, y-axis) are shown on the y-axis in each timepoint of the study including (d) baseline, (e) post-RMD and (f) MAP phase. The Spearman's rank test was used for correlation analyses. g) Correlation analysis showing the association between relative CD33 protein levels (NPX, x-axis) vs plasma viral load (HIV RNA copies/ml, x-axis) in MAP phase. Green dots indicate MAP-C and blue dots indicate MAP-NC. The Spearman's rank test was used for correlation analyses. h and i) Correlogram plots of the significantly changed proteins detected between BSL vs post-RMD (h) and BSL vs MAP phase (i) that correlate with CD33 relative plasma levels. Colored dots indicate the level of correlation (blue: positive correlation and red: negative correlation). Upper graphs indicate the strongest associations observed between CD33 and 3 proteins (NEFL, GGT5 and ADAM15) in the neurology panel. The Spearman's rank test was used for correlation analyses. Statistical significance was set at p < 0.05.
Fig. 4
Fig. 4
CD33 levels in natural untreated HIV infection. Proteomic array using plasma samples from ART-naïve, chronically HIV-1 infected individuals with different degrees of HIV control (n = 96), categorized as HIV-high and HIV-low according to their viral load. a) Scatter plot showing the plasma CD33 protein levels (y-axis) in both groups (x-axis); HIV-low (n = 49, green dots) and HIV-high (n = 47, red dots). Mann–Whitney U test was applied between HIV-high and HIV-low. b) CD33 gene expression (y-axis, relative CD33 gene expression corrected for CD4 counts) measured in PBMCs of HIV-high (n = 12, red dots) and HIV-low (n = 25 green dots) (x-axis) individuals. Mann–Whitney U test was applied between HIV-high and HIV-low. c) Correlation analysis between CD33 gene expression (corrected for CD4 counts, y-axis) and CD33 protein levels in plasma considering all individuals. The Spearman's rank test was used for correlation analyses. d and e) Correlation analysis between (d) CD33 plasma protein levels and (e) CD33 gene expression levels (x-axis) and viral load levels (HIV RNA copies/ml, y-axis). HIV-high, n = 47, red dots and HIV-low, n = 49, green dots. The Spearman's rank test was used for correlation analyses. f and g) Correlation analysis between (f) CD33 plasma protein levels and (g) CD33 gene expression levels (x-axis) and HIV proviral DNA levels in total PBMC (HIV DNA copies/106 PBMCs, y-axis). Considering all the individuals (HIV-high, n = 47, red dots and HIV-low, n = 49, green dots. The Spearman's rank test was used for correlation analyses. h) Correlogram plot between CD33 levels in plasma and PBMC expression and viral parameters. CD33 differences between groups were analyzed using the Mann–Whitney test. The Spearman's rank test was used for correlation analyses. Statistical significance was set at p < 0.05.
Fig. 5
Fig. 5
Targeting CD33 reduces HIV replication and provirus levels. a and c) Inhibition of HIV replication in the presence of anti-CD33 mAb, tested in (a) PHA-stimulated T cells infected with the HIVNL4-3 strain; (c) HIV infected monocyte-derived macrophages infected with the HIVBaL strain. Experimental conditions are shown on the x-axis and quantification of absolute p24 supernatant (pg/ml) is shown on the y-axis. b and d) Total HIV-1 DNA quantification in cells from the same T cell and MDMs experiments as in (a) and (c). Experimental conditions are shown on the x-axis and quantification of total HIV-1 DNA is shown on the y-axis. All the plots show the median and standard deviation of six (PHA-stimulated T cells) and five (monocyte-derived macrophages) independent experiments in duplicates for each condition. For HIV infected T cells and MDMs, One-Way ANOVA test corrected for multiple comparisons. Original FDR method of Benjamini and Hochberg was used to analyze differences between conditions. For all comparisons, p < 0.05 was considered statistically significant.
Supplementary Figure S1
BCN02 clinical trial scheme. Schematic representation of the BCN02 clinical trial with sampling timepoints: baseline (BSL timepoint), three RMD infusions at week 3, 4 and 5 (week 6 is post-RMD timepoint) followed by ART interruption at week 17 until viral rebound or week 30 ART resumption (MAP timepoint). Week 54 end of the BCN02 clinical trial. Analyzed timepoints labeled with arrows: baseline (BSL), post-RMD infusions (post-RMD) and monitored antiretroviral pause phase (MAP), when plasma proteomics and neurological assessments were conducted.
Supplementary Figure S2
Principal component analysis (PCA) differentiates MAP-C and MAP-NC. a–c) PCA plots of differentially detected proteins between MAP-C and MAP-NC at a) baseline, b) post-RMD infusions and c) MAP phase. Orange dots indicate MAP-NC and green dots MAP-C participants. Upper plots show PC1 (x-axes) vs PC3 (y-axes) and lower plots show PC1 (x-axes) vs PC4 (y-axes).
Supplementary Figure S3
CD33 and NEFL gene expression during the BCN02 clinical trial. a) CD33 gene expression levels at baseline (BSL), post-RMD infusions (post-RMD) and at MAP phase (MAP). The upper limit of the bar is the median value of CD33 plasma levels. Longitudinal changes over time were assessed using Wilcoxon signed rank test. b) Correlation between CD33 gene expression levels and plasma viral load in the MAP phase. MAP-C individuals are labeled in green and MAP-NC individuals in blue, respectively. The Spearman's rank test was used for correlation analyses. c) Relative NEFL plasma levels (NPX) at baseline (BSL), post-RMD infusions (post-RMD) and at MAP phase (MAP). The upper limit of the bar is the median value of relative NEFL plasma levels. Longitudinal changes over time were assessed using Wilcoxon signed rank test. d) Plot representing relative NEFL plasma levels in MAP-C (green line) and MAP-NC (blue line) individuals over the clinical trial. Weeks of treatment are shown on the x-axis, and relative NEFL plasma levels shown on the y-axis. Values are shown as median and standard deviation. Differences between MAP-C and MAP-NC groups per timepoint were assessed using the Mann–Whitney U test. Statistical significance was set at p < 0.05.
Supplementary Figure S4
CD33 levels in natural untreated HIV infection. Scatter plot showing the plasma CD33 protein levels (y-axis) in individuals stratified by viral load either >2000 HIV-RNA copies/ml) or <2000 HIV-RNA copies/ml) and in the Elite Controllers group (<50 HIV-RNA copies/ml) (x-axis). ANOVA test corrected for multiple comparisons Original FDR method of Benjamini and Hochberg was used to test for differences between the three groups.
Supplementary Figure S5
In vitro cell viability in cultures with anti-CD33 mAb. Cell viability in the presence of increasing concentration of the anti-CD33 mAb, tested in (a) HIV infected PHA-stimulated T cells (six independent experiments) with HIVNL4-3 strain; and in (b) monocyte-derived macrophages (five independent experiments) infected with HIVBAL strain. Experimental conditions are shown on the x-axis; quantification of viability (% live cells) is shown on the y-axis. For HIV infected T cells and MDMs, One-Way ANOVA test corrected for multiple comparisons Original FDR method of Benjamini and Hochberg was used to analyze differences between conditions. For all comparisons, p < 0.05 was considered statistically significant.

References

    1. Cillo A.R., Mellors J.W. Which therapeutic strategy will achieve a cure for HIV-1? Curr Opin Virol. 2016;18:14–19. doi: 10.1016/j.coviro.2016.02.001. - DOI - PubMed
    1. Zeng H., Xu L., Zou Y., Wang S. Romidepsin and metformin nanomaterials delivery on streptozocin for the treatment of Alzheimer’s disease in animal model. Biomed Pharmacother. 2021;141 doi: 10.1016/j.biopha.2021.111864. - DOI - PubMed
    1. Mothe B., Rosás-Umbert M., Coll P., et al. HIVconsv vaccines and romidepsin in early-treated HIV-1-infected individuals: safety, immunogenicity and effect on the viral reservoir (Study BCN02) Front Immunol. 2020;11:823. - PMC - PubMed
    1. Rosás-Umbert M., Ruiz-Riol M., Fernández M.A., et al. In vivo effects of romidepsin on T-cell activation, apoptosis and function in the BCN02 HIV-1 kick&Kill clinical trial. Front Immunol. 2020;11:418. - PMC - PubMed
    1. Létourneau S., Im E.J., Mashishi T., et al. Design and pre-clinical evaluation of a universal HIV-1 vaccine. PLoS One. 2007;2(10) - PMC - PubMed

Publication types

MeSH terms