. 2023 Dec;164(6):1492-1504.
doi: 10.1016/j.chest.2023.07.019. Epub 2023 Jul 26.

Race-Specific Spirometry Equations Do Not Improve Models of Dyspnea and Quantitative Chest CT Phenotypes

Affiliations

Race-Specific Spirometry Equations Do Not Improve Models of Dyspnea and Quantitative Chest CT Phenotypes

Amy L Non et al. Chest. 2023 Dec.

Abstract

Background: Race-specific spirometry reference equations are used globally to interpret lung function for clinical, research, and occupational purposes, but inclusion of race is under scrutiny.

Research question: Does including self-identified race in spirometry reference equation formation improve the ability of predicted FEV1 values to explain quantitative chest CT abnormalities, dyspnea, or Global Initiative for Chronic Obstructive Lung Disease (GOLD) classification?

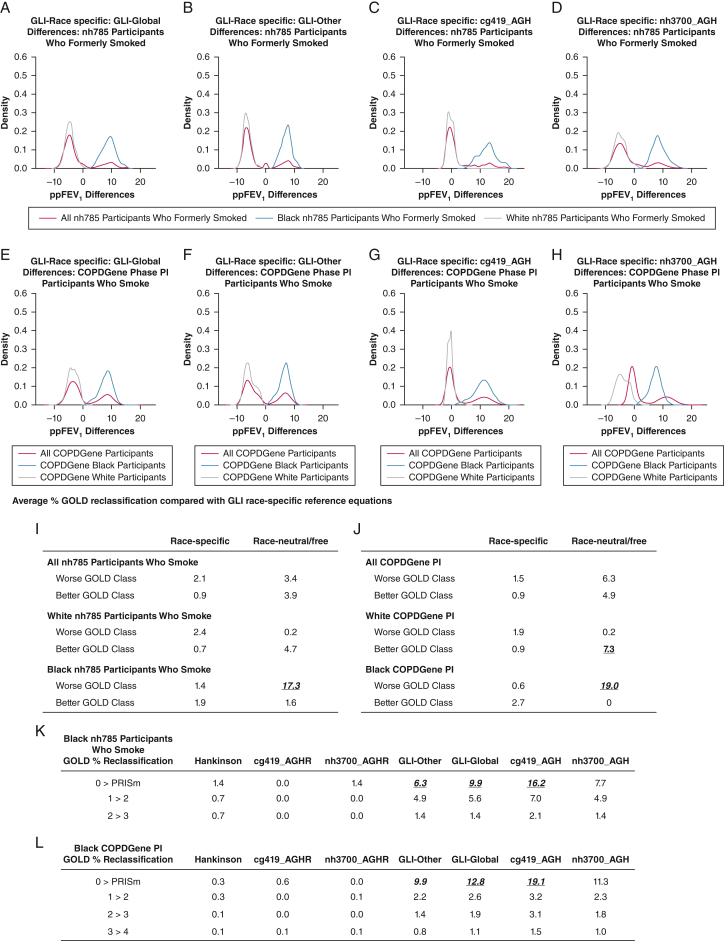
Study design and methods: Using data from healthy adults who have never smoked in both the National Health and Nutrition Survey (2007-2012) and COPDGene study cohorts, race-neutral, race-free, and race-specific prediction equations were generated for FEV1. Using sensitivity/specificity, multivariable logistic regression, and random forest models, these equations were applied in a cross-sectional analysis to populations of individuals who currently smoke and individuals who formerly smoked to determine how they affected GOLD classification and the fit of models predicting quantitative chest CT phenotypes or dyspnea.

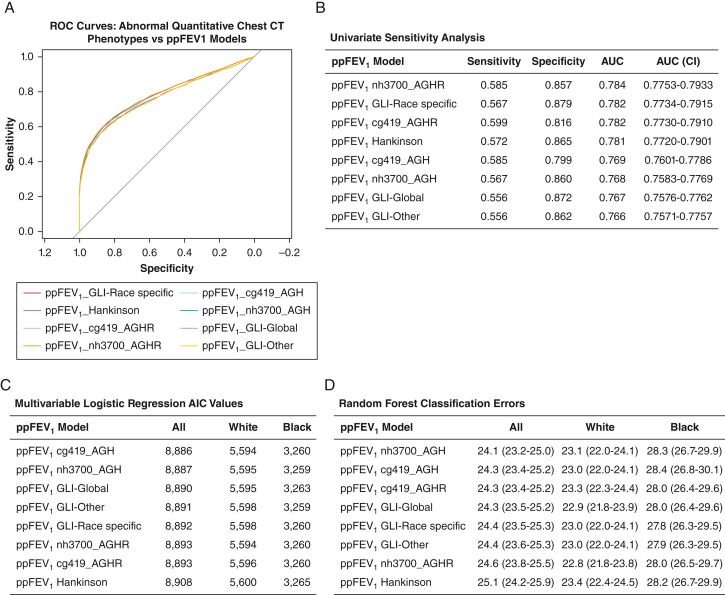
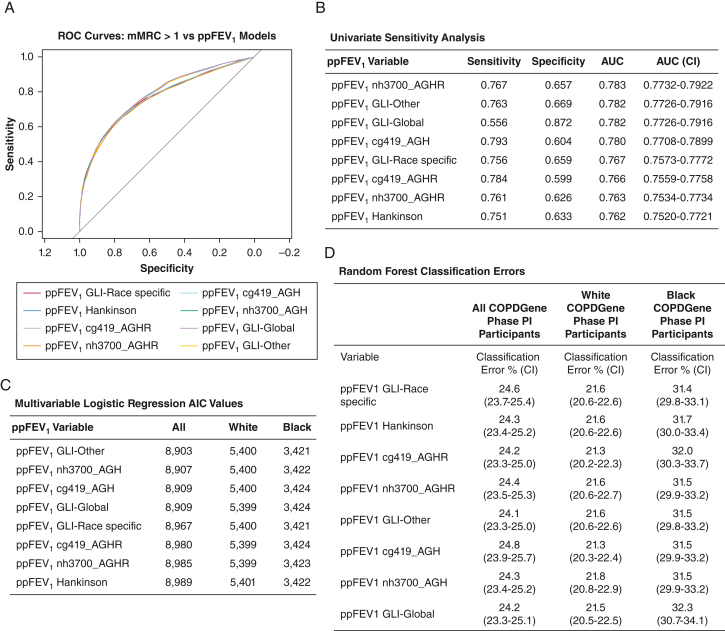
Results: Race-specific equations showed no advantage relative to race-neutral or race-free equations in models of quantitative chest CT phenotypes or dyspnea. Race-neutral reference equations reclassified up to 19% of Black participants into more severe GOLD classes, while race-neutral/race-free equations may improve model fit for dyspnea symptoms relative to race-specific equations.

Interpretation: Race-specific equations offered no advantage over race-neutral/race-free equations in three distinct explanatory models of dyspnea and chest CT scan abnormalities. Race-neutral/race-free reference equations may improve pulmonary disease diagnoses and treatment in populations highly vulnerable to lung disease.

Keywords: ethnicity; pulmonary function test; race; reference equations; spirometry.


Conflict of interest statement

Financial/Nonfinancial Disclosures The authors have reported to CHEST the following: A. L. N. receives support from UCSD Academic Senate and UCSD Division of Social Sciences Research grants. A. A. D. declares speaker fees from Boehringer Ingelheim, outside of the submitted work. A. K. B. is funded by the National Institutes of Health (NIH) [Grants KL2TR002492 and UL1TR002494], unrelated to the current work. S. P. B. is supported by the NIH [Grants R01 HL151421 and NIH UH3HL155806], Nuvaira, and Sanofi; and has received royalties from Springer Humana and consulting fees from Boehringer Ingelheim, Sanofi/Regeneron, and IntegrityCE, unrelated to the current work. R. C. has been supported by grants from AstraZeneca, Regeneron, and Genentech; consulting fees from Regeneron, Genentech, Inogen, and Boehringer Ingelheim; and honoraria from GlaxoSmithKline, unrelated to current work. R. C. is also on the Board of Directors for the COPD Foundation and President of the Pulmonary Education and Research Foundation. None declared (B. B., E. A. R., A. W., A. L., C. R., G. K., K. A. Y., B. F., C. H., D. J. C.).

Figures

None
Graphical abstract
Figure 1
Figure 1
A-L, Effects of race-specific vs race-neutral/free equations on predicted FEV1 values and GOLD reclassification. Probability density of the differences in ppFEV1 values in NHANES and COPDGene participants who smoked between GLI race-specific and GLI-Global (A, E), GLI Race-specific and GLI-Other (B, F); GLI race-specific and cg419_AGH (C, G), and GLI race-specific and nh3700_AGH (D, H). Differences in ppFEV1 were calculated by subtracting each ppFEV1 estimate derived from race-neutral or race-free equations from the estimate derived from the GLI standard (race-specific) equation. Red lines = all COPDGene PI participants; blue lines = Black phase I participants; gray lines = White phase I participants. Average GOLD reclassification rates of the three race-specific (Hankinson, cg419AGHR, and nh3700AGHR) and three race-neutral/race-free (GLI-Other, cg419_AGH, and nh3700_AGH) prediction equations were subtracted from the standard GLI equation in the combined Black/White cohort, Black, and White participants in the nh785 smoker cohort (I) and the COPDGene PI cohort (J), reported as the average percent reclassified. GOLD 0 class is defined as FEV1/FVC ratio > 0.7 and ppFEV1 > 80%. PRISm class is defined as FEV1/FVC ratio < 0.7 and ppFEV1 < 80%. GOLD reclassification rates (percent reclassified of total Black population) are shown in Black nh785 participants who formerly smoked (K) and Black COPDGene particiants who smoke (L) from the GLI race-specific equations by GOLD class transitions (rows) and models (columns). AGH = age, gender, and height; AGHR = age, gender, height, and race; cg419 = COPDGene dataset of 419 healthy individuals; COPDGene PI = COPDGene Study Phase I; GLI = Global Lung Initiative; GOLD = Global Initiative for Chronic Obstructive Lung Disease; nh3700 = National Health and Nutrition Examination Survey data set of 3,700 healthy individuals; NHANES = National Health and Nutrition Examination Survey; ppFEV1 = percent predicted FEV1; PRISm = preserved ratio impaired spirometry.
Figure 2
Figure 2
A, ROC curves of any abnormal quantitative chest CT phenotypes: (1) percent emphysema > 5%; (2) percent air trapping > 15%; and (3) airway wall thickness if the airway wall thickness estimate based on square root of wall area of a 10 mm lumen perimeter. B, Sensitivity, specificity, AUC and AUC confidence intervals (CI) of the ROC curve of the ppFEV1 to predict any abnormal chest CT scan phenotype in the COPDGene phase I cohort. The sensitivity and specificity analyses used the lower limit of normal or the fifth percentile for each of the models. C, AIC from the multivariable logistic regression models of any abnormal quantitative CT phenotype with the following covariates: FEV1/FVC ratio, smoking history (pack-years), scanner maker, smoking status, gender, and ppFEV1. The AIC value generated from the models using the different race-specific and race-neutral equations for the ppFEV1 are listed for the total cohort and also for the Black and White participants individually. D, Supervised random forest models of the abnormal chest CT scan phenotypes were generated using the same covariates as the logistic regression models. The classification error rates of the models using the different race-specific and race-neutral equations for the ppFEV1 are listed for the total cohort and also for the Black and White individuals individually. The randomForest (v4.6-14) and rfPermute (v2.1.81) packages were used to obtain the classification error rates, mean decrease in accuracy, and P values. The default settings were used with ntree and nrep set to 500. AGH = age, gender, and height; AGHR = age, gender, height, and race; AUC = area under the curve; AIC = Akaike information criterion; cg419 = COPDGene data set of 419 healthy individuals; GLI = Global Lung Initiative; nh3700 = National Health and Nutrition Examination Survey data set of 3,700 healthy individuals; ppFEV1 = percent predicted FEV1; ROC = receiver-operating characteristic.
Figure 3
Figure 3
A, ROC curves of dyspnea in COPDGene PI participants who smoked as predicted by ppFEV1. Each colored line corresponds to a ROC curve using ppFEV1 values derived from the listed race-specific and race-neutral model equations. B, Sensitivity, specificity, and AUC of the ROC curve of the ppFEV1 to predict dyspnea (ie, mMRC score > 1). C, AIC from the multivariable logistic regression models of dyspnea (ie, mMRC score > 1), with the following covariates: FEV1/FVC ratio, smoking history (pack-y), scanner maker, smoking status, gender, and the ppFEV1. D, Classification error rates are presented from supervised random forest models of dyspnea (ie, mMRC score > 1), which were generated using the same covariates as the logistic regression models, for the total COPDGene PI cohort, and for White and Black participants individually. AGH = age, gender, and height; AGHR = age, gender, height, and race; AUC = area under the curve; AIC = Akaike information criterion; COPDGene PI = COPDGene phase I; cg419 = COPDGene data set of 419 healthy individuals; GLI = Global Lung Initiative; mMRC = modified Medical Research Council; nh3700 = National Health and Nutrition Examination Survey data set of 3,700 healthy individuals; ppFEV1 = percent predicted FEV1; ROC = receiver-operating characteristic.

Comment in

Similar articles

Cited by

References

    1. Hankinson J.L., Odencrantz J.R., Fedan K.B. Spirometric reference values from a sample of the general US population. Am J Respir Crit Care Med. 1999;159(1):179–187. - PubMed
    1. Quanjer P.H., Stanojevic S., Cole T.J., et al. Multi-ethnic reference values for spirometry for the 3-95-yr age range: the Global Lung Function 2012 equations. Eur Respir J. 2012;40(6):1324–1343. - PMC - PubMed
    1. Anderson M.A., Malhotra A., Non A.L. Could routine race-adjustment of spirometers exacerbate racial disparities in COVID-19 recovery? Lancet Respir Med. 2021;9(2):124–125. - PMC - PubMed
    1. Bhakta N.R., Kaminsky D.A., Bime C., et al. Addressing race in pulmonary function testing by aligning intent and evidence with practice and perception. Chest. 2022;161(1):288–297. - PMC - PubMed
    1. Braun L. University of Minnesota Press; Minneapolis, MN: 2014. Breathing Race into the Machine: The Surprising Career of the Spirometer from Plantation to Genetics.

Publication types