. 2023 Nov;165(5):1219-1232.
doi: 10.1053/j.gastro.2023.06.037. Epub 2023 Jul 26.

CLDN18.2 BiTE Engages Effector and Regulatory T Cells for Antitumor Immune Response in Preclinical Models of Pancreatic Cancer

Affiliations

CLDN18.2 BiTE Engages Effector and Regulatory T Cells for Antitumor Immune Response in Preclinical Models of Pancreatic Cancer

Yao Xu et al. Gastroenterology. 2023 Nov.

Abstract

Background & aims: BiTE (bispecific T-cell engager) immune therapy has demonstrated clinical activity in multiple tumor indications, but its influence in the tumor microenvironment remains unclear. CLDN18.2 is overexpressed in solid tumors including gastric cancer (GC) and pancreatic ductal adenocarcinoma (PDAC), both of which are characterized by the presence of immunosuppressive cells, including regulatory T cells (Tregs) and few effector T cells (Teffs).

Methods: We evaluated the activity of AMG 910, a CLDN18.2-targeted half-life extended (HLE) BiTE molecule, in GC and PDAC preclinical models and cocultured Tregs and Teffs in the presence of CLDN18.2-HLE-BiTE.

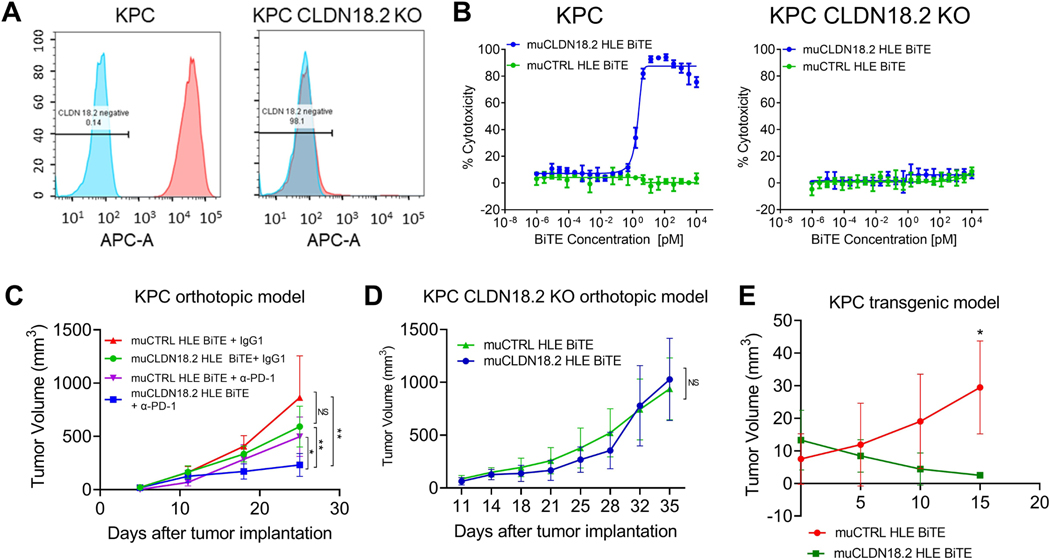
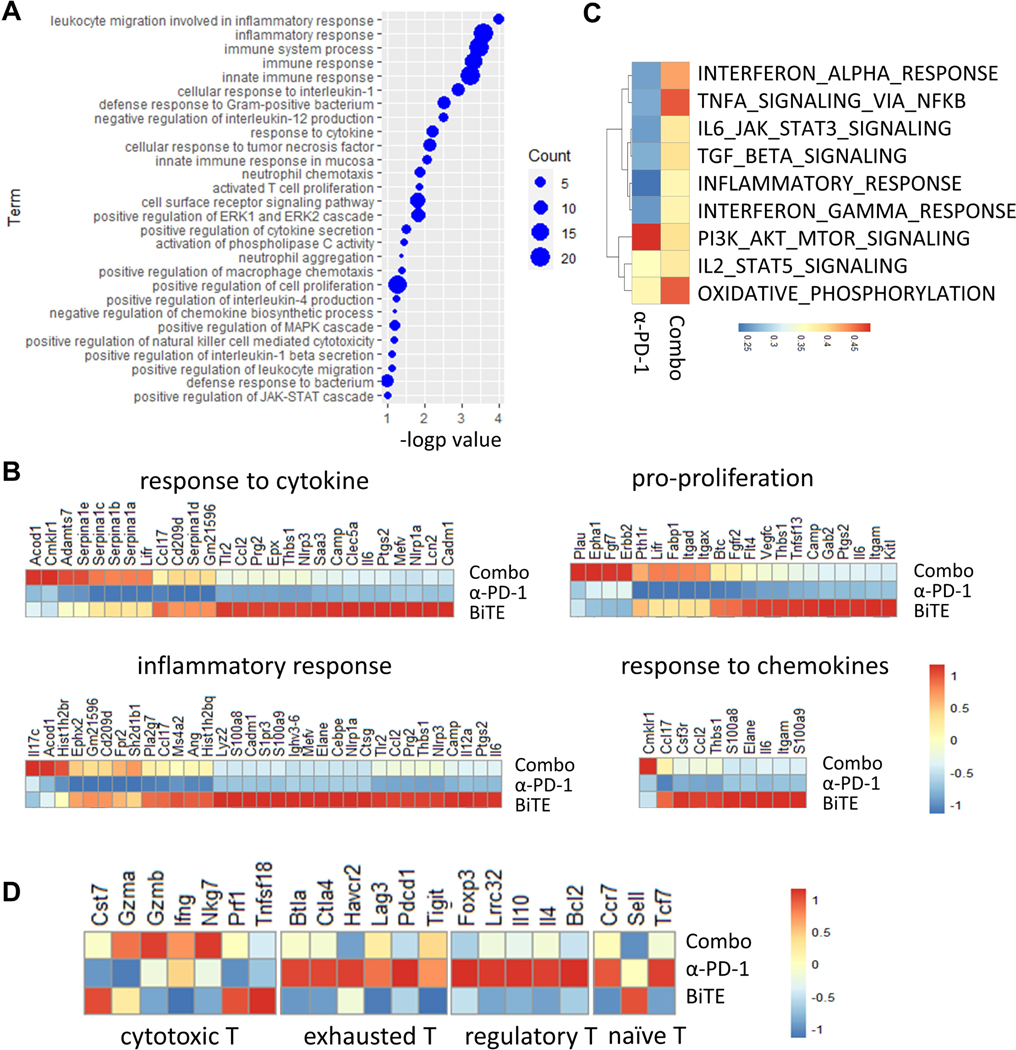
Results: AMG 910 induced potent, specific cytotoxicity in GC and PDAC cell lines. In GSU and SNU-620 GC xenograft models, AMG 910 engaged human CD3+ T cells with tumor cells, resulting in significant antitumor activity. AMG 910 monotherapy, in combination with a programmed death-1 (PD-1) inhibitor, suppressed tumor growth and enhanced survival in an orthotopic Panc4.14 PDAC model. Moreover, Treg infusion enhanced the antitumor efficacy of AMG 910 in the Panc4.14 model. In syngeneic KPC models of PDAC, treatment with a mouse surrogate CLDN18.2-HLE-BiTE (muCLDN18.2-HLE-BiTE) or the combination with an anti-PD-1 antibody significantly inhibited tumor growth. Tregs isolated from mice bearing KPC tumors that were treated with muCLDN18.2-HLE-BiTE showed decreased T cell suppressive activity and enhanced Teff cytotoxic activity, associated with increased production of type I cytokines and expression of Teff gene signatures.

Conclusions: Our data suggest that BiTE molecule treatment converts Treg function from immunosuppressive to immune enhancing, leading to antitumor activity in immunologically "cold" tumors.

Keywords: Bispecific Antibody; Immune Checkpoint Blockade; RNA Sequencing.


Conflict of interest statement

Conflict-of-interest statement:

LZ receives grant support from Bristol-Meyer Squibb, Merck, AstraZeneca, iTeos, Amgen, NovaRock, Inxmed, and Halozyme. LZ is a paid consultant/Advisory Board Member at Biosion, Alphamab, NovaRock, Ambrx, Akrevia/Xilio, Datarevive, QED, Natera, Novagenesis, Snow Lake Capitals, Tempus, Amberstone Biosciences, Pfizer, Tavotek Lab, ClinicalTrial Options, LLC, and Mingruizhiyao. LZ holds shares at Alphamab, Cellaration, Amberstone Biosciences, and Mingruizhiyao. AH, FL, JW, MF, SS and JMB are employees of and hold stock in Amgen, Inc. There are none to declare by all other authors.

Figures

Fig. 1.
Fig. 1.. AMG 910 showed cytotoxicity to human CLDN18.2-expressing cancer cells in vitro and in vivo.
(A) Structure of AMG 910 and huCTRL HLE BiTE. (B) Panc4.14 PDAC cells expressing CLDN18.2(left) or with CLDN18.2 knocked out by CRISPR(CLDN18.2KO; right) were cocultured with human T cells at a 10:1 E:T cell ratio with a concentration range of AMG 910. After 48h incubation, cell viability was assessed by luminescent readout. (C) Panc4.14 cells or Panc4.14-CLDN18.2 KO cells were stained with an anti-human CLDN18.2 monoclonal antibody (mAb) or an isotype control mAb and detected with BV421 labeled secondary antibody by flow cytometry. (D) PA-TU-8988S PDAC cells were incubated with human PBMCs at an E:T cell ratio of 10:1 and a concentration range of AMG 910. After 72h, cell viability(left) and T-cell activation(middle, right) were assessed by flow cytometry. Dose-response curves with four different PBMC donors are shown.
Fig. 2.
Fig. 2.. AMG 910 in combination with anti-PD-1 treatment improves the outcomes of a human PDAC mouse model.
Tumor cells were orthotopically implanted into NSG mice and tumors were allowed to form. (A,B) NSG mice were orthotopically implanted with Panc4.14-luc tumor cells(A) or Panc4.14-luc CLDN18.2KO tumor cells(B) and engrafted with human pan T cells on Day 11,18 and 25. Tumor growth curves of mice that received AMG 910 or control are shown (n=6/group). (C) NSG mice were orthotopically implanted with Panc4.14-luc tumor cells and engrafted with human pan T cells intravenously on Days 11 and 18. Tumor growth curves of mice that received AMG 910 monotherapy or AMG 910 plus α-PD-1 are shown(n= 5 or 6/group). Mean tumor volumes±SEM are shown. The asterisks denote statistically significant differences between groups as calculated by two-way ANOVA with Geisser-Greenhouse’s correction. (D) Survival of mice from the two-weekly-dose experiment with the Panc4.14-luc orthotopic tumors as described in Figure S4A (n=11 or 12/group) was monitored until Day 80, shown by Kaplan-Meier curves, and compared by Log-Rank test. Numbers at risk indicated. ***=p<0.001;**=p<0.01;*=p<0.05;NS, not significant.
Fig. 3.
Fig. 3.. The muCLDN18.2-HLE-BiTE exhibits specific in vitro cytotoxicity and in vivo antitumor activity against CLDN18.2-expressing mouse PDAC cells.
(A) Expression of mouse CLDN18.2 on the surface of KPC cells with wild-type CLDN18.2(left) or KPC cells with CLDN18.2KO(right) was measured by flow cytometry. Anti-CLDN18.2 antibody staining(red) and staining of an irrelevant negative control antibody(blue) were shown. (B) Cocultures of CD8+T cells and KPC cells(left) or KPC CLDN18.2KO cells(right) were incubated with a concentration range of muCLDN18.2-BiTE-HLE for 48 h and cytotoxicity was measured with a luminescence assay. (C,D) Mice were orthotopically implanted with KPC WT tumor cells(C) or KPC CLDN18.2KO cells(D) and treated as indicated weekly by intraperitoneal injection. The tumor volume of mice was measured by ultrasound. Mean tumor volumes±SEM are shown. The asterisks denote statistically significant differences as calculated by two-way ANOVA with Geisser-Greenhouse’s correction. (E) KPC transgenic mice were treated as indicated on D4 and D7. The tumor volume of mice (N=3) was measured by ultrasound. Mean tumor volumes+SEM are shown and compared between two groups as indicated by t-test. **=p<0.01;*=p<0.05; NS, not significant.
Fig. 4.
Fig. 4.. Intratumoral T cell compositions in the KPC transgenic, orthotropic, and liver metastasis models.
(A–J) Flow cytometry was performed on isolated tumor-infiltrating immune cells from dissected tumors on Day 15(Fig.S5D). The data in A showed the percentages of CD3+T, CD4+T and CD8+T cell in KPC orthotopic model and KPC transgenic model. Data in B,C,D were from the KPC transgenic model, E, F, G were from the KPC orthotopic model and H,I.J, were from the liver metastasis model(n=3/group). The number of isolated tumor-infiltrating immune cells was normalized to the tumor weight, and the following were analyzed: number of CD3+, CD4+ and CD8+T cells among CD45+ cells(B,E,H), number of CD25+, CD69+, CD137+, PD1+ and LAG3+ T cells among CD45+CD3+CD4+T cells(C,F,I) or among CD45+CD3+CD8+T cells(D,G,J). Data represent the mean±SEM from one representative experiment of 3 mice per treatment group, and isolated T cells from mice from the same treatment group were pooled and measured in triplicate. ***=p<0.001;**=p<0.01;*=p<0.05, by one-way ANOVA.
Fig. 5.
Fig. 5.. Proliferation and cytokine production of mouse CD8+ T cells cocultured with mouse Tregs purified from TILs.
(A) Study schema of the KPC liver metastasis model used to evaluate muCLDN18.2-HLE-BiTE pharmacodynamic effects. (B) CFSE-labeled mouse CD8+T cells were cocultured at a 1:1 ratio with Treg cells that were purified from TILs of mice treated with muCLDN18.2-HLE-BiTE, α-PD-1 or the combination for 72h. CD3/CD28 Dynabeads were used to activate the CD8+T cells. The proliferation of CFSE-labeled CD8+T cells was measured by flow cytometry. (C) Cytokine production in supernatants from the cocultures of mouse CD8+T cells and Tregs described above was measured with an ELISA kit. Data are shown as the mean±SEM from three independent experiments. P values determined by unpaired t-test. ***=p<0.001;**=p<0.01;*=p<0.05;NS, not significant.
Fig. 6.
Fig. 6.. In vitro cytotoxicity and in vivo anti-tumor efficacy of CD8+ T cells were enhanced by Treg engagement.
(A,B) CD8+T cells(A) or Tregs(B) isolated from the spleens of healthy mice were mixed with KPC cells at a ratio of 10:1 and coincubated with a concentration range of muCLDN18.2-HLE-BiTE for 48h. Cytotoxicity was measured with a luminescence assay. (C) CD8+ T cells isolated from healthy KPC mice and Treg cells isolated from KPC metastatic liver lesions were cocultured at different ratios (1:2, 1:1 or 2:1) and incubated with KPC cells in the presence of muCLDN18.2-HLE-BiTE for 48h. Cytotoxicity was measured with a CytoTox-Fluor assay. (D) Tregs that were isolated from KPC metastatic liver lesions were cocultured with KPC cells at different dilutions mimicking the different ratios of Treg/CD8 in (C) in the presence of muCLDN18.2-HLE-BiTE for 48h. (E,F) Cytokine production in the supernatant from the cocultures as indicated in (C) was quantitated by ELISA. The mean±SEM from three independent experiments was shown. P values were determined by unpaired t-test. (G) CD8+T cells and Tregs isolated from PBMCs of healthy donors were cocultured at different ratios (1:2, 1:1 or 2:1) and incubated with Panc4.14 cells in the presence of AMG 910 for 48h. Cytotoxicity was measured with a CytoTox-Fluor assay. (H) NSG mice were orthotopically implanted with Panc4.14-luc tumor cells and engrafted with CD8+T cells and CD4+CD25+CD127highT cells, with CD4+CD25+CD127lowTregs(+Treg), or without Tregs(-Treg) administrated intravenously weekly on Days 11,18. The tumor growth curve of mice that received AMG 910 monotherapy or control treatment was shown as radiance. Mean tumor volumes±SEM are shown. The asterisks denote statistically significant differences between groups as calculated by two-way ANOVA with Geisser-Greenhouse’s correction. **=p<0.01;*=p<0.05;NS, not significant.
Fig. 7.
Fig. 7.. RNA-seq of purified Tregs from the KPC liver metastasis model.
(A) A total of 809 genes with normalized gene expression >1.5-fold for Tregs isolated from mice of the KPC liver metastasis model that were treated with the combination of muCLDN18.2-HLE-BiTE and α-PD-1(Combo) compared to Tregs from mice treated with α-PD-1 alone were analyzed by DAVID functional annotation. Gene ontology terms corresponding to biological processes related to the immune response were extracted. Those significantly associated(p ≤ 0.05) with the gene list are plotted with the numbers of genes(Count) for each term along with the -logP-value for each term. (B) Genes that are enriched by GO analysis in (A) were classified into four groups and shown by heatmap. (C) GSVA analysis of the gene expression data of the Combo treatment and PD-1 monotherapy. (D) Specific genes for naive T cells, Tregs, exhausted T cells and cytotoxic T cells were selected, and gene expression was shown in a heatmap.

References

    1. Ho WJ,Jaffee EM,Zheng L.The tumour microenvironment in pancreatic cancer - clinical challenges and opportunities. Nat Rev Clin Oncol 2020;17:527–540 - PMC - PubMed
    1. Kono K,Nakajima S,Mimura K.Current status of immune checkpoint inhibitors for gastric cancer. Gastric Cancer 2020;23:565–578. - PubMed
    1. Baxter MA,Middleton F,Cagney HP,et al..Resistance to immune checkpoint inhibitors in advanced gastro-oesophageal cancers. British Journal of Cancer 2021;125:1068–1079. - PMC - PubMed
    1. Wei AH,Ribera JM,Larson RA,et al..Biomarkers associated with blinatumomab outcomes in acute lymphoblastic leukemia. Leukemia 2021;35:2220–2231. - PMC - PubMed
    1. Kischel R,Hausmann S,Baeuerle P,et al..Abstract #3252: Effector memory T cells make a major contribution to redirected target cell lysis by T cell-engaging BiTE antibody MT110. Cancer Research 2009;69:3252.

Publication types