. 2023 Nov 24;72(12):2307-2320.
doi: 10.1136/gutjnl-2022-329147.

Targeting MS4A4A on tumour-associated macrophages restores CD8+ T-cell-mediated antitumour immunity

Affiliations

Targeting MS4A4A on tumour-associated macrophages restores CD8+ T-cell-mediated antitumour immunity

Yongsheng Li et al. Gut. .

Abstract

Objective: Checkpoint immunotherapy unleashes T-cell control of tumours but is suppressed by immunosuppressive myeloid cells. The transmembrane protein MS4A4A is selectively highly expressed in tumour-associated macrophages (TAMs). Here, we aimed to reveal the role of MS4A4A+ TAMs in regulating the immune escape of tumour cells and to develop novel therapeutic strategies targeting TAMs to enhance the efficacy of immune checkpoint inhibitor (ICI) in colorectal cancer.

Design: The inhibitory effect of MS4A4A blockade alone or combined with ICI treatment on tumour growth was assessed using murine subcutaneous tumour or orthotopic transplanted models. The effect of MS4A4A blockade on the tumour immune microenvironment was assessed by flow cytometry and mass cytometry. RNA sequencing and western blot analysis were used to further explore the molecular mechanism by which MS4A4A promoted macrophages M2 polarisation.

Results: MS4A4A is selectively expressed by TAMs in different types of tumours, and was associated with adverse clinical outcome in patients with cancer. In vivo inhibition of MS4A4A and anti-MS4A4A monoclonal antibody treatment both curb tumour growth and improve the effect of ICI therapy. MS4A4A blockade treatment reshaped the tumour immune microenvironment, resulting in reducing the infiltration of M2-TAMs and exhausted T cells, and increasing the infiltration of effector CD8+ T cells. Anti-MS4A4A plus anti-programmed cell death protein 1 (PD-1) therapy remained effective in large, treatment-resistant tumours and could induce complete regression when further combined with radiotherapy. Mechanistically, MS4A4A promoted M2 polarisation of macrophages by activating PI3K/AKT pathway and JAK/STAT6 pathway.

Conclusion: Targeting MS4A4A could enhance the ICI efficacy and represent a new anticancer immunotherapy.

Keywords: T lymphocytes; colorectal cancer; immunotherapy; macrophages.


Conflict of interest statement

Competing interests: None declared.

Figures
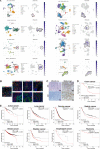
Figure 1
Figure 1
MS4A4A was highly expressed in tumour-associated macrophages and associated with a poor prognosis in patients with cancer. (A) Analysis of MS4A4A gene expression in various tumours using the pan-cancer single-cell sequencing data set from the TISCH database (http://tisch.comp-genomics.org/). (B) Representative images of immunofluorescence costaining for MS4A4A (red) with cell-type markers (green) in clinical human CRC tissue specimens. (C) IHC staining with MS4A4A-specific antibodies to detect MS4A4A+ cells infiltration in a human CRC tissue microarray (n=81). (D) Overall survival curves based on MS4A4A+ cells infiltration level using the Kaplan-Meier method. (E) The Kaplan-Meier Plotter online tool (https://kmplot.com/analysis/) was used to analyse the association between MS4A4A mRNA expression levels and overall survival in various tumour (including colon cancer, lung cancer, ovarian cancer, gastric cancer, breast cancer, bladder cancer, oesophageal cancer and thymoma). CRC, colorectal cancer; IHC, immunohistochemistry; mRNA, messenger RNA; TISCH, Tumour Immune Single-cell Hub.
Figure 2
Figure 2
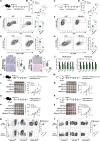
MS4A4A promotes M2 macrophage polarisation and induces CD8+ T-cell dysfunction. (A) BMDMs were transfected with Ms4a4a-specific siRNA or negative control siRNA and polarised into the M2-phenotype using IL-4 (20 ng/mL) and IL-13 (20 ng/mL). The interference efficiency of Ms4a4a and the expression of M2 markers (Fizz1, Mgl2, Arg1 and Tgfb1) were measured by qRT-PCR. (B) An MS4A4A-overexpressing cell line was constructed using the human monocyte cell line THP-1, and then the engineered THP-1 cells were induced to differentiate into M0 macrophages with PMA (50 ng/mL). IL-4 (20 ng/mL) was used to stimulate M0 macrophages to polarise into the M2-phenotype, and the expression levels of MS4A4A and M2 markers (CD163, VEGFA, IL-10, ARG1 and TGFB1) were measured by qRT-PCR. (C–G) Study of the effect of MS4A4A expression on macrophage polarisation in vitro. (C) Bone marrow cells from C57BL/6 mice were extracted in vitro and induced into BMDMs using L929 cells conditioned medium (L929-CM). The BMDMs were then transfected with MS4A4A-specific siRNA or control siRNA on day 6. After 48 hours, the macrophages were cultured in MC38 cells conditioned medium (MC38-CM) or CT26 cells conditioned medium (CT26-CM) for 24 hours. (D–E) The expression levels of Ms4a4a and Arg1 were measured by qRT-PCR (n=3). (F–G) The proportion of M2 macrophages in each group of macrophages was detected by flow cytometry (n=3). (H–I) In vivo confirmation of the effect of MS4A4A on the M2 polarisation function of TAMs. (H) The BMDMs with MS4A4A differential expression (siNC-CD45.2 and siMs4a4a-CD45.1) were labelled with CFSE, and then the two types of cells were mixed at a ratio of 1:1. Some of these cells were cultured in vitro, and others were transferred into tumour-bearing mice. After 3 days, FACS was performed on the above donor cells. (I) FACS analysis of CD206 and IL-10 expression in two types of donor cells (siNC-CD45.2 and siMs4a4a-CD45.1) in vitro and in vivo (n=5). (J–K) Study of the effect of macrophage MS4A4A expression on CD8+ T-cell function in vitro. (J) Experimental design. (K) FACS analysis of Ki67 expression on the indicated CD8+ T cells (n=3). Results are represented as mean±SEM. BMDMs, bone marrow-derived macrophages; CFSE, carboxyfluorescein succinimidyl ester; CM, conditioned medium; FACS, flow cytometry; FSC, forward scatter; IL, interleukin; LV, lentiviral vectors; mRNA, messenger RNA; PMA, phorbol 12-myristate 13-acetate; qRT-PCR, quantitative real-time PCR; siMs4a4a, MS4A4A-specific siRNA; siNC, control siRNA; siRNA, small interfering RNA; TAMs, tumour-associated macrophages.
Figure 3
Figure 3
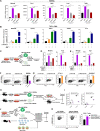
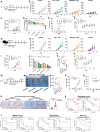
In vivo inhibition of macrophage MS4A4A delays CRC progression. (A–J) Tumour growth in mice injected subcutaneously (s.c.) with the MC38 or CT26 cell line and treated with siRNA (siMs4a4a) in vivo (n=5/group). (A) Schematic showing the treatment plan. (B) Tumour growth in MC38 tumour-bearing C57BL/6 mice. (C) Schematic showing the treatment plan. (D) Tumour growth in CT26 tumour-bearing BALB/c mice. (E–H) FACS analysis of specific molecule expression on tumour-infiltrating CD8+ T cells and TAMs from CT26 tumour-bearing BALB/c mice. (I) IHC staining with CD206-specific antibodies to detect CD206+ macrophage infiltration in subcutaneously transplanted MC38 or CT26 tumours. The number of CD206-positive cells per high-power field (HPF) was counted in subcutaneous tumour sections from each group of mice. Five random HPFs were selected for analysis on each slide. (J) Relative expression of the indicated genes determined by qRT-PCR. (K–L) C57BL/6 mice were implanted with MC38 cells and received siNC plus PBS liposome (PL), siMs4a4a plus PL, siNC plus clodronate liposome (CL) or siMs4a4a plus CL treatment (n=5/group). (K) Schematic showing the treatment plan. (L) Left: Representative images of tumours in mice from different treatment groups. Right: Tumour growth. (M–N) BALB/c mice were implanted with CT26 cells and received siNC plus PL, siMs4a4a plus PL, siNC plus CL or siMs4a4a plus CL treatment (n=5/group). (M) Schematic showing the treatment plan. (N) Left: Representative images of tumours in mice from different treatment groups. Right: Tumour growth. (O–Q) C57BL/6 mice were implanted with MC38 cells and received siNC plus IgG antibody, siMs4a4a plus IgG antibody, siNC plus anti-CD8 antibody or siMs4a4a plus anti-CD8 antibody treatment (n=5/group). (O) Schematic showing the treatment plan. (P) Left: Representative images of tumours in mice from different treatment groups. Right: Tumour growth. (Q) FACS analysis of the depletion efficiency for CD8+ T-cells in MC38 tumours. (R–T) BALB/c mice were implanted with CT26 cells and received siNC plus IgG antibody, siMs4a4a plus IgG antibody, siNC plus anti-CD8 antibody or siMs4a4a plus anti-CD8 antibody treatment (n=5/group). (R) Schematic showing the treatment plan. (S) Left: Representative images of tumours in mice from different treatment groups. Right: Tumour growth. (T) FACS analysis of the depletion efficiency for CD8+ T-cells in CT26 tumours. CRC, colorectal cancer; FACS, flow cytometry; FSC, forward scatter; IHC, immunohistochemistry; i.p., intraperitoneal injection; i.t., intratumoral injection; mAb, monoclonal antibody; PBS, phosphate buffer solution; qRT-PCR, quantitative real-time PCR; siMs4a4a, MS4A4A-specific siRNA; siNC, control siRNA; siRNA, small interfering RNA; TAMs, tumour-associated macrophages;
Figure 4
Figure 4
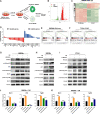
MS4A4A promotes M2 macrophage polarisation by activating the PI3K/AKT and JAK/STAT6 signalling pathway. (A) Bone marrow cells from C57BL/6 mice were induced to differentiate into BMDMs using L929-CM and transfected with an MS4A4A-overexpression plasmid or control plasmid on day 6. After transfection for 48 hours, the cells were stimulated with MC38-CM for 24 hours to induce TAMs and collected for RNA-seq analysis. (B) Volcano plot of differentially and non-differentially expressed genes revealed by RNA-seq analyses comparing Ms4a4a-overexpressing TAMs and control TAMs. (C) Heatmap showing the differential expression of genes in Ms4a4a-overexpressing TAMs versus control TAMs. (D) Gene expression analyses of M1 and M2 macrophage-related genes in Ms4a4a-overexpressing TAMs relative to that in control TAMs. (E) GSEA of RNA-seq data revealed that the JAK/STAT signalling pathway and PI3K/AKT/mTOR signalling pathway were significantly enriched in the Ms4a4a-overexpressing TAM group. (F) GSEA confirmed that the JAK/STAT and PI3K/AKT/mTOR signalling pathway were significantly enriched in patients with CRC with high MS4A4A expression in the CRC data from TCGA. (G–I) Macrophages with different MS4A4A expression levels were stimulated using MC38-CM, followed by western blotting to detect the expression of Ms4a4a, p-AKT (Ser473), AKT, p-STAT6 (Tyr641), STAT6, p-STAT3 (Tyr705) and STAT3. (J) MS4A4A-overexpressing BMDMs and control BMDMs were pretreated with or without the PI3K inhibitor BEZ235 (200 nM) and then stimulated with MC38-CM for 12 hours. qRT-PCR was performed to detect the expression of M2 markers (Mrc1, Il10 and Tgfb1). (K) MS4A4A-overexpressing BMDMs and control BMDMs were pretreated with or without the STAT6 inhibitor AS1517499 (250 nM) and then stimulated with MC38-CM for 12 hours. qRT-PCR was performed to detect the expression of M2 markers (Mrc1, Il10 and Tgfb1). BMDMs, bone marrow-derived macrophages; CM, conditioned medium; COAD, colon adenocarcinoma; CRC, colorectal cancer; GSEA, gene set enrichment analysis; NC, negative control; OE, overexpression; qRT-PCR, quantitative real-time PCR; RNA-seq, RNA sequencing; TAMs, tumour-associated macrophages; TCGA, The Cancer Genome Atlas.
Figure 5
Figure 5
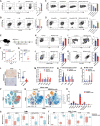
Anti-MS4A4A mAb treatment delays CRC progression. (A–B) Mouse bone marrow-derived macrophages were treated with MC38-CM or MC38-CM+anti-MS4A4A mAb (10 µg/mL). FACS analyses of iNOS and CD206 expression by the macrophages (n=3). (C–D) Mouse bone marrow-derived macrophages (M) were cocultured with mouse splenocytes (S) and MC38 tumour cells (T) at a 1:1:1 ratio. The cells were treated with 10 µg/mL anti-MS4A4A mAb for 2 days. FACS analyses of Ki67 and IFN-γ expression by the CD8+ T-cells (n=3). (E–O) Tumour growth in mice injected subcutaneously (s.c.) with murine MC38 colon cancer cells treated with anti-MS4A4A mAb (n=5/group) (E) Schematic showing the treatment plan. (F–G) Tumour growth. (H–K) FACS analysis of specific molecule expression on tumour-infiltrating CD8+ T-cells and TAMs from MC38 tumour-bearing mice. (L) IHC staining with CD206-specific antibodies to detect CD206+ macrophage infiltration in subcutaneously transplanted MC38 tumours. The number of CD206-positive cells per high-power field (HPF) was counted in subcutaneous tumour sections from each group of mice. Five random HPFs were selected for analysis on each slide. (M–O) Relative expression of the indicated genes determined by qRT-PCR. Data depict the mean±SEM (n=3) and are representative of three independent experiments. (P–Q) Murine CT26 colon cancer cells were transplanted subcutaneously (s.c.) into BALB/c mice and treated with an isotype control or anti-MS4A4A mAb (n=3/group). t-SNE analysis of CyTOF data for immune cells from the isotype-treated and anti-MS4A4A mAb-treated CT26 tumours. (R) Histogram showing the quantification of tumour-infiltrating immune cells. (S) CyTOF analysis to compare the differences in the expression of specific molecules in TAMs within CT26 tumours between the control antibody-treated and MS4A4A mAb-treated groups. (T) CyTOF analysis to compare the differences in the expression of specific molecules in CD8+ T-cells within CT26 tumours between the control antibody-treated and MS4A4A mAb-treated groups. CM, conditioned medium; CRC, colorectal cancer; CyTOF, mass cytometry by time of flight; FACS, flow cytometry; FSC, forward scatter; IHC, immunohistochemistry; i.p., intraperitoneal injection; mAb, monoclonal antibody; qRT-PCR, quantitative real-time PCR; TAMs, tumour-associated macrophages; t-SNE, t-distributed stochastic neighbour embedding.
Figure 6
Figure 6
Targeted MS4A4A treatment synergises with anti-PD-1 mAb treatment. (A–F) Tumour growth of CT26 tumour-bearing mice treated with an isotype control, an anti-PD-1 mAb, an anti-MS4A4A mAb or the anti-PD-1 mAb combined with the anti-MS4A4A mAb (n=5/group). (A) Schematic showing the treatment plan. (B–D) Tumour growth. (E) Survival of CT26 tumour-bearing mice. (F) Body weight of mice in each group. (G–L) Tumour growth of B16F10 tumour-bearing mice treated with an isotype control, an anti-PD-1 mAb, an anti-MS4A4A mAb or the anti-PD-1 mAb combined with the anti-MS4A4A mAb (n=5–6/group). (G) Schematic showing the treatment plan. (H–J) Tumour growth. (K) Tumour weight. (L) Body weight of mice in each group. (M–O) Mouse CT26 colon cancer cells were injected in situ into the cecum wall of mice and then treated with an isotype control, an anti-PD-1 mAb, an anti-MS4A4A mAb or the anti-PD-1 mAb combined with the anti-MS4A4A mAb (n=5/group). (M) Schematic showing the treatment plan. (N) Macroscopic appearance of orthotopic CRC tumours for each indicated treatment. (O) Tumour volume. (P) Tumour growth curves of mice rechallenged s.c. as in (E) (survivor) (n=3) with MC38 cells and age-matched tumour-naive mice (control) (n=5). (Q) Overall survival of rechallenged mice depicted with a Kaplan-Meier curve (n=3–5/group). (R) Representative images and statistical analysis of immunohistochemical staining for MS4A4A in tumour samples from patients with CRC (n=12) who underwent surgical resection or colonoscopic biopsy prior to immunotherapy. Five random high-power fields were selected for analysis on each slide. (S) Kaplan-Meier plots showing the relationships between the level of MS4A4A gene expression in tumours and the overall survival or progression-free survival of patients with cancer treated with anti-PD-L1 therapy in a cohort of patients with oesophageal cancer. (T) Kaplan-Meier plots showing the relationships between the level of MS4A4A gene expression in tumours and the overall survival or progression-free survival of patients with cancer treated with anti-PD-1 therapy in a cohort of patients with bladder cancer, patients with glioblastoma or patients with melanoma. CRC, colorectal cancer; i.p., intraperitoneal injection; mAb, monoclonal antibody; PD-1, programmed cell death protein 1; s.c., subcutaneous.
Figure 7
Figure 7
Treatment of large established CT26 tumours with the anti-MS4A4A mAb improves the therapeutic benefit of anti-PD-1 immunotherapy. (A) qRT-PCR was performed to detect the expression of MS4A4A on TAMs in tumours with different volumes. (B–F) CT26 cells (5×10⁵) were transplanted subcutaneously (s.c.) into BALB/c mice and treated with an isotype control, an anti-PD-1 mAb, an anti-MS4A4A mAb or the anti-PD-1 mAb combined with the anti-MS4A4A mAb when the tumour volume was 300–600 mm3 (n=5/group). (B) Schematic showing the treatment plan. (C) Representative images of CT26 tumours. (D and E) Tumour growth. (F) Tumour weight. (G–K) CT26 cells (5×10⁵) were transplanted s.c. into BALB/c mice and treated with an isotype control, an anti-MS4A4A mAb, anti-PD-1+ anti-MS4A4A mAbs or anti-PD-1+ anti-MS4A4A mAbs combined with RT when the tumour volume was 300–600 mm3 (n=5/group). (G) Schematic showing the treatment plan. (H and I) Tumour growth. (J) Survival of CT26 tumour-bearing mice. (K) Representative images of IHC staining for CD3 and CD8 in tumour sections and statistical analysis. The number of CD3-positive cells and CD8-positive cells per HPF was counted in subcutaneous tumour sections from each group. Five random HPFs were selected for analysis on each slide. HPF, high-power field; IHC, immunohistochemistry; IR, ionizing radiation; i.p., intraperitoneal injection; mAb, monoclonal antibody; mRNA, messenger RNA; PD-1, programmed cell death protein 1; qRT-PCR, quantitative real-time PCR; RT, radiotherapy; TAMs, tumour-associated macrophages.

Comment in

Similar articles

Cited by

References

    1. Page DB, Postow MA, Callahan MK, et al. . Immune modulation in cancer with antibodies. Annu Rev Med 2014;65:185–202. 10.1146/annurev-med-092012-112807 - DOI - PubMed
    1. Chen EX, Jonker DJ, Loree JM, et al. . Effect of combined immune checkpoint inhibition vs best supportive care alone in patients with advanced colorectal cancer: the Canadian cancer trials group CO.26 study. JAMA Oncol 2020;6:831–8. 10.1001/jamaoncol.2020.0910 - DOI - PMC - PubMed
    1. Dekker E, Tanis PJ, Vleugels JLA, et al. . Colorectal cancer. Lancet 2019;394:1467–80. 10.1016/S0140-6736(19)32319-0 - DOI - PubMed
    1. Marigo I, Zilio S, Desantis G, et al. . T cell cancer therapy requires CD40-CD40L activation of tumor necrosis factor and inducible nitric-oxide-synthase-producing dendritic cells cancer cell. Cancer Cell 2016;30:377–90. 10.1016/j.ccell.2016.08.004 - DOI - PMC - PubMed
    1. Panni RZ, Herndon JM, Zuo C, et al. . Agonism of CD11B reprograms innate immunity to sensitize pancreatic cancer to immunotherapies. Sci Transl Med 2019;11:eaau9240. 10.1126/scitranslmed.aau9240 - DOI - PMC - PubMed

Publication types

Substances