. 2023 Sep;166(6):943-959.
doi: 10.1111/jnc.15921. Epub 2023 Jul 28.

Upregulation of mesencephalic astrocyte-derived neurotrophic factor (MANF) expression offers protection against alcohol neurotoxicity

Affiliations

Upregulation of mesencephalic astrocyte-derived neurotrophic factor (MANF) expression offers protection against alcohol neurotoxicity

Wen Wen et al. J Neurochem. 2023 Sep.

Abstract

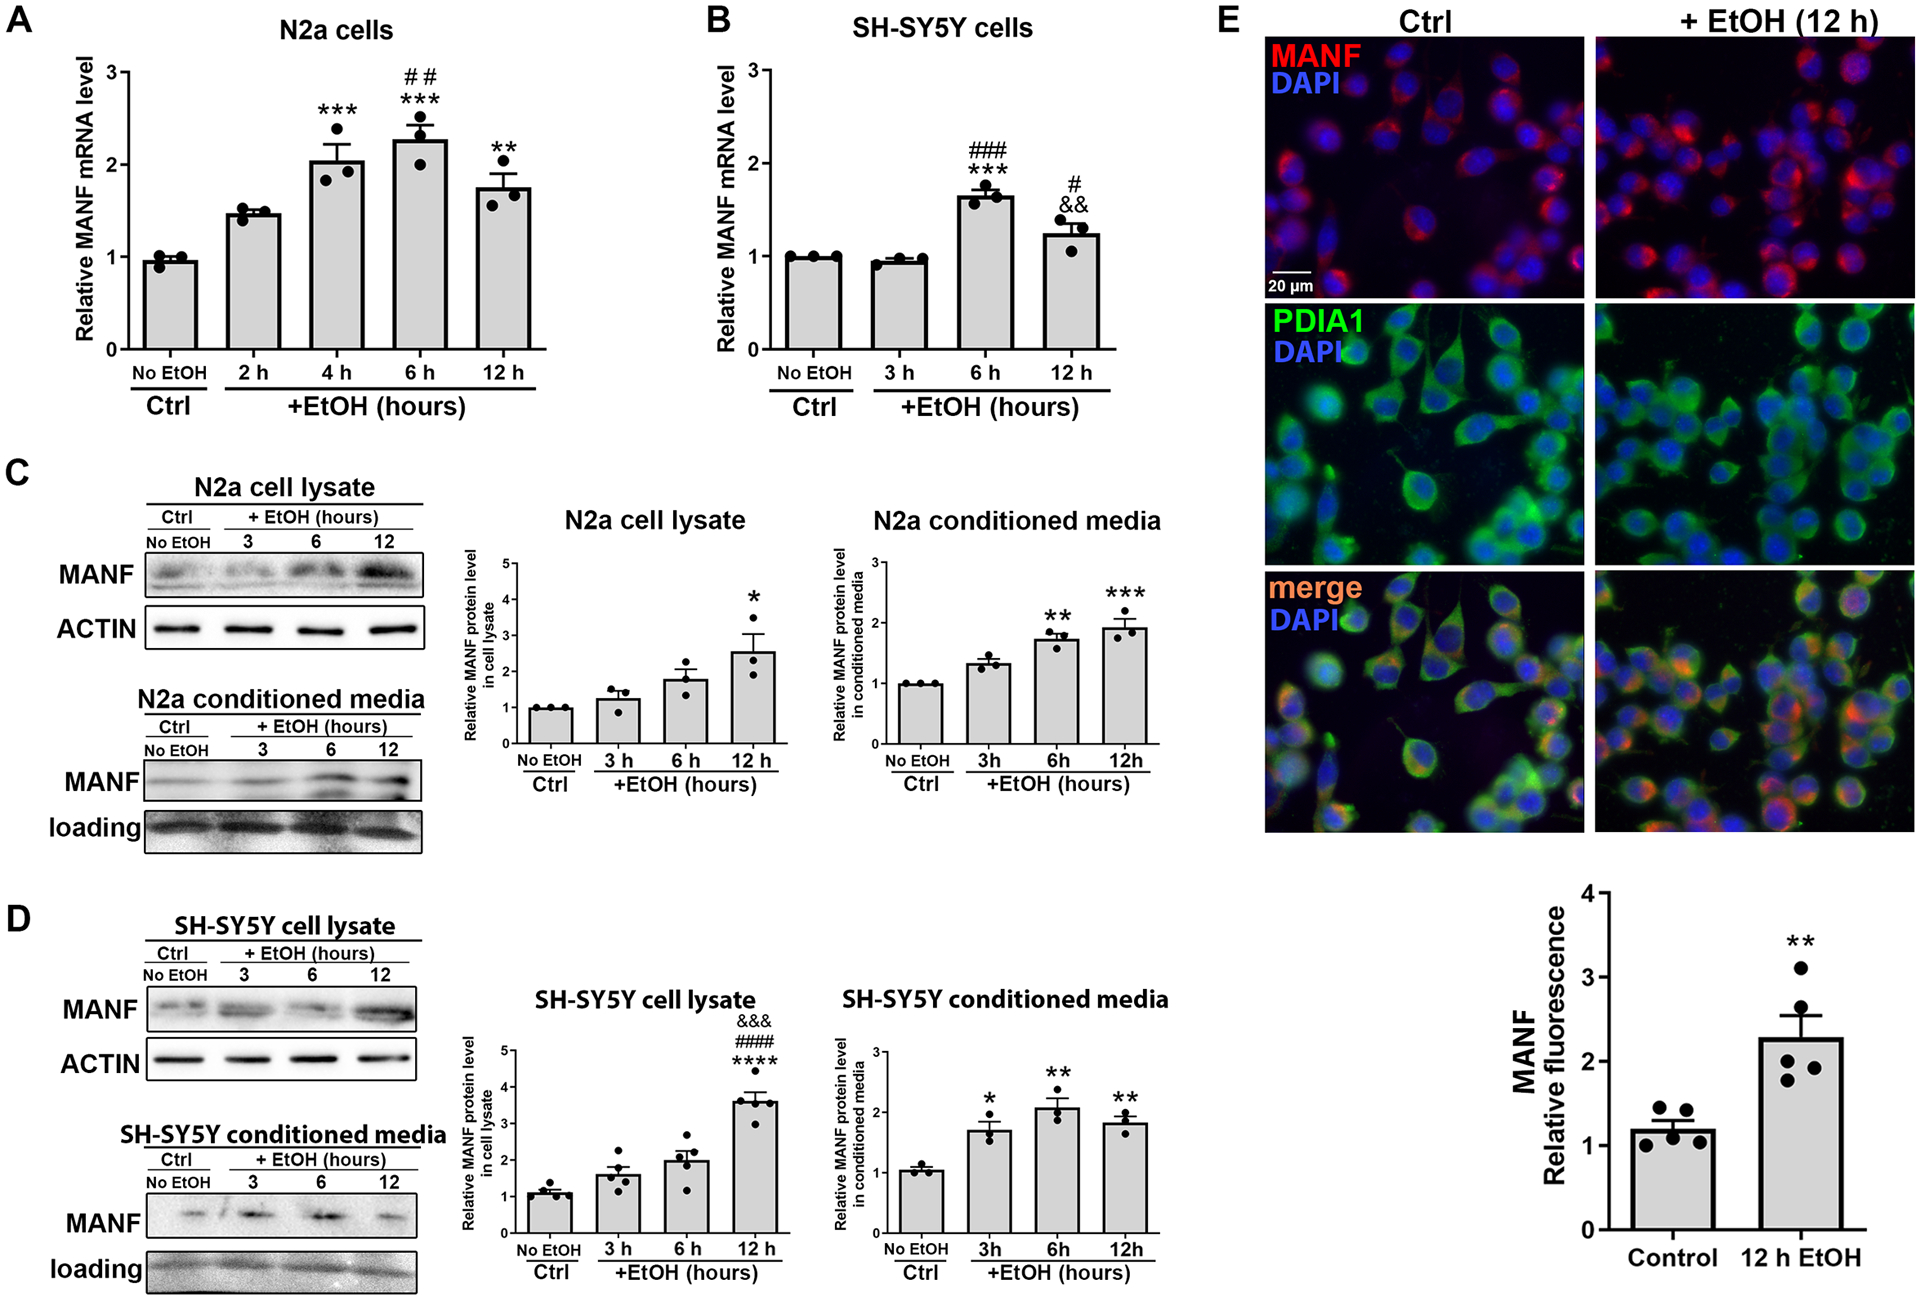
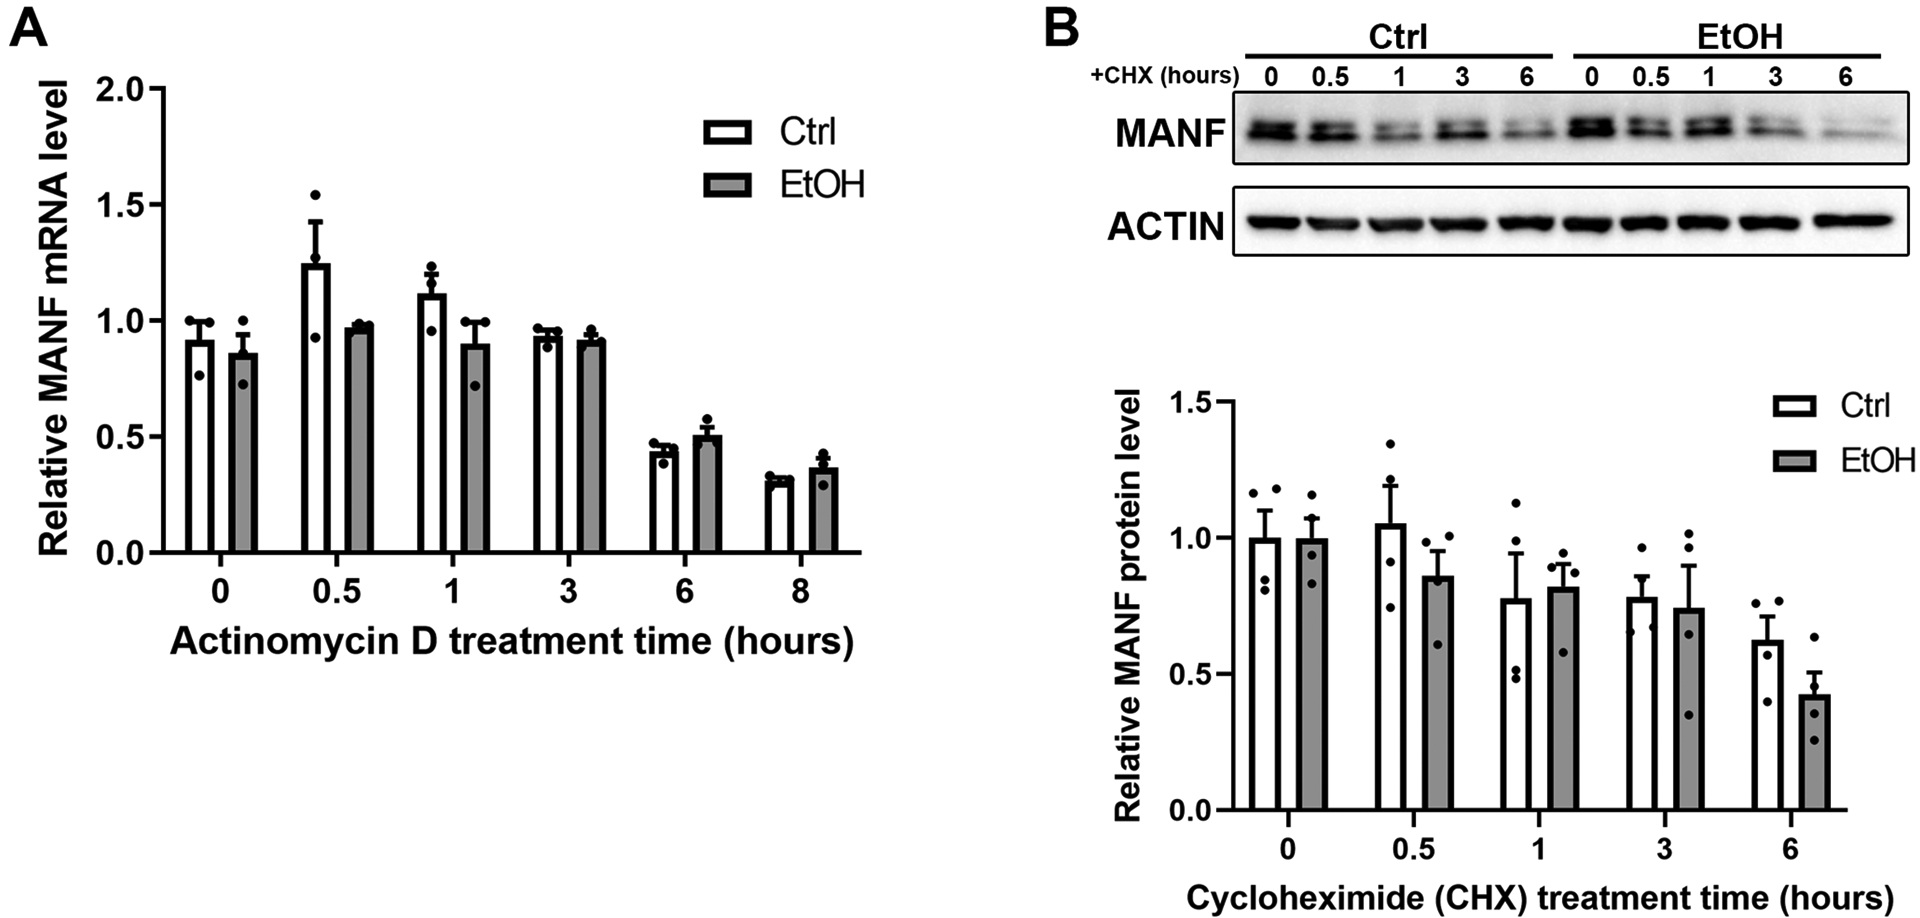
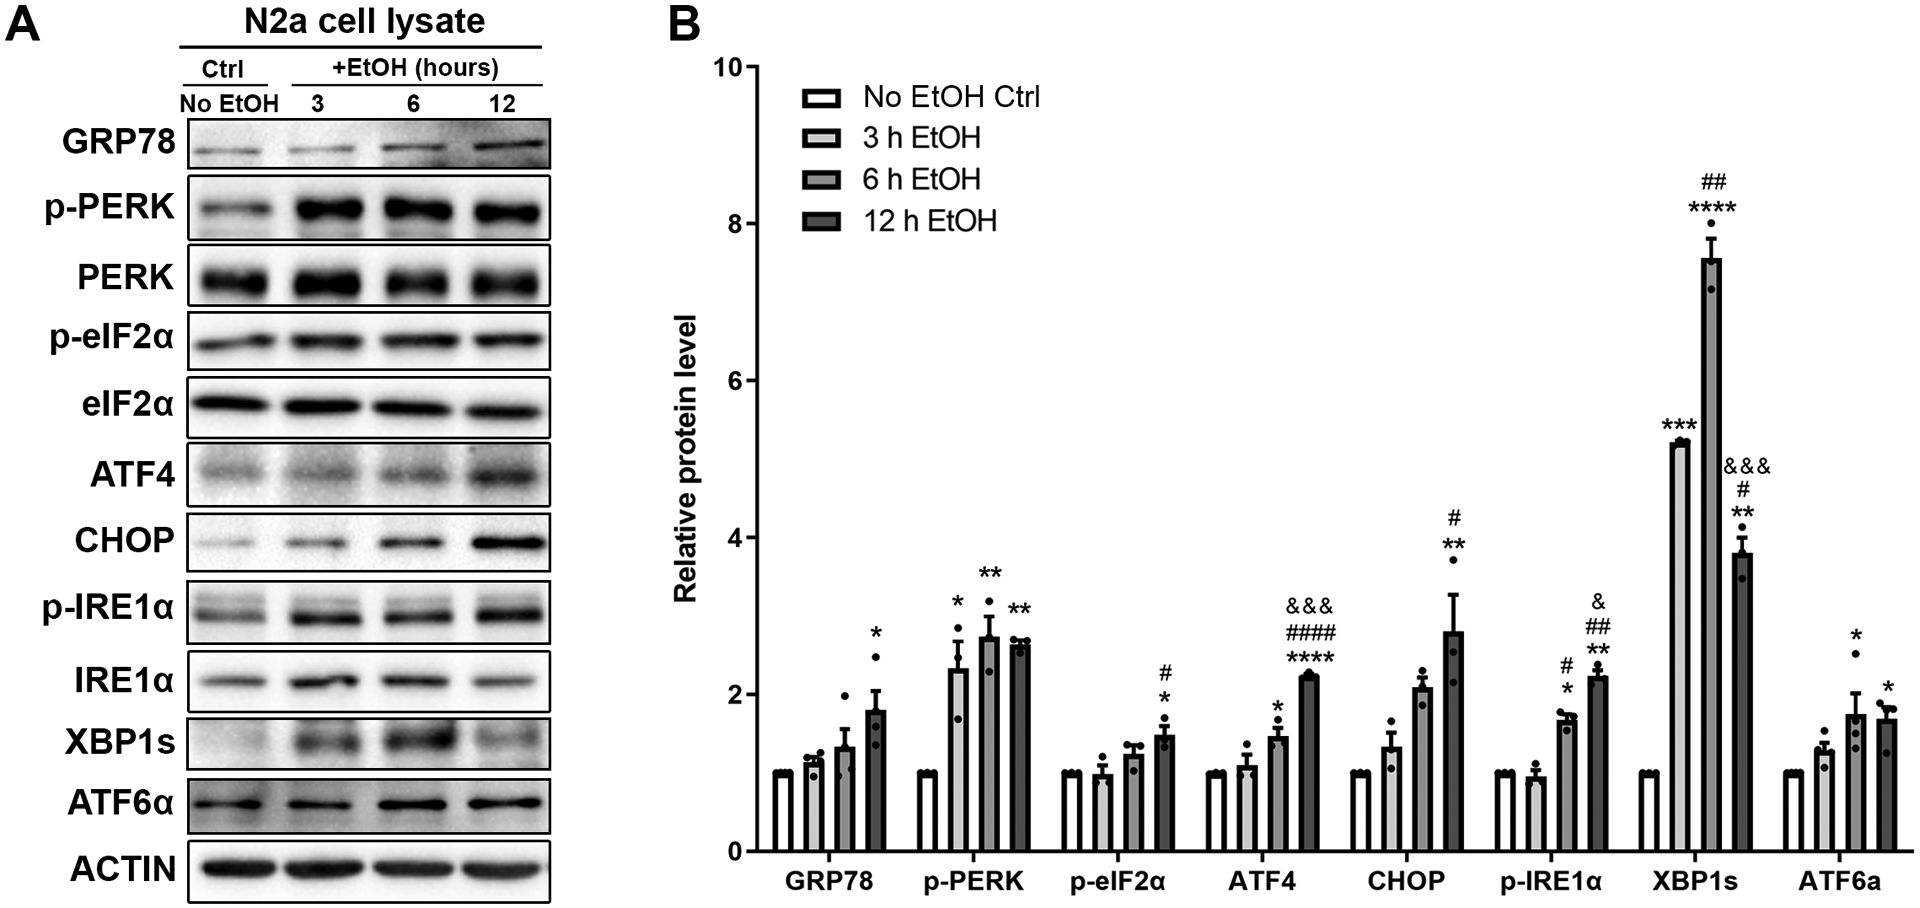
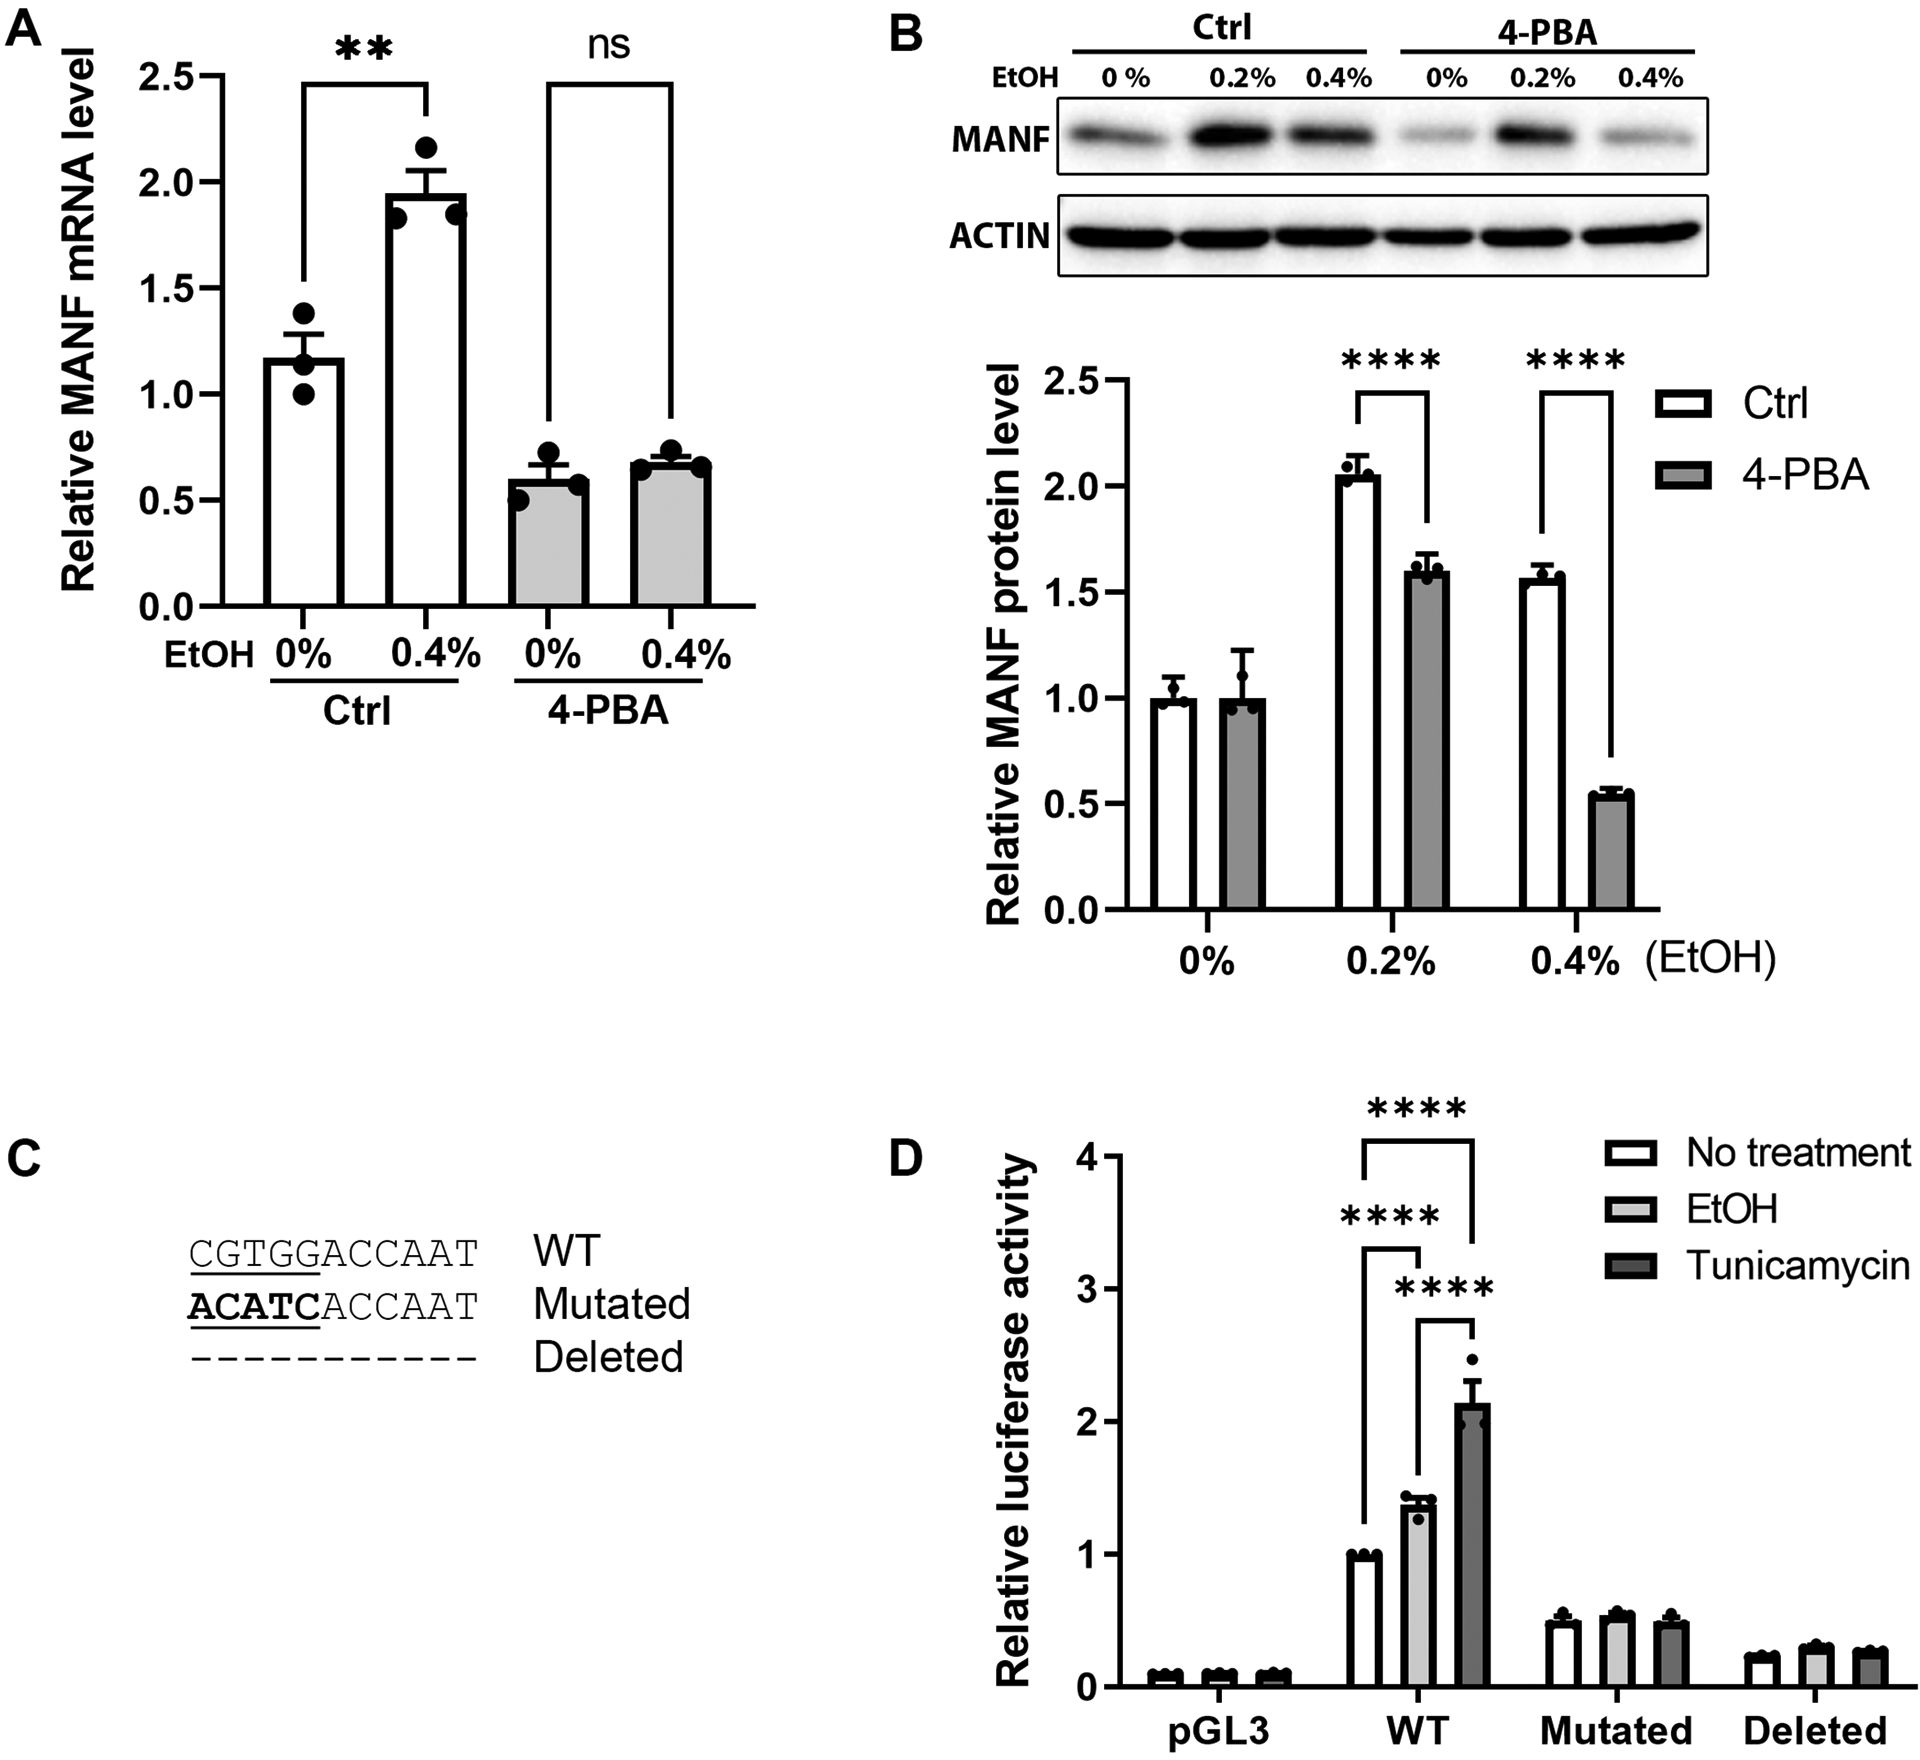
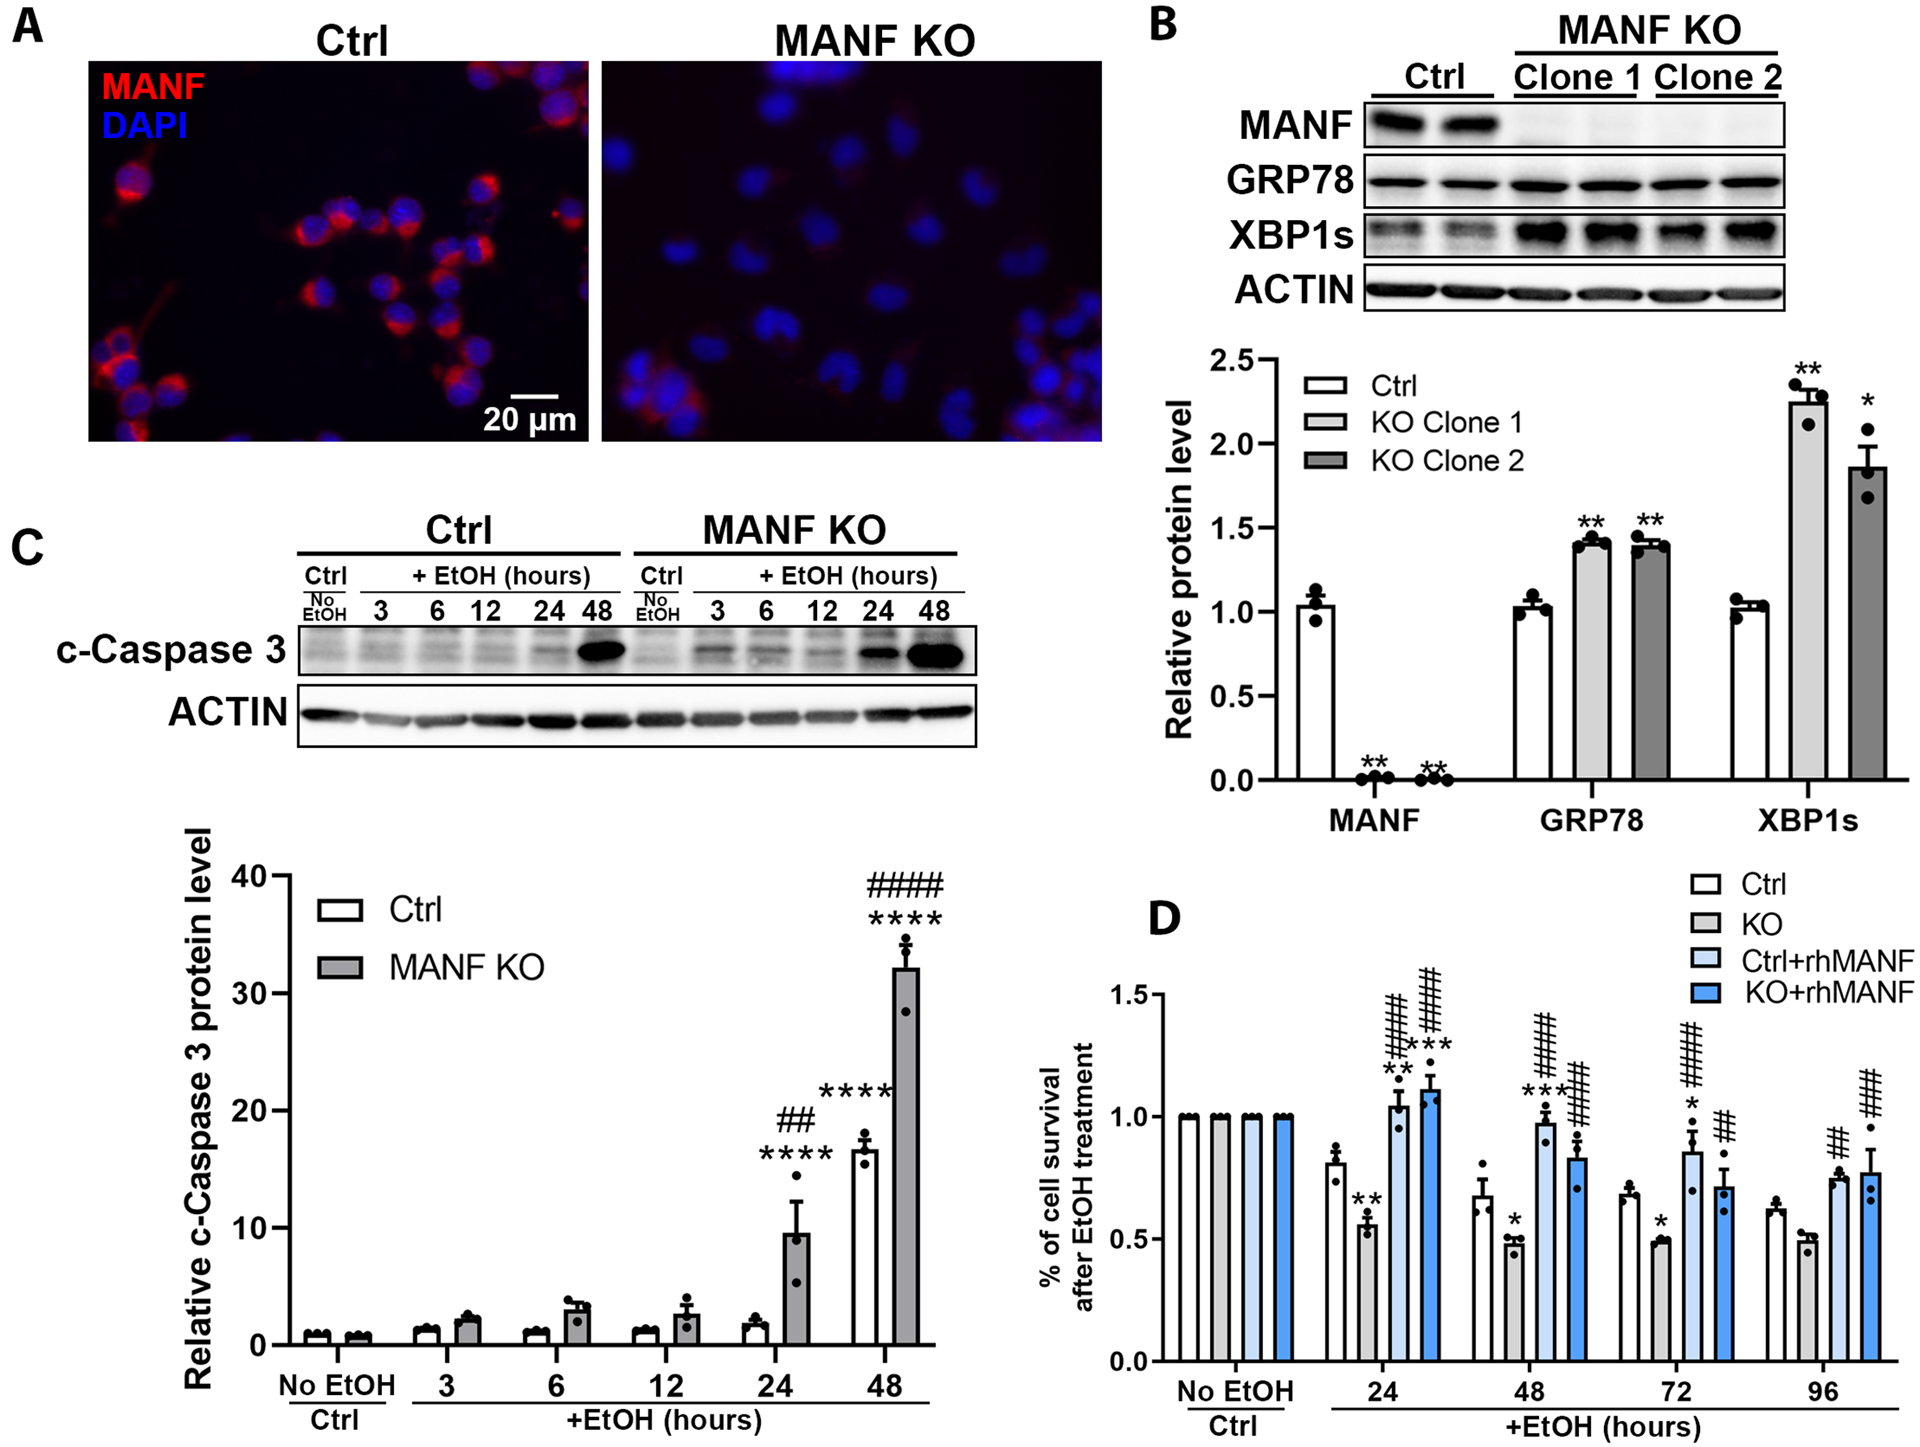
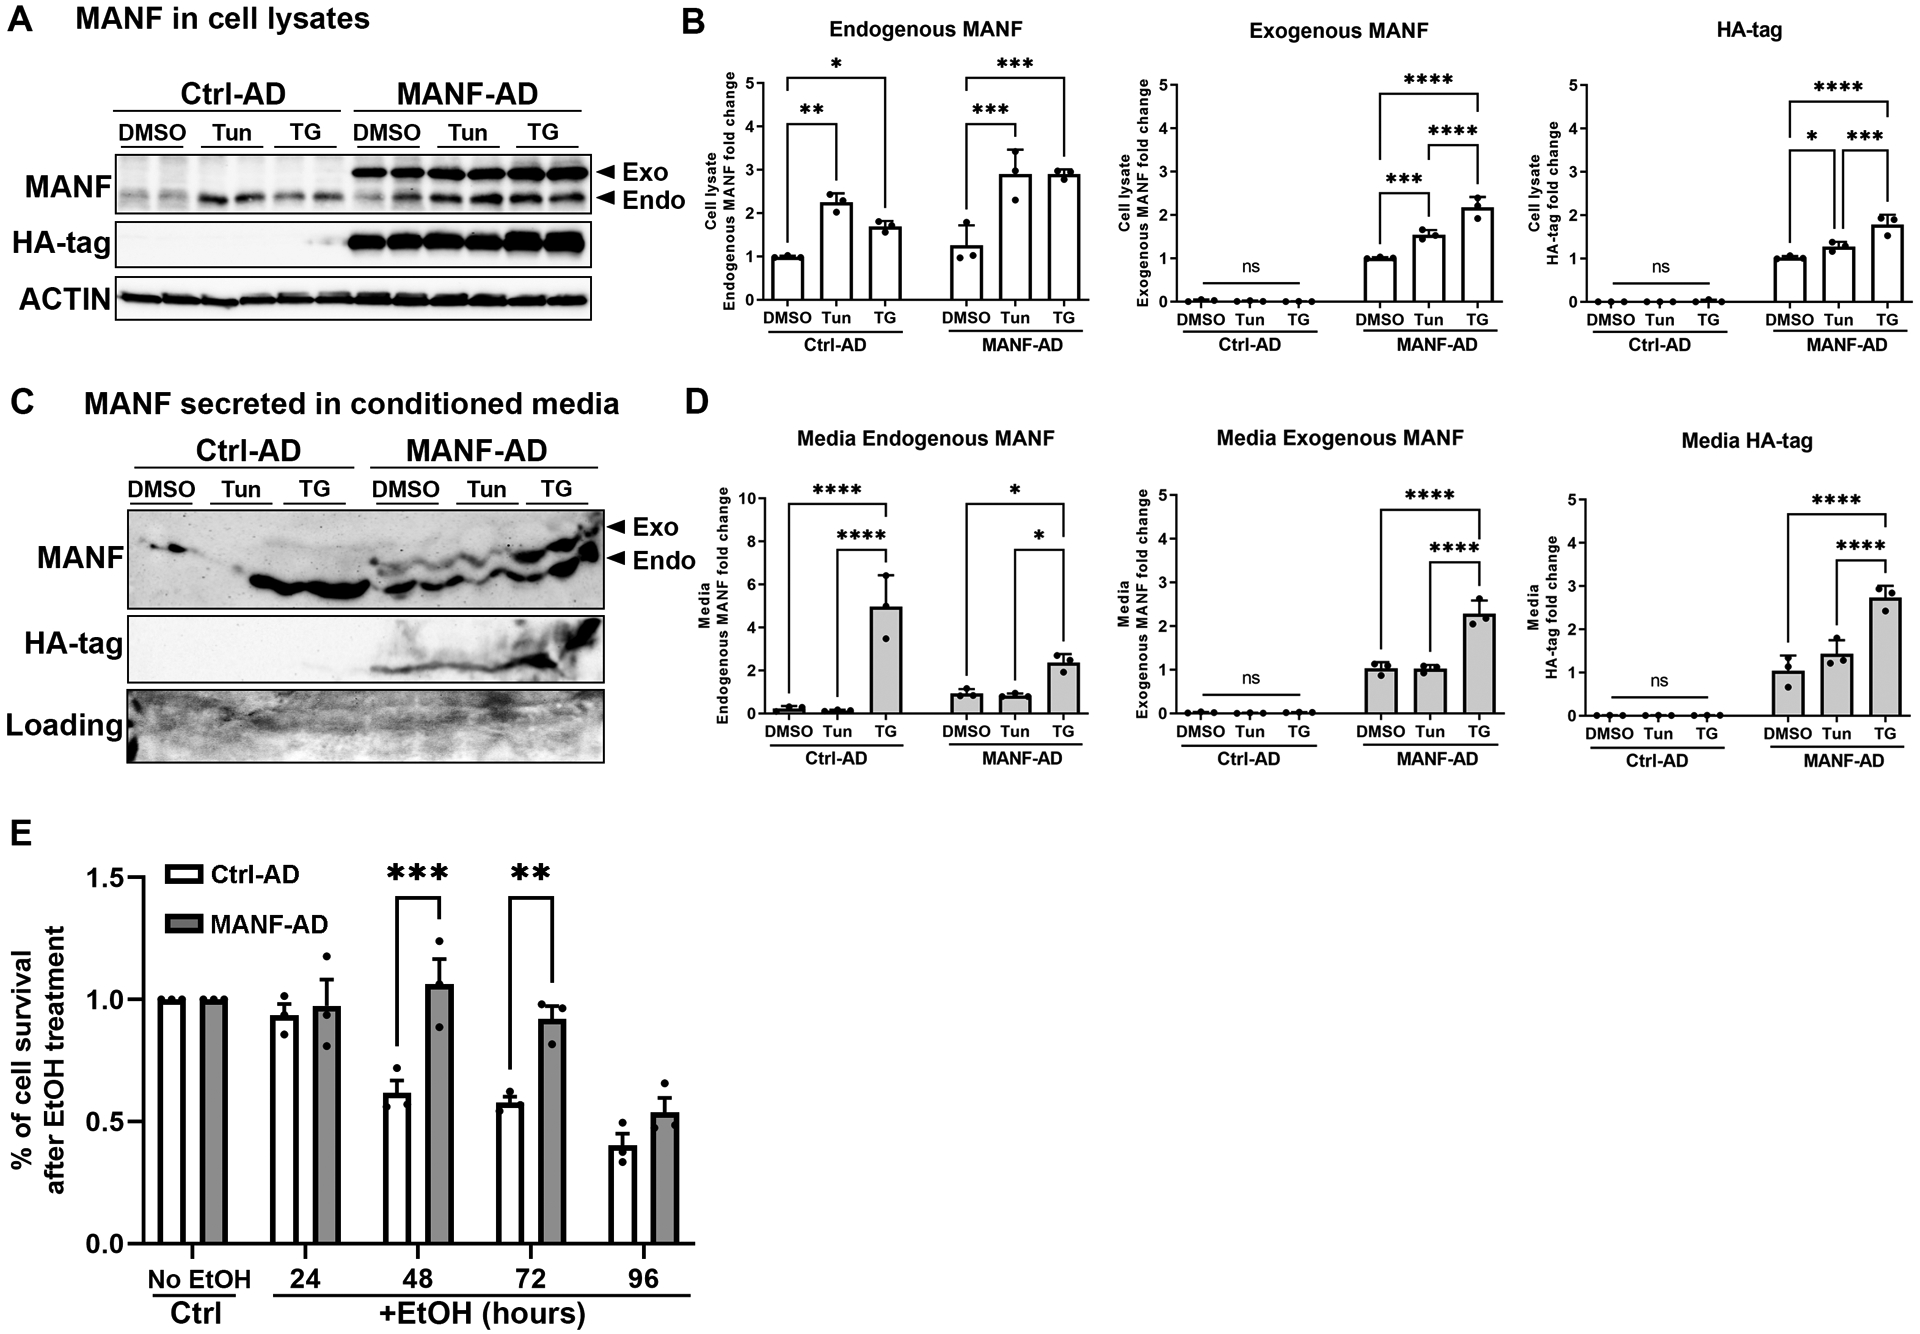
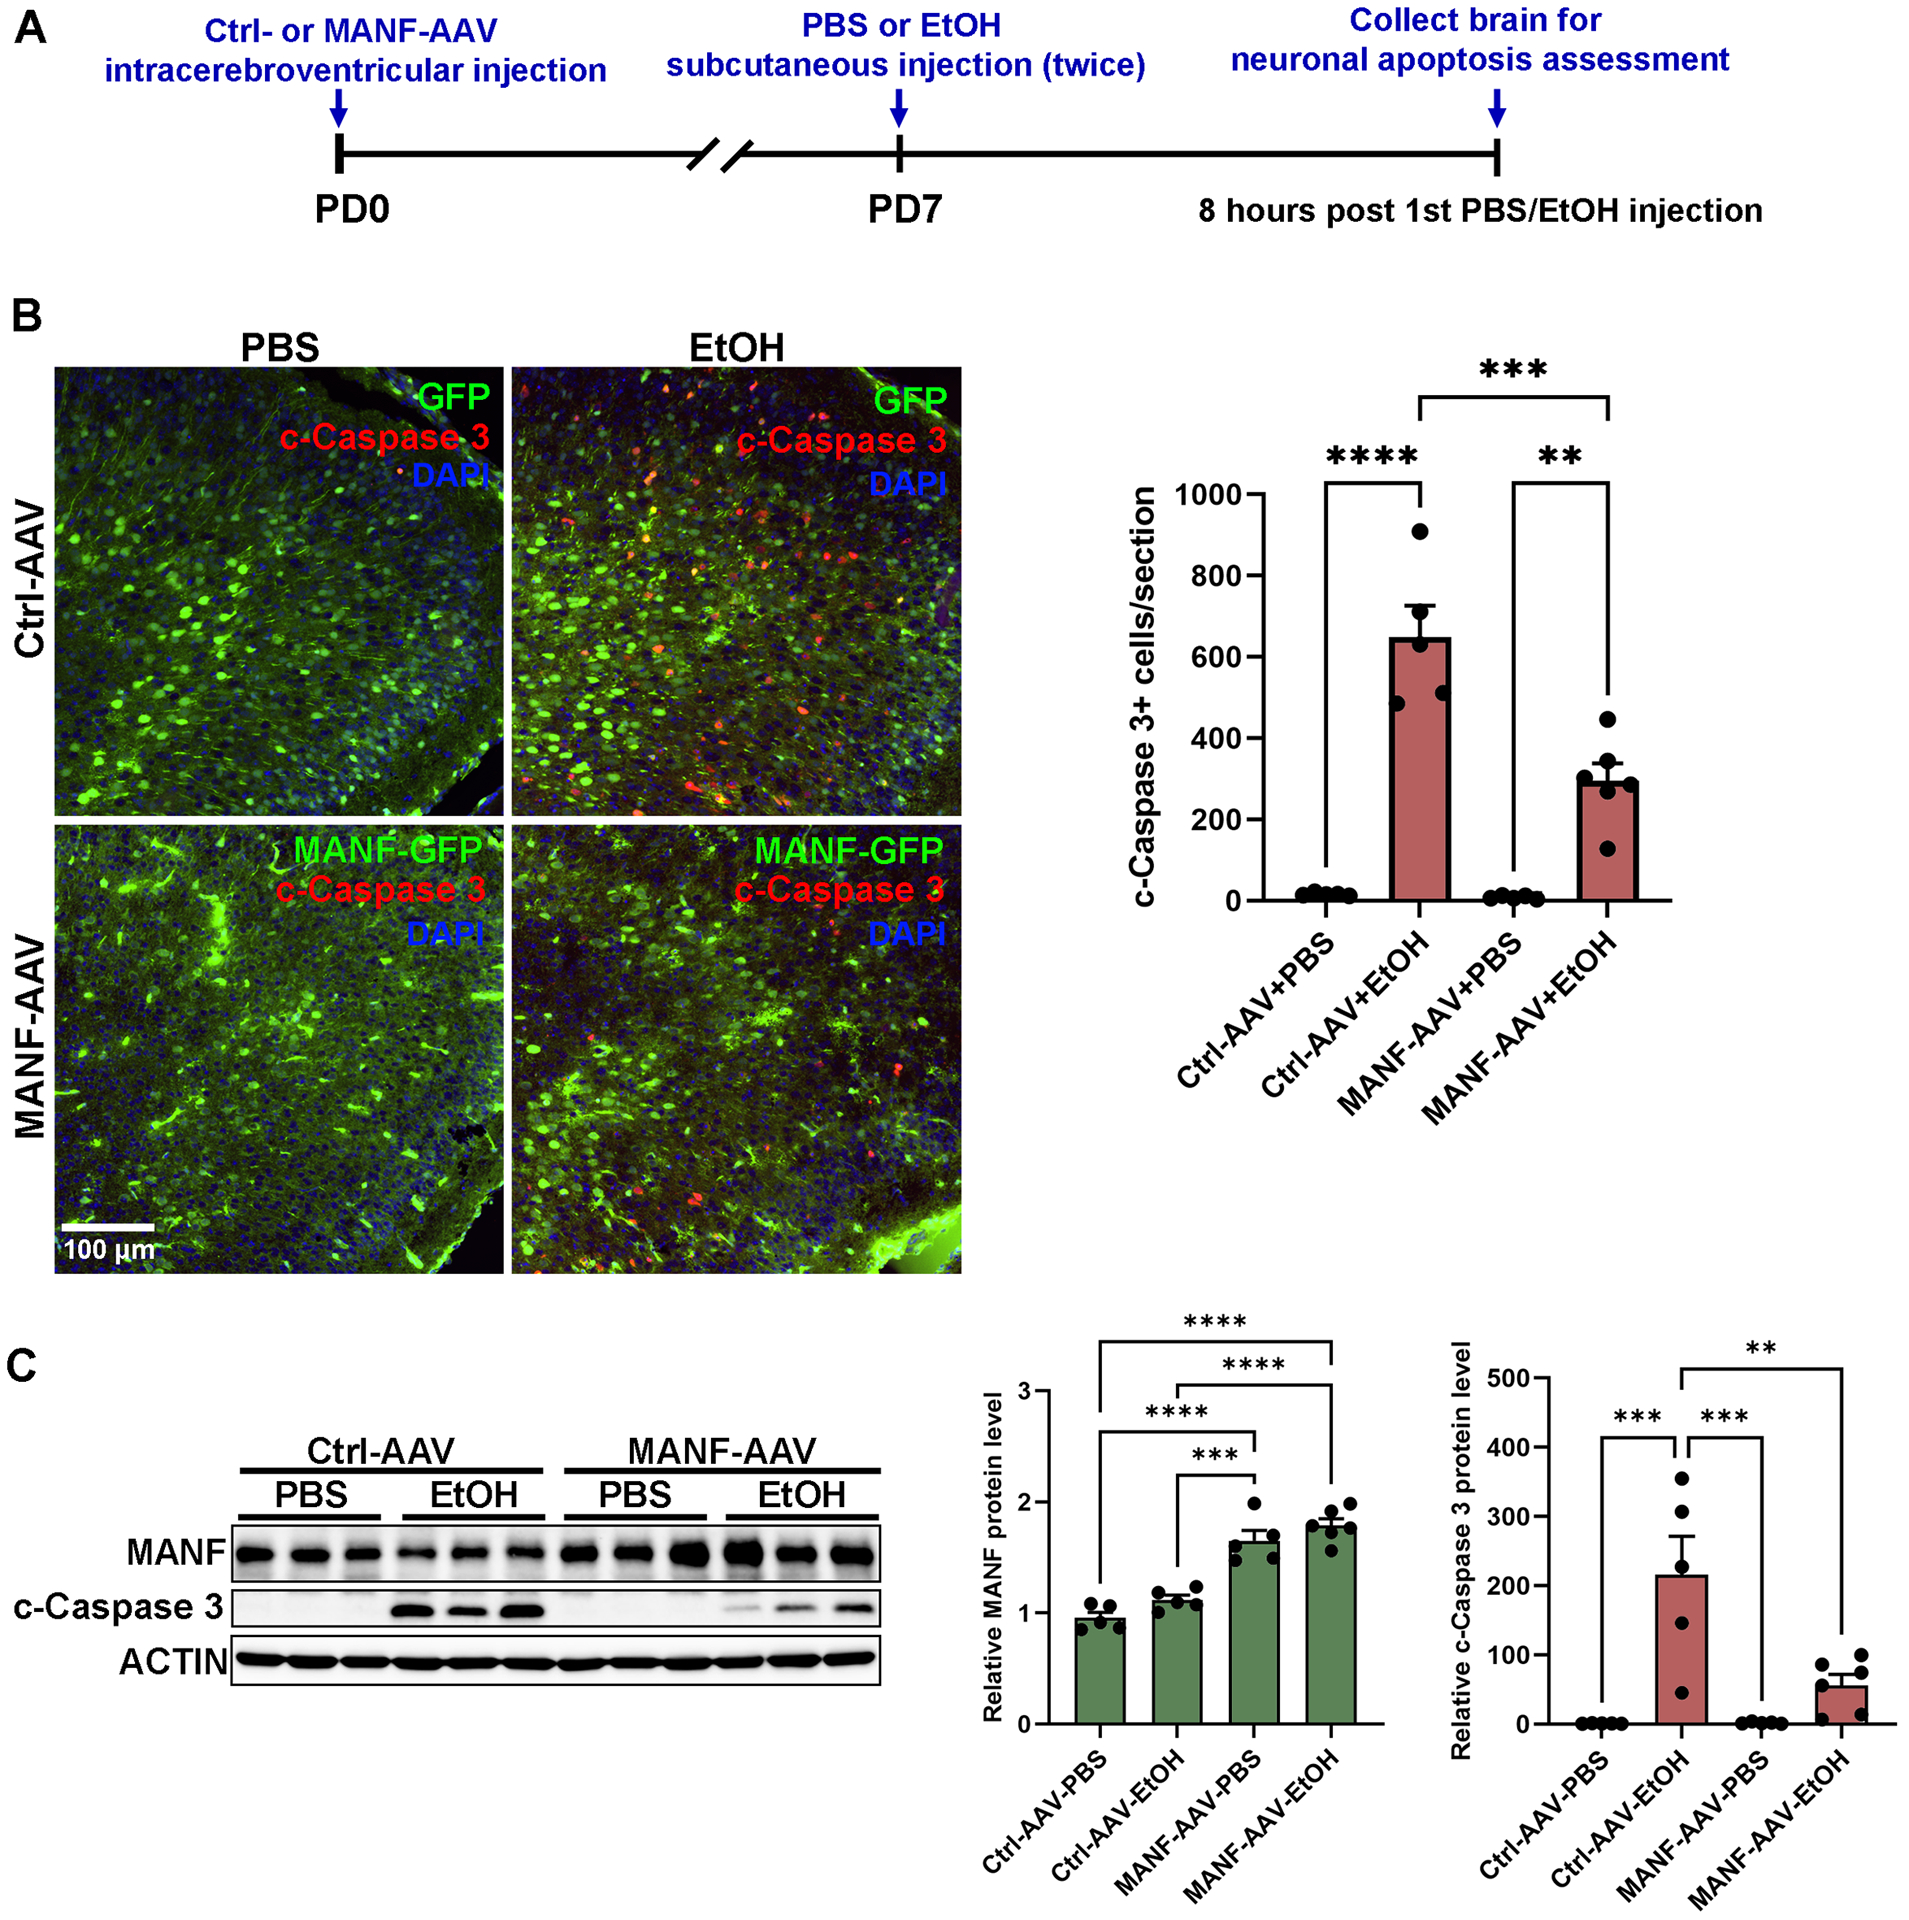
Alcohol exposure has detrimental effects on both the developing and mature brain. Endoplasmic reticulum (ER) stress is one of the mechanisms that contributes to alcohol-induced neuronal damages. Mesencephalic astrocyte-derived neurotrophic factor (MANF) is an ER stress-responsive protein and is neuroprotective in multiple neuronal injury and neurodegenerative disease models. MANF deficiency has been shown to exacerbate alcohol-induced ER stress and neurodegeneration. However, it is unknown whether MANF supplement is sufficient to protect against alcohol neurotoxicity. Alcohol alters MANF expression in the brain, but the mechanisms underlying alcohol modulation of MANF expression remain unclear. This study was designed to determine how alcohol alters MANF expression in neuronal cells and whether exogeneous MANF can alleviate alcohol neurotoxicity. We showed that alcohol increased MANF transcription and secretion without affecting MANF mRNA stability and protein degradation. ER stress was necessary for alcohol-induced MANF upregulation, as pharmacological inhibition of ER stress by 4-PBA diminished alcohol-induced MANF expression. In addition, the presence of ER stress response element II (ERSE-II) was required for alcohol-stimulated MANF transcription. Mutations or deletion of this sequence abolished alcohol-regulated transcriptional activity. We generated MANF knockout (KO) neuronal cells using CRISPR/Cas9. MANF KO cells exhibited increased unfolded protein response (UPR) and were more susceptible to alcohol-induced cell death. On the other hand, MANF upregulation by the addition of recombinant MANF protein or adenovirus gene transduction protected neuronal cells against alcohol-induced cell death. Further studies using early postnatal mouse pups demonstrated that enhanced MANF expression in the brain by intracerebroventricular (ICV) injection of MANF adeno-associated viruses ameliorated alcohol-induced cell death. Thus, alcohol increased MANF expression through inducing ER stress, which could be a protective response. Exogenous MANF was able to protect against alcohol-induced neurodegeneration.

Keywords: MANF; alcohol neurotoxicity; endoplasmic reticulum stress; neurodegeneration.


Conflict of interest statement

Conflicts of interest: The authors declare no conflict of interest.

Figures

Figure 1.
Figure 1.. Effects of alcohol on MANF expression and secretion in neuronal cells.
A-B: The levels of MANF mRNA in control and alcohol-treated (0.4% w/v) N2a and SH-SY5Y cells were examined by real-time PCR. The data was expressed as mean ± SEM from 3 independent cell culture preparations. One-way ANOVA followed by Tukey post hoc test, N2a cells: F (4, 10) = 16.97, p = 0.0002, SH-SY5Y cells: F (3, 8) = 29.18, p = 0.0001. ** p < 0.01 or *** p < 0.001 when compared to control; # p < 0.05 or ## p < 0.01 or ### p < 0.001 when compared to 2 h alcohol-treated group (N2a cells) or 3 h alcohol-treated group (SH-SY5Y cells); && p < 0.01 when compared to 6 h alcohol-treated groups. C-D: Representative immunoblots showing MANF protein levels in cell lysates and conditioned media in control and alcohol-treated cells. The data was expressed as mean ± SEM from 3–5 independent cell culture preparations. One-way ANOVA followed by Tukey post hoc test, N2a cell lysate: F (3, 8) = 5.636, p = 0.0226, SH-SY5Y cell lysate: F (3, 16) = 29.69, p < 0.0001, N2a conditioned media: F (3, 8) = 22.37, p = 0.0003, SH-SY5Y conditioned media: F (3, 8) = 14.33, p = 0.0014. * p < 0.05 or ** p <0.01 or *** p <0.001 or **** p < 0.0001 when compared to control; #### p < 0.0001 when compared to 3 h alcohol-treated group; &&& p < 0.001 when compared to 6 h alcohol-treated group. E: Representative fluorescent images of MANF (red) and PDIA1 (green) in N2a cells after 12 hours of alcohol treatment. The data was expressed as mean ± SEM from 5 independent cell culture preparations. t-test, t = 4.017, df = 8, p = 0.0039. ** p < 0.01.
Figure 2.
Figure 2.. Effects of alcohol on the stability of MANF mRNA and protein.
A: The levels of MANF mRNA in control and alcohol-treated (0.4% w/v) N2a cells were examined by real-time PCR after new RNA synthesize was inhibited by actinomycin D (10 μg/ml). The data was expressed as mean ± SEM from 3 independent cell culture preparations. Two-way ANOVA followed by Tukey post hoc test, Time: F (1.595, 6.380) = 33.38, p = 0.0005, EtOH: F (1, 4) = 4.997, p = 0.0891, Interaction: F (5, 20) = 1.750, p = 0.1693. No statistical significance was detected between control and EtOH groups. B: Representative immunoblots showing MANF protein levels in control and alcohol-treated (0.4% w/v) N2a cells after new protein synthesis was blocked by CHX (100 μg/ml). The data was expressed as mean ± SEM from 4 independent cell culture preparations. Two-way ANOVA followed by Tukey post hoc test, Time: F (4, 30) = 5.883, p = 0.0013, EtOH: F (1, 30) = 1.268, p = 0.2691, Interaction: F (4, 30) = 0.5218, p = 0.7204. No statistical significance was detected between control and EtOH groups.
Figure 3.
Figure 3.. Effects of alcohol on ER stress.
A-B: Representative immunoblots showing the expression of UPR proteins in control and alcohol-treated (0.4% w/v) N2a cell lysates. The data was expressed as mean ± SEM from 3–4 independent cell culture preparations. One-way ANOVA followed by Tukey post hoc test, GRP78: F (3, 12) = 4.254, p = 0.0290, p-PERK: F (3, 8) = 13.75, p = 0.0016, p-eIF2α: F (3, 8) = 11.63, p = 0.0027, ATF4: F (3, 8) = 106.5, p < 0.0001, CHOP: F (3, 8) = 9.668, p = 0.0049, p-IRE1α: F (3, 8) = 84.94, p < 0.0001, XBP1s: F (3, 8) = 312.0, p < 0.0001, ATF6α: F (3, 12) = 7.390, p = 0.0046. * p < 0.05 or ** p < 0.01 or *** p < 0.001 or **** p < 0.0001 when compared to control; # p < 0.05 or ## p < 0.01 or #### p < 0.0001 when compared to 3 h alcohol-treated group; & p < 0.05 or &&& p < 0.001 when compared to 6 h alcohol-treated group.
Figure 4.
Figure 4.. Effects of alcohol and 4-PBA on MANF expression and transcription activity.
A: Real-time PCR result showing the levels of MANF mRNA in control and alcohol-treated (0.4% w/v) N2a cells with or without the pretreatment of ER stress inhibitor 4-PBA. Cells were incubated with 0.4% (w/v) ethanol for 6 hours with or without 2 hours pretreatment of 10 mM 4-PBA. The data was expressed as mean ± SEM from 3 independent cell culture preparations. One-way ANOVA followed by Tukey post hoc test, F (3, 8) = 52.15, p < 0.0001. ** p < 0.01, ns not statistically significant. B: Representative immunoblots of MANF expression in control and alcohol-treated N2a cells with or without the pretreatment of ER stress inhibitor 4-PBA. Cells were incubated with 0.2% or 0.4% (w/v) ethanol for 12 hours with or without 2 hours pretreatment of 10 mM 4-PBA. The data was expressed as mean ± SEM from 3 independent cell culture preparations. t-test, 0%: t = 4.444e-006, df = 4, p = 0.999997, 0.2%: t = 16.48, df = 4, p = 0.000079, 0.4%: t = 64.48, df = 4, p <0.000001. **** p < 0.0001. C: The consensus sequence of ERSE-II in MANF promoter is shown and ATF6/XBP1s binding site is underlined. Mutated sequence is bolded. Dashed line represents the deletion of the entire ERSE-II sequence. D: N2a cells were transfected with luciferase reporter constructs with MANF promotor regions containing wild type (WT), mutated, or deleted ERSE-II sequence. After the transfection, cells were treated with ethanol (0.4% w/v) or tunicamycin (5 μg/ml) for 6 hours. Luciferase activity was measured and normalized to cells that were transfected with WT construct and with no treatment. The data was expressed as mean ± SEM from 3 independent cell culture preparations. Two-way ANOVA followed by Tukey post hoc test, Mutations: F (3, 24) = 445.6, p < 0.0001, Treatment: F (2, 24) = 32.67, p < 0.0001, Interaction: F (6, 24) = 31.84, p < 0.0001. **** p < 0.0001.
Figure 5.
Figure 5.. Effects of MANF deficiency on alcohol-induced cell death.
A: Representative fluorescent images confirming MANF knockout (KO) in N2a cells. B: Representative immunoblots of MANF, GRP78, and XBP1s expression in control and MANF KO N2a cells. The data was expressed as mean ± SEM from 3 independent cell culture preparations. One-way ANOVA followed by Tukey post hoc test, MANF: F (2, 6) = 361.0, p < 0.0001, GRP78: F (2, 6) = 60.17, p = 0.0001, XBP1s: F (2, 6) = 58.41, p = 0.0001. * p < 0.05 or ** p < 0.01 when compared to control cells. C: Representative immunoblots of cleaved-caspase 3 expression in control and alcohol-treated (0.4% w/v) control and MANF KO N2a cells. The data was expressed as mean ± SEM from 3 independent cell culture preparations. Two-way ANOVA followed by Tukey post hoc test, Time: F (5, 24) = 161.4, p < 0.0001, KO: F (1, 24) = 59.67, p < 0.0001, Interaction: F (1, 24) = 59.67, p < 0.0001. **** p < 0.0001 when compared to all earlier time points. ## p < 0.01 or #### p < 0.0001 when compared between control and MANF KO cells within each time points. D: N2a cells were incubated with or without 20 ng/ml rhMANF. Cell viability was tested by MTT assay at various time points after alcohol treatment (0.4% w/v). Percentage of cell survival was calculated by normalizing the alcohol treated group by no alcohol control group at each time points. The data was expressed as mean ± SEM from 3 independent cell culture preparations. Two-way ANOVA followed by Tukey post hoc test, Time: F (4, 40) = 38.64, p < 0.0001, KO: F (3, 40) = 48.86, p < 0.0001, Interaction: F (12, 40) = 4.994, p < 0.0001. * p < 0.05, ** p < 0.01, *** p < 0.001 when compared to control; ## p < 0.01, ### p <0.01, #### p < 0.0001 when compared to KO at each time points.
Figure 6.
Figure 6.. Effects of exogenous MANF on alcohol-induced cell death.
A: N2a Cells were transduced with Ctrl-AD or MANF-AD for 4 hours, then treated with DMSO or tunicamycin (5 μg/ml) or thapsigargin (1.5 μM) for 24 hours. Representative immunoblots of MANF and HA-tag expression in N2a cell lysates. Exogenous (exo) and endogenous (endo) MANF were distinguished by the shift of migration on SDS-PAGE gel electrophoresis. Exogenous MANF migrated slower than endogenous MANF because of the HA tag. Tun: tunicamycin; TG: thapsigargin. B: Quantification of the cell lysates immunoblots. The data was expressed as mean ± SEM from 3 independent cell culture preparations. Two-way ANOVA followed by Tukey post hoc test. Endogenous MANF: Treatment F (2, 12) = 35.41, p < 0.0001, Ctrl- vs MANF-AD F (2, 12) = 22.67, p = 0.0005, Interaction F (2, 12) = 3.33, p = 0.0707. Exogenous MANF: Treatment F (2, 12) = 41.68, p < 0.0001, Ctrl- vs MANF-AD F (2, 12) = 933.4, p < 0.0001, Interaction F (2, 12) = 45.01, p < 0.0001. Ha-tag: Treatment F (2, 12) = 22.21, p < 0.0001, Ctrl- vs MANF-AD F (2, 12) = 769.4, p < 0.0001, Interaction F (2, 12) = 20.1, p = 0.0001. * p<0.05, ** p < 0.01, *** p < 0.001, **** p < 0.0001, ns not statistically significant. C: Representative immunoblots of MANF and HA-tag expression in conditioned culture media. D: Quantification of the conditioned media immunoblots. The data was expressed as mean ± SEM from 3 independent cell culture preparations. Two-way ANOVA followed by Tukey post hoc test. Endogenous MANF: Treatment F (2, 12) = 49.6, p < 0.0001, Ctrl- vs MANF-AD F (2, 12) = 1.788, p = 0.206, Interaction F (2, 12) = 13.82, p = 0.00008. Exogenous MANF: Treatment F (2, 12) = 39.97, p < 0.0001, Ctrl- vs MANF-AD F (2, 12) = 459.5, p < 0.0001, Interaction F (2, 12) = 38.93, p < 0.0001. Ha-tag: Treatment F (2, 12) = 23.82, p < 0.0001, Ctrl- vs MANF-AD F (2, 12) = 272.1, p < 0.0001, Interaction F (2, 12) = 23.66, p = 0.0001. * p<0.05, **** p < 0.0001, ns not statistically significant. E: The viability of cells transduced with Ctrl-AD and MANF-AD was tested by MTT assay at various time points following alcohol exposure. Percentage of cell survival was calculated by normalizing the alcohol treated group by no alcohol control group at each time points. The data was expressed as mean ± SEM from 3 independent cell culture preparations. Two-way ANOVA followed by Tukey post hoc test, Time: F (4, 20) = 24.70, p < 0.0001, MANF: F (1, 20) = 25.93, p < 0.0001, Interaction: F (4, 20) = 5.276, p = 0.0046. ** p < 0.01, *** p < 0.001.
Figure 7.
Figure 7.. Effects of MANF on alcohol-induced cell death in the developing mouse cerebral cortex.
A: Time-line diagram showing the experimental procedure. Newborn pups were ICV-injected with either control- or MANF-AAV. The pups were then injected with PBS control or alcohol subcutaneously at PD7. Eight hours after alcohol treatment, the pups were sacrificed, and the cerebral cortices were dissected. B: Representative fluorescent images of GFP (green) and cleaved-caspase 3 (red) in the PD7 cerebral cortex. The number of cleaved-caspase 3 positive cells in the cerebral cortex was quantified. The data was expressed as mean ± SEM. n = 5–6 animals per group. One-way ANOVA followed by Tukey post hoc test, F (3, 17) = 45.37, p < 0.0001. ** p < 0.01, *** p < 0.001, **** p < 0.0001. C: Representative immunoblots of MANF and cleaved-caspase 3 in the PD7 cerebral cortex. The data was expressed as mean ± SEM. n = 5–6 animals per group. One-way ANOVA followed by Tukey post hoc test, MANF: F (3, 17) = 40.23, p < 0.0001, cleaved-caspase 3: F (3, 17) = 12.69, p = 0.0001. ** p < 0.01, *** p < 0.001, **** p < 0.0001.

Similar articles

Cited by

References

    1. Patel F and Mandal P. Effect of Alcohol on Brain Development. 2018.
    1. Squeglia LM, et al., Age-related effects of alcohol from adolescent, adult, and aged populations using human and animal models. Alcohol Clin Exp Res, 2014. 38(10): p. 2509–16. - PMC - PubMed
    1. Mattson SN, Bernes GA, and Doyle LR, Fetal Alcohol Spectrum Disorders: A Review of the Neurobehavioral Deficits Associated With Prenatal Alcohol Exposure. Alcohol Clin Exp Res, 2019. 43(6): p. 1046–1062. - PMC - PubMed
    1. Gursky ZH, Spillman EC, and Klintsova AY, Single-day Postnatal Alcohol Exposure Induces Apoptotic Cell Death and Causes long-term Neuron Loss in Rodent Thalamic Nucleus Reuniens. Neuroscience, 2020. 435: p. 124–134. - PMC - PubMed
    1. Ikonomidou C, et al., Ethanol-induced apoptotic neurodegeneration and fetal alcohol syndrome. Science, 2000. 287(5455): p. 1056–60. - PubMed

Publication types