. 2023 Jul 28;14(1):4555.
doi: 10.1038/s41467-023-40234-9.

A small area model to assess temporal trends and sub-national disparities in healthcare quality

Affiliations

A small area model to assess temporal trends and sub-national disparities in healthcare quality

Adrien Allorant et al. Nat Commun. .

Abstract

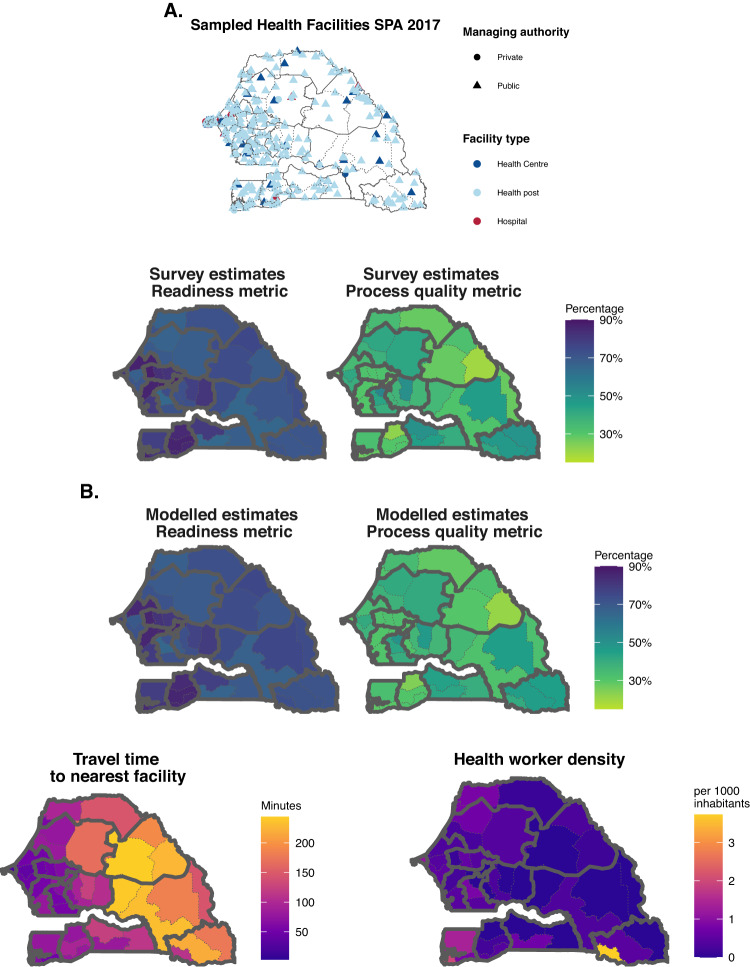
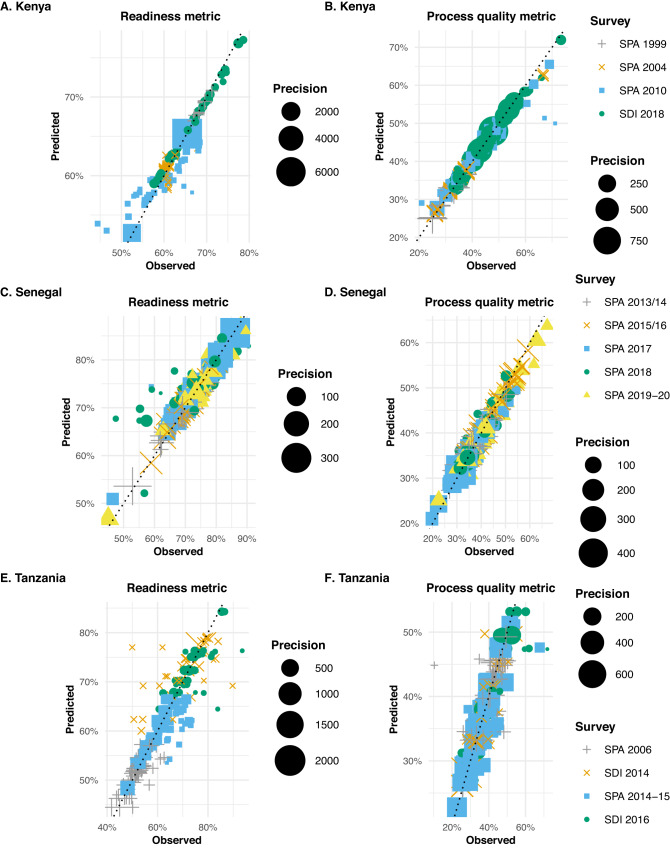
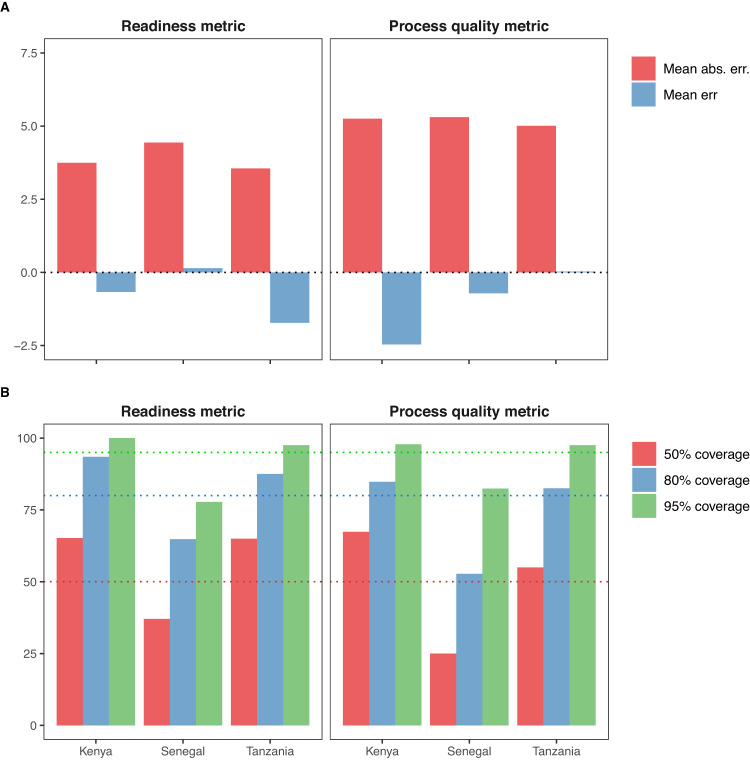
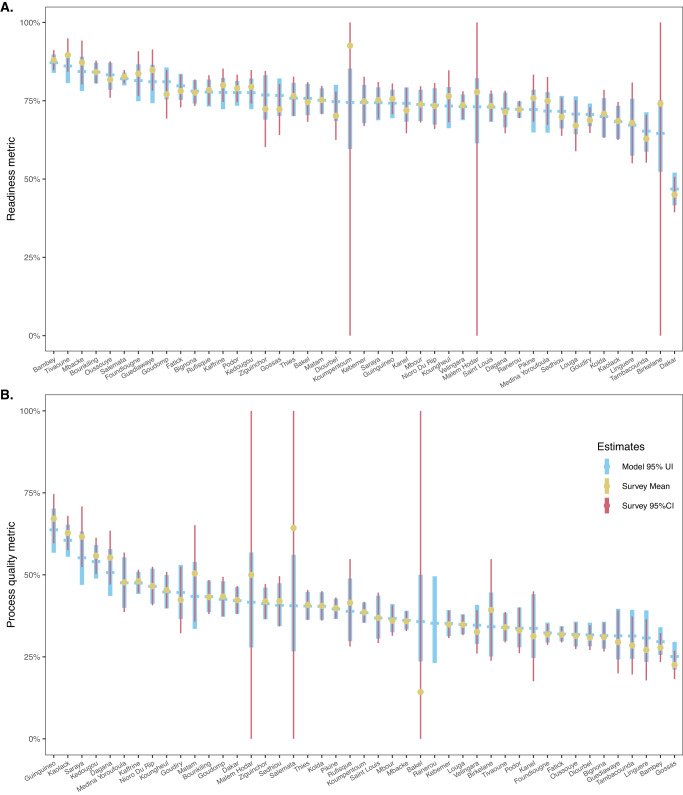
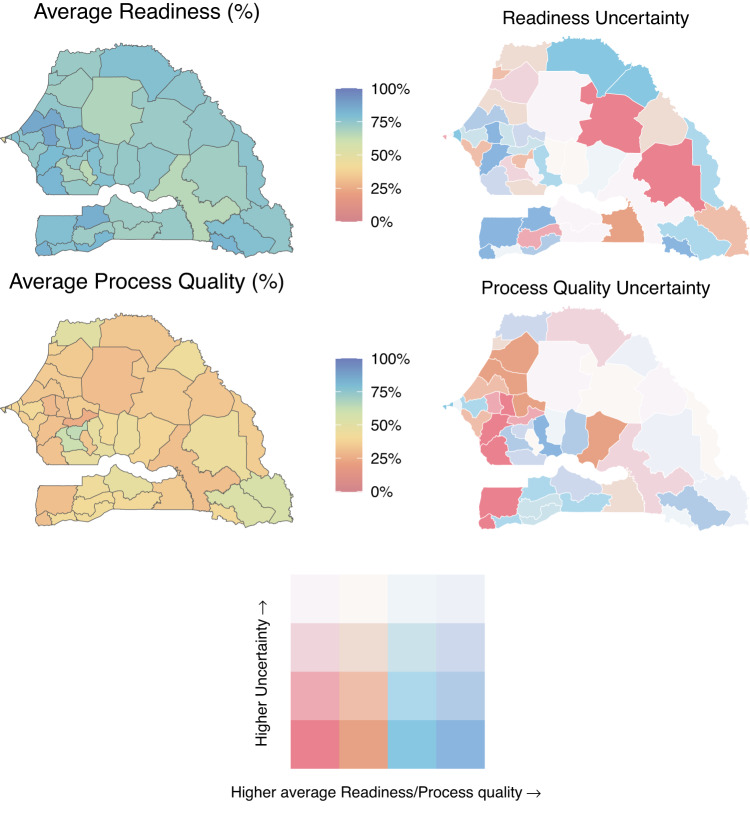
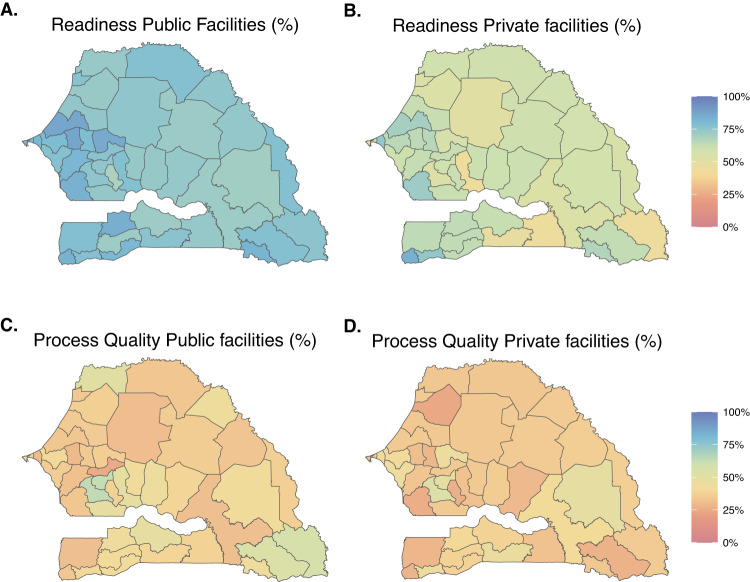
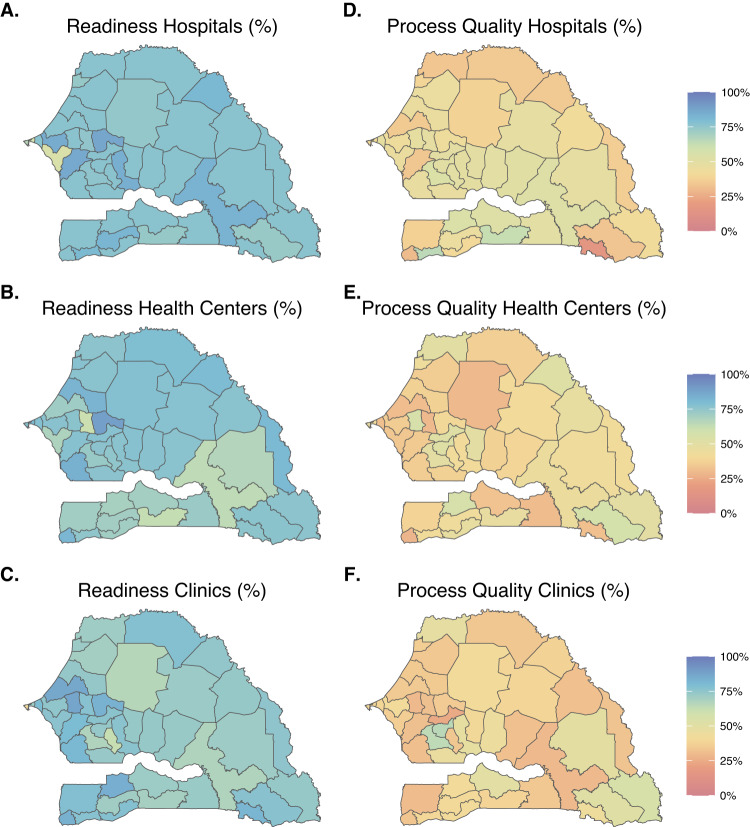
Monitoring subnational healthcare quality is important for identifying and addressing geographic inequities. Yet, health facility surveys are rarely powered to support the generation of estimates at more local levels. With this study, we propose an analytical approach for estimating both temporal and subnational patterns of healthcare quality indicators from health facility survey data. This method uses random effects to account for differences between survey instruments; space-time processes to leverage correlations in space and time; and covariates to incorporate auxiliary information. We applied this method for three countries in which at least four health facility surveys had been conducted since 1999 - Kenya, Senegal, and Tanzania - and estimated measures of sick-child care quality per WHO Service Availability and Readiness Assessment (SARA) guidelines at programmatic subnational level, between 1999 and 2020. Model performance metrics indicated good out-of-sample predictive validity, illustrating the potential utility of geospatial statistical models for health facility data. This method offers a way to jointly estimate indicators of healthcare quality over space and time, which could then provide insights to decision-makers and health service program managers.


Conflict of interest statement

N.F. reports financial support from Gates Ventures since June 2020 outside of the submitted work. All other authors declare no competing interests.

Figures

Fig. 1
Fig. 1. Modelling steps for estimating metrics of readiness and process quality subnationally and over time.
A Step 1: in each country, metrics of readiness and process quality are calculated in sampled facilities (Sampled health facilities map), and then aggregated using facilities’ survey weights to the subnational level (Survey estimates Readiness and Process quality maps). B Step 2: Subnational-level estimates of readiness and process quality (top maps) are obtained from a model using space-time smoothing and spatially referenced covariates (exemplified with bottom maps). Data for Senegal in 2017 are shown for reference here. SPA = Service Provision Assessment survey. Source data are provided as a Source Data file.
Fig. 2
Fig. 2. In-sample validation results for estimated readiness and process quality metrics, at the area-level.
In-sample validation results for estimated readiness (left panel) and process quality (right panel) metrics, at the area-level, in Kenya (A and B), Senegal (C and D), and Tanzania (E and F). The dotted line has a slope of 1, showing the relationship between survey-estimated and model-estimated readiness and process quality metrics. Points’ colours and shapes represent the different survey-years from which the direct survey estimates were derived. For instance, in Kenya (Fig. 2A, B), green dots represent county-level estimates from the SDI survey conducted in 2018, while blue rectangles represent county-level estimates derived from the SPA survey conducted in 2010. As facility surveys were not all powered to produce reliable estimates of healthcare quality metrics at fine spatial resolution, we want to distinguish on the plot between area-level survey estimates with higher precision (i.e., lower variance) and less reliable area-level survey estimates (with lower precision). For each metric and country, points are sized based on area-level survey estimates’ precision (i.e., the inverse of the variance of the survey estimates). For instance, in Kenya, two county-level estimates of the readiness metric derived from the SPA 2010 show high precision- large blue rectangles, while most others show low precision (Fig. 2A). SPA = Service Provision Assessment survey; SDI = Service Delivery Indicators survey. Source data are provided as a Source Data file.
Fig. 3
Fig. 3. Measures of bias, precision, and calibration of models’ predictions.
Measures of bias and precision (Panel A), and calibration (Panel B) of models’ predictions, using hold-out predictions of readiness and process quality metrics, in subnational areas of Kenya, Senegal, and Tanzania. Mean error, mean absolute error, and coverage were calculated across all administrative areas, using cross validation. Hold-out predictions are obtained by removing out all observations in an area and year when fitting the model and predicting the average readiness or process quality metric with uncertainty. We repeat this process for all area-year with survey estimates; because facility surveys are not powered to produce reliable estimates at fine spatial resolution, we limit this analysis to area-year where the variance of the survey estimate is below the 50th percentiles of all areal estimates’ variance, by metric, country, and year. Dotted lines on panel B represent the 50%, 80 and 95% coverage nominal levels. Mean err = Mean error; Mean abs. err. = Mean absolute error. Source data are provided as a Source Data file.
Fig. 4
Fig. 4. Comparison of department-level survey and model estimates for the readiness and process quality metrics.
Comparison of department-level survey and model estimates for (Panel A) the readiness and (Panel B) process quality metrics in Senegal, in 2019. This figure compares empirical survey and model estimates, for the most recent survey-year in Senegal. Thick light-blue dash and vertical ranges show model posterior mean estimates, and the 95% posterior prediction intervals. Yellow dots and narrow red vertical lines indicate survey estimates and 95% confidence intervals, derived from SPA 2019 (n = 361 facilities sampled, panel A; n = 885 consultations observed in 253 facilities, panel B). Source data are provided as a Source Data file.
Fig. 5
Fig. 5. Maps of model-estimated readiness (top panel) and process quality (bottom panel) metrics by subnational areas in Senegal in 2020, with associated uncertainty.
The left panel presents estimates of the mean, while the right panel shows both estimates of the mean and their associated 95% uncertainty interval width. Mean estimated metrics are split into quartiles; the cut-off points indicate the metric estimates’ minimum, 25th, 50th, and 75th percentiles, and maximum, which were 46.8%, 72.2%, 74.5%, 77.8%, and 87.1%, for the readiness metric, and 25.1%, 33.7%, 38.4%, 43.4%, and 63.7%, for process quality. The confidence intervals’ width minimum, 25th, 50th, and 75th percentiles, and maximum, were 4%, 8.6%, 10.5%, 12.2%, and 26%. Source data are provided as a Source Data file.
Fig. 6
Fig. 6. Maps of model-estimated readiness (top panel) and process quality (bottom panel) metrics by subnational areas, and managing authorities, in Senegal in 2020.
Panels A and B (respectively C and D) are maps of modelled area-level estimates of readiness (respectively process quality) for analyses stratified on public and private facilities. Source data are provided as a Source Data file.
Fig. 7
Fig. 7. Maps of model-estimated readiness (left panel) and process quality (right panel) metrics by subnational areas, and managing authorities, in Senegal in 2020.
Panels A, B, and C (respectively D, E, and F) are maps of modelled area-level estimates of readiness (respectively process quality) for analyses stratified on facility type. Source data are provided as a Source Data file.

References

    1. United Nations, S. Global indicator framework for the Sustainable Development Goals and targets of the 2030 Agenda for Sustainable Development. (2017).
    1. Kruk ME, et al. High-quality health systems in the sustainable development goals era: time for a revolution. Lancet Glob. Health. 2018;6:e1196–e1252. doi: 10.1016/S2214-109X(18)30386-3. - DOI - PMC - PubMed
    1. Di Giorgio L, et al. Analysis of clinical knowledge, absenteeism and availability of resources for maternal and child health: a cross-sectional quality of care study in 10 African countries. BMJ Glob. Health. 2020;5:e003377. doi: 10.1136/bmjgh-2020-003377. - DOI - PMC - PubMed
    1. Gage AD, et al. Assessing the quality of primary care in Haiti. Bull. World Health Organ. 2017;95:182–190. doi: 10.2471/BLT.16.179846. - DOI - PMC - PubMed
    1. Leslie HH, Spiegelman D, Zhou X, Kruk ME. Service readiness of health facilities in Bangladesh, Haiti, Kenya, Malawi, Namibia, Nepal, Rwanda, Senegal, Uganda and the United Republic of Tanzania. Bull. World Health Organ. 2017;95:738–748. doi: 10.2471/BLT.17.191916. - DOI - PMC - PubMed

Publication types