. 2023 Dec;44(12):2432-2444.
doi: 10.1038/s41401-023-01128-0. Epub 2023 Jul 28.

Serum granulosa cell-derived TNF-α promotes inflammation and apoptosis of renal tubular cells and PCOS-related kidney injury through NF-κB signaling

Affiliations

Serum granulosa cell-derived TNF-α promotes inflammation and apoptosis of renal tubular cells and PCOS-related kidney injury through NF-κB signaling

Hui-Yun Ye et al. Acta Pharmacol Sin. 2023 Dec.

Abstract

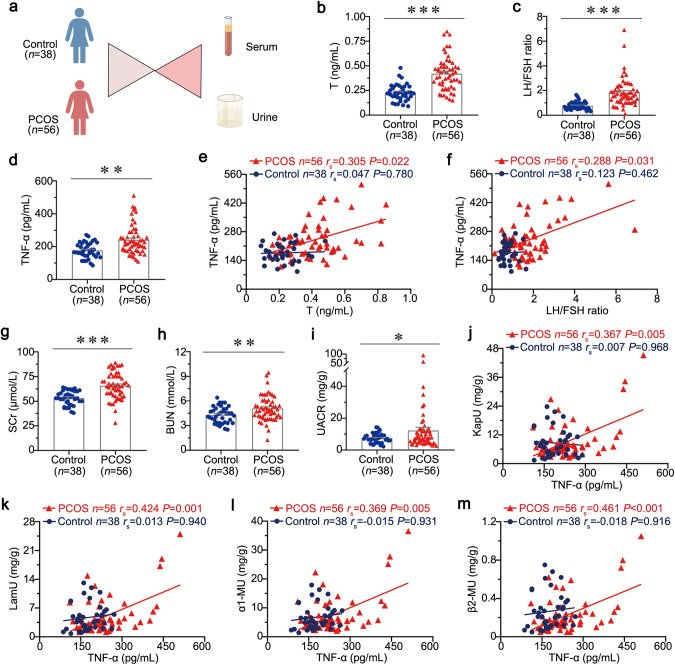
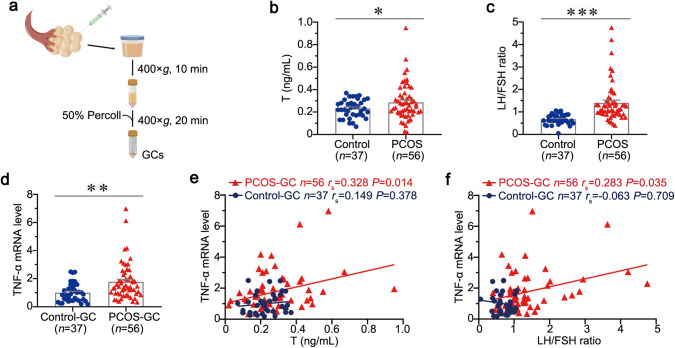
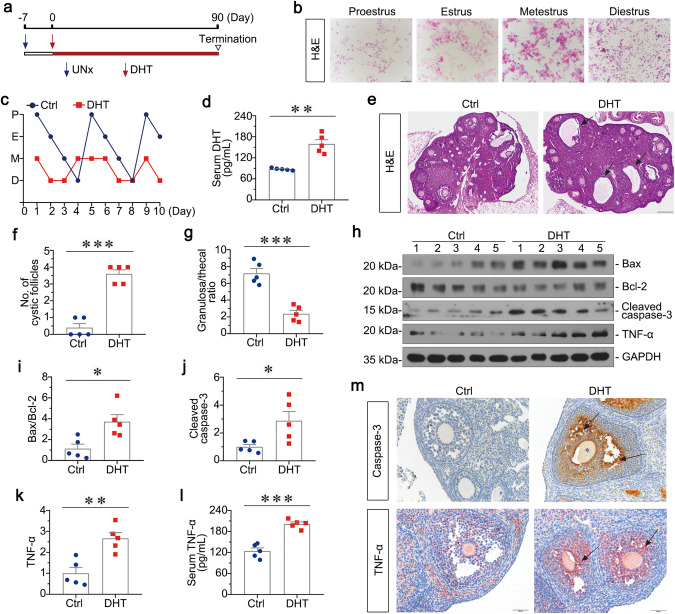
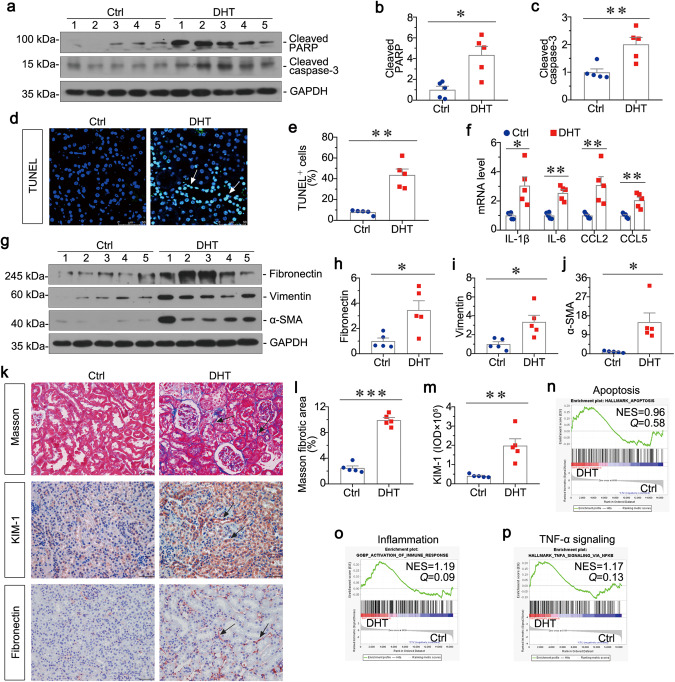
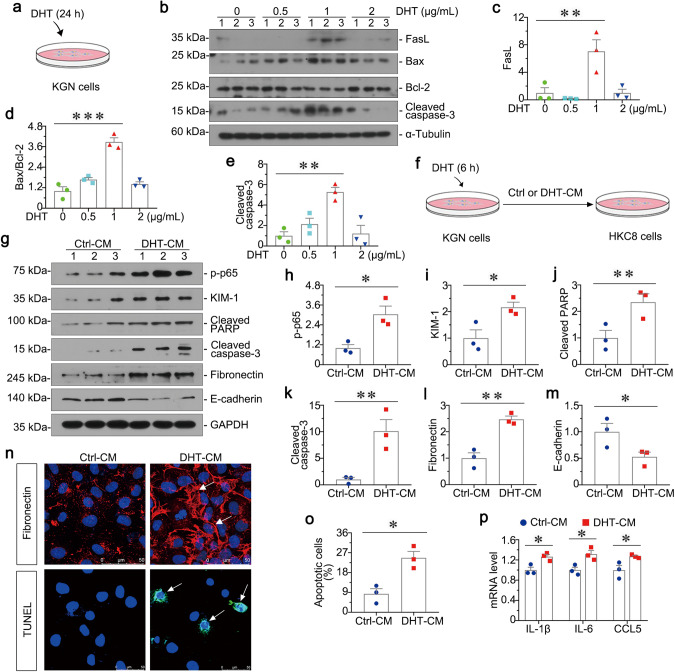
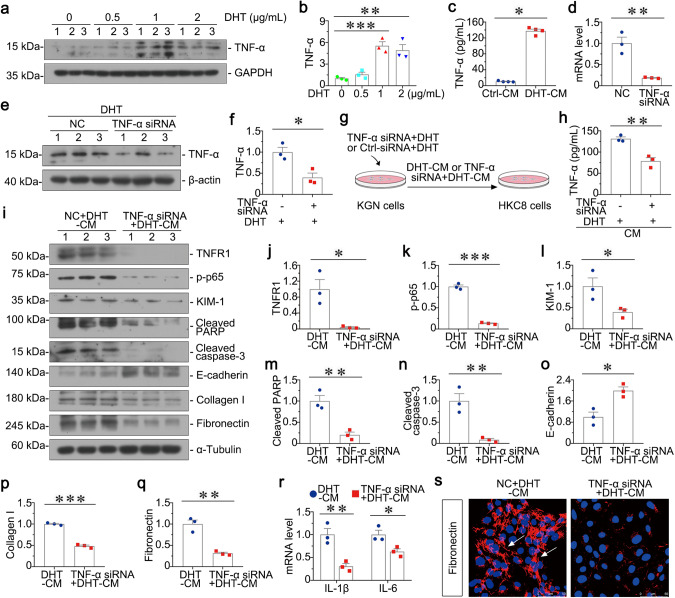
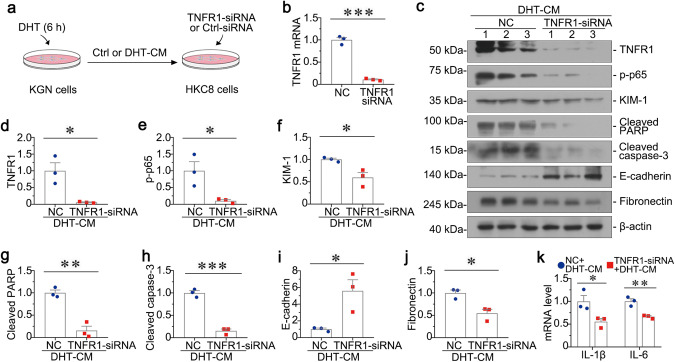
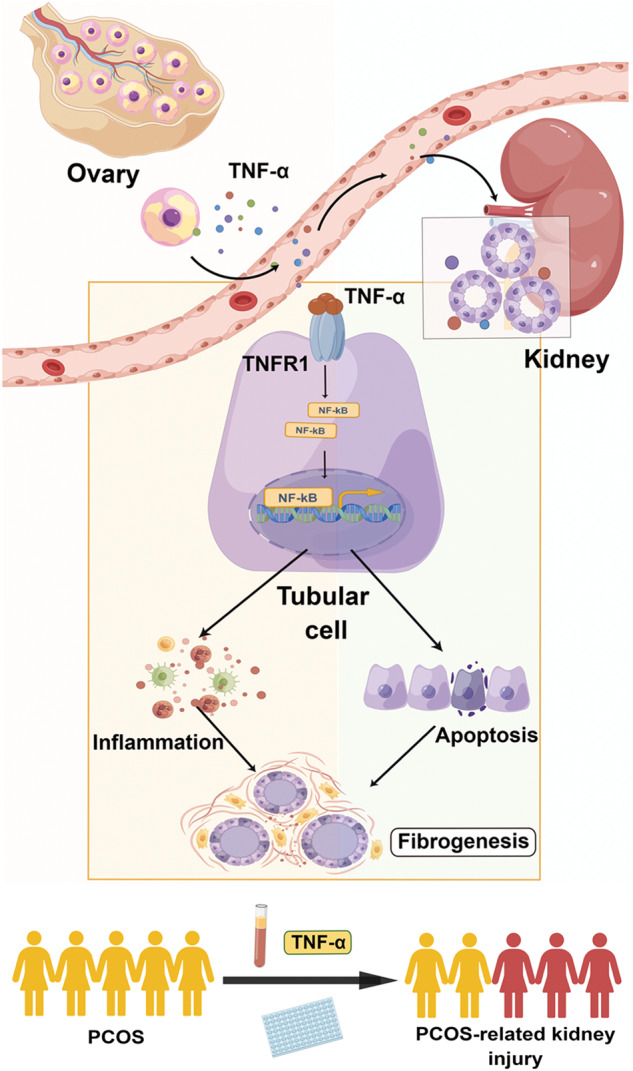
Polycystic ovary syndrome (PCOS) is a disorder with endocrinal and metabolic problems in reproductive aged women. Evidence shows that PCOS is in a high prone trend to develop kidney diseases. In this study, we investigated the mediators responsible for PCOS-related kidney injury. We found that tumor necrosis factor (TNF-α) levels were significantly increased in serum and primary cultured granulosa cells (GCs) from PCOS patients. Serum TNF-α levels were positively correlated with serum testosterone and luteinizing hormone (LH)/follicle-stimulating hormone (FSH) ratio, suggesting its positive role in the severity of PCOS. Serum TNF-α levels were also positively correlated with the levels of urinary KapU, LamU, α1-MU and β2-MU, the markers for renal tubular cell-derived proteinuria. We established a PCOS mouse model by resection of the right kidney, followed by daily administration of dihydrotestosterone (DHT, 27.5 μg, i.p.) from D7 for 90 days. We found that TNF-α levels were significantly increased in the ovary and serum of the mice, accompanied by increased renal tubular cell apoptosis, inflammation and fibrosis in kidneys. Furthermore, the receptor of TNF-α, tumor necrosis factor receptor 1 (TNFR1), was significantly upregulated in renal tubular cells. We treated human ovarian granulosa-like tumor cells (KGN) with DHT (1 μg/ml) in vitro, the conditioned medium derived from the granulosa cell culture greatly accelerated apoptotic injury in human proximal tubular epithelial cells (HKC-8), which was blocked after knockdown of TNF-α in KGN cells. Furthermore, knockdown of TNFR1 in renal tubular epithelial cells greatly ameliorated cell injury induced by granulosa cell-derived conditioned medium. These results suggest that serum TNF-α plays a key role in mediating inflammation and apoptosis in renal tubular cells associated with PCOS-related kidney injury.

Keywords: TNF-α; TNFR1; apoptosis; inflammation; kidney injury; polycystic ovary syndrome.


Conflict of interest statement

The authors declare no competing interests.

Figures

Fig. 1
Fig. 1. Serum TNF-α is correlated with the severity of PCOS and associated with tubular injury in PCOS.
a Diagram by Figdraw shows the experimental design. n = 56 in PCOS group, n = 38 in control group. b Serum T levels in PCOS and controls. c LH/FSH ratio in PCOS and controls. d Serum TNF-α levels in PCOS and controls. e Correlation between Serum TNF-α and T in PCOS and controls. f Correlation between Serum TNF-α and LH/FSH ratio in PCOS and controls. g SCr levels in PCOS and controls. h BUN levels in PCOS and controls. i UACR levels in PCOS and controls. j Correlation between Serum TNF-α and urinary KapU in PCOS and controls. k Correlation between Serum TNF-α and urinary LamU in PCOS and controls. l Correlation between Serum TNF-α and urinary α1‐MU in PCOS and controls. m Correlation between Serum TNF-α and urinary β2-MU in PCOS and controls. *P < 0.05, **P < 0.01 and ***P < 0.001 versus control subjects (n = 56 in PCOS group, n = 38 in control group).
Fig. 2
Fig. 2. TNF-α is correlated with the severity of PCOS in primary cultured GCs.
a Diagram by Figdraw shows the experimental design. b Serum T levels in PCOS and controls. c LH/FSH ratio in PCOS and controls. d TNF-α mRNA levels in GCs of PCOS and controls. e Correlation between TNF-α mRNA level and T in GCs of PCOS and controls. f Correlation between TNF-α mRNA level and LH/FSH ratio in GCs of PCOS and controls. *P < 0.05, **P < 0.01 and ***P < 0.001 versus control subjects (n = 56 in PCOS group, n = 37 in control group).
Fig. 3
Fig. 3. TNF-α is upregulated in PCOS mice.
a Experimental design. Red arrows indicate the injection of DHT (27.5 μg/day). Blue arrows indicate the time points undergoing unilateral nephrectomy (UNx). Triangle indicates sacrifice. b Vaginal cytology with H&E staining representing each stage of estrous cycles, Bar = 100 μm. c Quantitative graph showing 10 days estrous cycles in mice. Stages of estrous include proestrus (P), estrus (E), metestrus (M), diestrus (D). d Serum DHT levels in DHT and Ctrl group. **P < 0.01 versus Ctrl group, n = 5. e Representative micrographs showing the ovary structure with H&E staining. Arrows indicate cystic follicles, Bar = 200 μm. f Quantitative graph showing the number of cystic follicles in two groups. ***P < 0.001 versus Ctrl group, n = 5. g Quantitative graph showing the ratio of granulosa cell to theca cell layers in the largest follicle. ***P < 0.001 versus Ctrl group, n = 5. hk Western blot and quantitative data show the ratio of Bax/Bcl-2, and protein expressions of Cleaved caspase-3 and TNF-α in two groups. *P < 0.05, and **P < 0.01 versus Ctrl group, n = 5. l Serum TNF-α levels in two groups. ***P < 0.001 versus Ctrl group, n = 5. m Ovary tissues were subjected to immunohistochemical staining of Caspase-3 and TNF-α. Arrows indicate positive staining, Bar = 50 μm.
Fig. 4
Fig. 4. PCOS mediates apoptosis and inflammation in kidney, and promotes renal fibrosis.
ac Western blot and quantitative data show the induction of renal Cleaved PARP, and Cleaved caspase-3 in two groups. *P < 0.05, and **P < 0.01 versus Ctrl group, n = 5. d, e Graphic presentations and the representative micrographs show TUNEL-positive cells in two groups. **P < 0.01 versus Ctrl group, n = 5. Arrows indicates positive staining, Bar = 50 μm. f Graphic presentations show the relative mRNA levels of IL-1β, IL-6, CCL2 and CCL5. *P < 0.05, and **P < 0.01 versus Ctrl group, n = 5. gj Western blot and quantitative data show the protein expressions of renal Fibronectin, Vimentin, and α-SMA. *P < 0.05 versus Ctrl group, n = 5. k Kidney tissues were subjected to Masson staining and immunohistochemical staining of KIM-1 and Fibronectin. Arrows indicate positive staining, Bar = 50 μm. l Graphic presentation show the quantitative determination of kidney fibrotic lesions in two groups. ***P < 0.001 versus Ctrl group, n = 5. m Graphic presentation shows the quantitative analysis of immunohistochemical staining for KIM-1. **P < 0.01 versus Ctrl group, n = 5. np GSEA show the activation of apoptosis, inflammation, and TNF-α signaling were upregulated in DHT-treated group. Q value meaning adjusted P value. NES normalized enrichment score.
Fig. 5
Fig. 5. Renal TNFR1 is upregulated in PCOS promoting NF-κB signaling activation.
ac Western blot and quantitative data show the protein expression of renal TNFR1, and the ratio of p-p65/p65 in two groups. **P < 0.01, and ***P < 0.001 versus Ctrl group, n = 5. d Graphic presentation shows the quantitative analysis of immunohistochemical staining for TNFR1. ***P < 0.001 versus Ctrl group, n = 5. e Representative immunohistochemical staining micrographs show TNFR1 and p65 expression. Arrows indicates positive staining, Bar = 50 μm. f Representative immunofluorescence staining of micrographs show TNFR1 and Cleaved caspase-3 in DHT group. Bar = 50 μm. g Representative immunofluorescence staining of micrographs show TNFR1 and Fibronectin in DHT group. Bar = 50 μm.
Fig. 6
Fig. 6. Granulosa cell-derived conditioned medium contributes to renal tubular cell injury in vitro.
a Experimental design. KGN cells were stimulated with various dosage of DHT for 24 h. be Western blot and quantitative data show the protein expressions of FasL, the ratio of Bax/Bcl-2, and Cleaved caspase-3 in different groups. Medium alone serves as control group. **P < 0.01, and ***P < 0.001 versus controls, n = 3. f Experimental design. KGN cells were stimulated with DHT (1 μg/ml) for 6 h and then continued to be incubated for an additional 24 h in serum-free medium (DHT conditioned medium). Conditioned medium from KGN cells were collected and used to stimulate HKC-8 cells. gm Western blot and quantitative data show the protein expressions of p-p65, KIM-1, Cleaved PARP, Cleaved caspase-3, fibronectin and E-cadherin in two groups. *P < 0.05, and **P < 0.01 versus Ctrl-CM group, n = 3. n Representative micrographs show immunofluorescence staining of Fibronectin and TUNEL staining in HKC-8 cells after incubation with conditioned medium from KGN cells. Arrows indicate positive staining, Bar = 50 μm. o Graphic presentation shows the percentage of apoptotic cells in two groups. *P < 0.05 versus Ctrl-CM group, n = 3. p Graphic presentations show the relative mRNA levels of IL-1β, IL-6 and CCL5. *P < 0.05 versus Ctrl-CM group, n = 3.
Fig. 7
Fig. 7. Knockdown of TNF-α in granulosa cell decreases renal tubular cell injury in vitro.
a, b Western blot and quantitative data show the protein expression of TNF-α in KGN cells with different dosage of DHT. Medium alone serves as control group. **P < 0.01, and ***P < 0.001 versus controls, n = 3. c Graphic presentations show TNF-α expression in supernatant of cultured KGN cells. *P < 0.05 versus Ctrl-CM group, n = 4. d Graphic presentations show the relative mRNA level of TNF-α in KGN cells transfected with TNF-α siRNA. **P < 0.01 versus NC group, n = 3. e, f Western blot and quantitative data show the protein expression of TNF-α in KGN cells transfected with TNF-α siRNA prior to the stimulation of DHT. *P < 0.05 versus NC + DHT group, n = 3. g Experimental design. TNF-α was knocked down in KGN cells prior to the treatment of DHT, and then the conditioned medium (TNF-α siRNA + DHT-CM) was collected to stimulate HKC-8 cells for 24 h. h Graphic presentations show content of TNF-α in supernatant of cultured KGN cells. **P < 0.01 versus NC + DHT-CM group, n = 3. iq Western blot and quantitative data show the protein expressions of TNFR1, p-p65, KIM-1, Cleaved PARP, Cleaved caspase-3, E-cadherin, Collagen I and Fibronectin in two groups. *P < 0.05, **P < 0.01 and ***P < 0.001 versus NC + DHT-CM group, n = 3. r Graphic presentations show the relative mRNA levels of IL-1β and IL-6. *P < 0.05, and **P < 0.01 versus NC + DHT-CM group, n = 3. s Representative micrographs show immunofluorescence staining of Fibronectin in HKC-8 cells in two groups. Arrows indicate positive staining, Bar = 50 μm.
Fig. 8
Fig. 8. Knockdown of TNFR1 in HKC-8 cells attenuates granulosa cell-derived tubular cell injury in vitro.
a Experimental design. HKC-8 cells were transfected with siRNA to TNFR1 for 6 h, and then incubated with conditioned medium (DHT-CM) from KGN cells for 24 h. b Graphic presentations show the relative mRNA levels of TNFR1 in HKC-8 cells. ***P < 0.001 versus NC group, n = 3. cj Western blot and quantitative data show the protein expressions of TNFR, p-p65, KIM-1, Cleaved PARP, Cleaved caspase-3, E-cadherin, and Fibronectin in two groups. *P < 0.05, **P < 0.01, and ***P < 0.001 versus NC group, n = 3. k Graphic presentations show the relative mRNA levels of IL-1β and IL-6. *P < 0.05, and **P < 0.01 versus NC group, n = 3.
Fig. 9
Fig. 9. Working model.
The schematic presentation by Figdraw depicts the potential mechanism by which TNF-α/TNFR1 axis mediates renal fibrosis. TNF-α is induced in ovary, and then secrets into blood. Serum TNF-α is transferred to kidney and then binds to its receptor TNFR1 in tubular cells. TNF-α/TNFR1 axis triggers NF-κB signaling, and then activates cell inflammation and apoptosis, promoting renal fibrogenesis. Monitoring of serum TNF-α levels in PCOS women could be used to associate PCOS-induced kidney injury.

Similar articles

Cited by

References

    1. Jones GL, Hall JM, Balen AH, Ledger WL. Health-related quality of life measurement in women with polycystic ovary syndrome: a systematic review. Hum Reprod Update. 2008;14:15–25. doi: 10.1093/humupd/dmm030. - DOI - PubMed
    1. Li R, Zhang Q, Yang D, Li S, Lu S, Wu X, et al. Prevalence of polycystic ovary syndrome in women in China: a large community-based study. Hum Reprod. 2013;28:2562–9. doi: 10.1093/humrep/det262. - DOI - PubMed
    1. Azziz R, Carmina E, Chen Z, Dunaif A, Laven JS, Legro RS, et al. Polycystic ovary syndrome. Nat Rev Dis Prim. 2016;2:16057. doi: 10.1038/nrdp.2016.57. - DOI - PubMed
    1. Fauser BC, Tarlatzis BC, Rebar RW, Legro RS, Balen AH, Lobo R, et al. Consensus on women’s health aspects of polycystic ovary syndrome (PCOS): the Amsterdam ESHRE/ASRM-sponsored 3rd PCOS consensus workshop group. Fertil Steril. 2012;97:28–38.e25. doi: 10.1016/j.fertnstert.2011.09.024. - DOI - PubMed
    1. Stepto NK, Cassar S, Joham AE, Hutchison SK, Harrison CL, Goldstein RF, et al. Women with polycystic ovary syndrome have intrinsic insulin resistance on euglycaemic-hyperinsulaemic clamp. Hum Reprod. 2013;28:777–84. doi: 10.1093/humrep/des463. - DOI - PubMed

Substances